Abstract
This study describes functional characterization of two putative poplar PHOTOPERIOD RESPONSE 1 (PHOR1) orthologues. The expression and sequence analyses indicate that the two poplar genes diverged, at least partially, in function. PtPHOR1_1 is most highly expressed in roots and induced by short days, while PtPHOR1_2 is more uniformly expressed throughout plant tissues and is not responsive to short days. The two PHOR1 genes also had distinct effects on shoot and root growth when their expression was up- and downregulated transgenically. PtPHOR1_1 effects were restricted to roots while PtPHOR1_2 had similar effects on aerial and below-ground development. Nevertheless, both genes seemed to be upregulated in transgenic poplars that are gibberellin-deficient and gibberellin-insensitive, suggesting interplay with gibberellin signalling. PHOR1 suppression led to increased starch accumulation in both roots and stems. The effect of PHOR1 suppression on starch accumulation was coupled with growth-inhibiting effects in both roots and shoots, suggesting that PHOR1 is part of a mechanism that regulates the allocation of carbohydrate to growth or storage in poplar. PHOR1 downregulation led to significant reduction of xylem formation caused by smaller fibres and vessels suggesting that PHOR1 likely plays a role in the growth of xylem cells.
Key words: Biomass, dormancy, growth, poplar, starch, xylem
Introduction
Plants generally allocate biomass to organs that assimilate the most limiting resources for their growth and development (Thornley, 1972; Bloom et al., 1985). Regulation of biomass growth and allocation is of major importance in response to abiotic stress, shade avoidance, and cyclical seasonal changes (Hermans et al., 2006; Forster et al., 2011; Ruberti et al., 2011). The regulatory mechanisms governing these responses are important for adaptation, and increased nutrient-use efficiency and recycling. However, the underlying molecular mechanisms are still poorly understood.
Previous work has detected significant coordination between shoot and root growth in a Populus tree and that the regulatory mechanisms are, at least in part, mediated by gibberellin (GA) signalling and metabolism (Busov et al., 2006; Gou et al., 2010, 2011). GA-insensitive or -deficient transgenics with severely reduced shoot growth produce extensive root systems, which can be several-fold larger than in wild-type (WT) plants (Gou et al., 2010), whereas high GA concentrations lead to increased shoot growth but suppress root proliferation (Gou et al., 2011). These responses are typically observed under water or nutrient deficiency or during shade avoidance. For example, insufficient light leads to increased shoot growth but suppressed root development (Ruberti et al., 2011). Nutrient and water deficiencies elicit root proliferation but suppress shoot growth (Forster et al., 2011).
The mechanism(s) behind these responses are still poorly understood. Uncoupling the morphological responses from their environmental triggers through genetic manipulation provides an experimental system for understanding their molecular underpinnings. In an attempt to better understand these regulatory mechanisms, a microarray analysis was previously performed on the above-mentioned transgenic poplars. One of the most upregulated transcripts in the transgenic plants was a putative poplar orthologue of PHOTOPERIOD RESPONSE1 (PtPHOR1) (Gou et al., 2010).
PHOR1 was first isolated from potato (Solanum tuberosum) in a screen for regulators that promote tuberization (Amador et al., 2001). Tuberization is a process associated with switch of elongation from to radial growth and accumulation of massive amounts of reserve substances, such as starch, in modified underground structures known as stolons (Abelenda et al., 2011). This process is initiated by short days or cold temperatures, which signal the onset of winter. A screen for transcripts that are upregulated in the leaves of plants exposed to short days led to the identification of PHOR1. Plants in which PHOR1 expression was inhibited by antisense transgenes displayed reduced growth and GA responsiveness, while PHOR1 overexpression enhanced overall growth and increased GA responsiveness. PHOR1 encodes an arm-repeat domain and U-box-containing protein. U-box-containing proteins are typically a class of E3 ubiquitin ligases that facilitate ubiquitination of specific proteins targeted for degradation (Pringa et al., 2001). As far as is known, the function of PHOR1 in other species, including the model plant Arabidopsis thaliana, has not been reported to date.
Poplars (species within the genus Populus) and other woody perennial species from temperate climates survive harsh winter conditions through a temporary cessation of growth known as dormancy. Typically, the process is initiated by sensing critical shortening of the photoperiod, cessation of shoot and vascular cambium growth, and development of buds, which contain the shoot apical meristem (Lang, 1987). In addition, significant changes in metabolism occur. Most importantly, primary metabolism is shifted to increased production of storage compounds, such as starch, particularly in roots (Nguyen et al., 1990; Regier et al., 2010). The mechanisms that drive these morphological and metabolic changes are still poorly understood.
This study investigates the role of the two poplar PHOR1 orthologues in controlling vegetative growth and allocation of photosynthate to shoots and roots. It shows that both genes are involved in regulating shoot and root growth, as well as starch accumulation. The results also show functional divergence of the two genes that operates at both gene expression and protein levels.
Materials and methods
Plasmid construction and transformation
For overexpression constructs, the open reading frames of PtPHOR1_1 (POPTR_0007s03730) and PtPHOR1_2 (POPTR_0005s05880) were amplified via PCR using primers containing the HindIII and BamHI restriction sites: 5′-GGGGAAGCTTATG GTGAGAGACGTA-3′ and 5′-CCCCGGATCCTC AGAAGGGCATGAT-3′. The amplified fragments were inserted into the shuttle vector pART7 between its HindIII and BamHI sites, downstream of the cauliflower mosaic virus (CaMV) 35S promoter and upstream of the octopine synthase (OCS) terminator. The expression cassette was transferred from pART7 into the pART27 binary vector using the unique NotI restriction site (Gleave, 1992).
An RNA interference (RNAi) construct was assembled using a 377-base pair (bp) region from PtPHOR1_1 that was amplified via PCR using the following primers, which contained attB1 and attB2 sites: 5′-GGGGACAAGTTTGTACA AAAAAGCAGGCTGCGAGCGTTTCGATCATAGAAAAG-3′ and 5′-GGGGA CCACTTTG TACAAGAAAGCTGGGTTCAGAAGGGCATGATATGAGTAGTCTT-3′. The amplified fragment was cloned into the pHellsgate2 vector using the Gateway system (Invitrogen). All constructs were sequence-verified and then transformed into Agrobacterium tumefaciens via the freeze–thaw method (Holsters et al., 1978). Strain C58 was transformed with the overexpression construct and AGL1 with the RNAi construct. An Agrobacterium-mediated protocol (Filichkin et al., 2006) was used to introduce constructs into hybrid aspen clone INRA 717–1B4 (Populus tremula × Populus alba). At least 20 independent events for each constructs were regenerated and PCR-validated for the presence of their respective transgenes.
RNA extraction and reverse-transcription PCR analysis
Total RNA was isolated using the RNeasy Plant Mini Kit with on-column genomic DNA digestion using RNase-Free DNaseI (Qiagen). cDNA was synthesized from 2 μg of DNaseI-treated total RNA using Superscript III reverse transcriptase (Invitrogen) with an oligo-dT primer in a reaction volume of 1 μl. The following primers were used in the reverse-transcription PCR experiments to amplify PtPHOR1_1 and PtPHOR1_2: PHOR1_1 (5′-TCCAGACTCAGAAAGACAACC-3′ and 5′-CAACAAGCATTTCAACAAAGCC-3′) and PHOR1_2 (5′-AATGAGAGCCCAGAAGGAG-3′and 5′-CAAGAAGGAGAGA- GAAGACAAAC-3′). Relative expression values were normalized to expression of ubiquitin gene (eugene3.00002054) using the following primers: 5′-AGAGTGTGAGAGAGAGAAGAG-3′ and 5′-CGACGACCATCAAACAAGAAG-3′. Primers used for amplification of IAA genes were as follows: F_PttIAA1 5′-GAGAGAGAGAAGAAGAAGAGGG-3′; R_PttIAA1 5′-AGGATC- ATTAGGGCGAGGAG-3′; F_PttIAA4 5′-AGCATCTCAGCCTCTCA- AC-3′; R_PttIAA4 5′-TCCCCAACAATCAACCAATC-3′; F_PttIAA8 5′-AAACTGCTCCTCCACCCATC-3′; R_PttIAA8 5′-TCCAACCAAC- ATCCAATCTCC-3′.
Auxin measurements
Endogenous indole-3-acetic acid (IAA) was measured on 1-month-old in vitro-grown plants. Frozen tissue samples were extracted following the procedure for free IAA determination outlined in Bialek and Cohen (1992). Briefly, tissue samples were homogenized and extracted in isopropanol/0.2M (pH 7.0) imidazole buffer (65:35, v/v) using a 1.5 buffer-to-tissue volume ratio. Each sample was spiked with 40ng [13C6] IAA internal standard (Cambridge Isotope Laboratories, Andover, MA, USA) per g frozen weight to determine endogenous IAA levels. After vortexing and centrifuging to remove tissue debris, supernatants were diluted 4.5-fold in preparation for solid-phase extraction. Samples were then loaded onto 3-cc Oasis MAX SPE columns (Waters Corporation, Milford, MA, USA), previously conditioned and equilibrated with equal volumes of methanol and deionized distilled water, respectively. Each sample was washed with equal volumes of 5% ammonium hydroxide in water and in methanol, and then eluted with 2ml of 2% formic acid in methanol. The solvent was evaporated in a Savant Speedvac (Thermo Scientific, Waltham, MA, USA) at 30 °C for approximately 2.5h, and then resuspended in 200 μl methanol in preparation for derivatization by methylation. Samples were derivatized by adding 250 μl dichloromethane followed by 5 μl of 2M trimethysilyl diazomethane in hexanes at room temperature for 30min. To remove excess diazomethane and stop methylation, 5 μl of 2M acetic acid in hexanes was added per sample. Samples were then evaporated overnight in a fume hood, washed with 100 μl acetonitrile and dried in a Speedvac at 30 °C twice, and resuspended in 30 μl ethyl acetate for gas chromatography/mass spectrometry (GC-MS) analysis. The GC injector and transfer port temperatures were set to 260 °C. Helium gas was used as a carrier with a flow rate of 1ml min–1. A DB-5 column (10 m × 0.18mm × 0.20 μm) was used. The temperature program for GC consisted of 80 °C for 2min, 20 °C min–1 ramp up to 260 °C, then 260 °C for 2min. Injection volume was 5 μl with a 1:5 column split ratio. The MS mode had an electron emission of 70eV and a mass range of 70–200 m/z. The 130/189 and 136/195 m/z ratios were monitored to determine endogenous IAA levels as compared to the internal standard. Absolute amounts of IAA were calculated according to a standard curve developed using the [13C6] IAA standard.
Analysis of root and shoot anatomy
Stem segments at the 15th internode were sampled and processed as previously described (Zawaski et al., 2011), using 5-μm sections stained with haematoxylin and eosin. For fibre length analysis, a modified version of Franklin′s maceration technique was used (Franklin, 1945). Stem segments, consisting of the entire section of the 15th internode (approximately 2cm in length), were incubated at 60 °C for 24h in equal volumes of glacial acetic acid and hydrogen peroxide. After 24h of incubation, the samples were washed with deionized distilled water and a small amount of the resulting pulp was stained with Safarinin O. All sections and fibres were observed with a fluorescent microscope (Ernst Leitz, Wetzlar, Germany) with SPOT Insight QC camera and advanced SPOT software (Diagnostic Instruments). Slide measurements were performed in ImageJ version 1.38 (National Institutes of Health). For roots, sections were made approximately 2mm from the tips of fine roots with a diameter threshold of 4mm. Root sections were stained with I2KI solution for visualization of starch, as described in Wargo (1975). Pictures were taken with a Sony 3CCD DKC-5000 microscope and camera system.
Phenotypic characterization and tissue collection
Plants were micropropagated in vitro on hormone-free half-strength Murashige and Skoog media containing 2% sucrose and 7% agar. For greenhouse experiments, after 1 month of in vitro growth, plants were transferred to a greenhouse and grown in a commercial potting mix (Sunshine Mix #1, Sun Gro Horticulture, Bellevue, WA, USA), under continuous irrigation, fertilization, and pest control. To study the expression of the PtPHOR1 genes in different plant tissues, WT plants were grown for 3 months before tissues were harvested. For transgenic characterization experiments, plants were measured and harvested at 105 d for 35S::PtPHOR1_1 and 35S::PtPHOR1_2, and 120 d for PtPHOR1-RNAi plants. All leaf and internode numbers refer to measurements made at the respective leaf-plastochron index. Height was measured as the total length of the stem from base to apex. Stem diameter was measured 5cm from the root-collar and internode distance was calculated as the mean of all internode distances in a given plant. Tissues for dry biomass estimation were dehydrated at 70 °C until a constant weight was achieved. Dormancy experiments were performed in a growth chamber (Conviron, Pembina, ND, USA) on 3-month-old plants. To induce dormancy, the photoperiod under which plants were grown was changed from long days (16/8 light/dark) to short days (8/16 light/dark). Stem elongation was measured and bud formation was observed weekly. Leaves of WT plants subjected to long and short days were collected at the same time weekly for expression analysis.
For all in vitro experiments, microshoots were grown for 1 month and then tissues were collect for expression studies and/or final plant measurements made. Expression analysis was performed on shoot and leaf tissue in WT plants grown in media without hormones (control) or supplemented with GA3 (5 μM) and paclobutrazol (10 μM). The concentrations of GA3 and paclobutrazol used caused pronounced increases and decreases in plant stem elongation, respectively. Differences in adventitious rooting were measured on overexpressed transgenics and WT plants grown in media with or without indole-3-butyric acid supplement (IBA, 0.5 μM). Data was collected on the number of stem cuttings to root for each treatment. Generation and characterization of GA-deficient (35S::PcGA2ox) and -insensitive (35S::gai and 35S::rgl1) transgenics have been previously described (Busov et al., 2003, 2006). Expression of these transgenes elicit a gradient in phenotypic response ranging from severe dwarfism to nearly WT-like (Zawaski et al., 2011). For expression analysis of GA-modified transgenics, leaves were collected from 2-year-old field-grown gai-expressing plants with different phenotypic severities, as indicated by their heights. Leaves were collected from 3-month-old greenhouse-grown PcGA2ox- and rgl1-expressing plants that had been previously characterized as having dwarf and semidwarf phenotypes (Gou et al., 2011; Zawaski et al., 2011).
Statistical and bioinformatics analysis
Statistical analysis was performed in SigmaStat (Systat Software). Number of ramets and lines used in each experiment are specified in figure and/or table captions. A Student′s t-test or analysis of variance (ANOVA) followed by Dunnett′s post-hoc test was used to test for significant differences (P < 0.05) between WT and transgenic line(s). Identity and similarity among sequences where calculated using the MatGAT program (Campanella et al., 2003).
Results
Upregulation of poplar PHOR1-like genes in GA-insensitive and -deficient transgenics
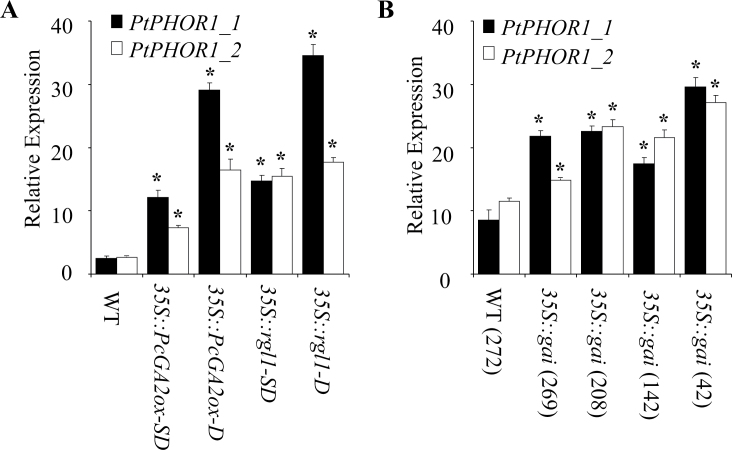
Microarray analysis identified a gene, designated PtPHOR1_1 (POPTR_0007s03730), that encodes a putative protein with high sequence similarity to the potato PHOTOPERIOD RESPONSE1 (PHOR1) gene (Amador et al., 2001) that was highly upregulated in GA-deficient and -insensitive poplar transgenics. The generation, initial characterization, and array analysis of the transgenics have been previously described (Busov et al., 2006; Gou et al., 2010). In addition, similarity searches in the poplar genome found another PHOR1 gene (PtPHOR1_2; POPTR_0005s05880). Gene-specific primers were designed to perform reverse-transcription PCR expression analyses for both genes. PtPHOR1_1 and PtPHOR1_2 were significantly upregulated in both the GA-insensitive and -deficient transgenics (Fig. 1A, 1B). This study also observed a general increase in the expression of the PtPHOR1 genes (albeit exceptions to this trend did occur) in relation to the increased severity of the GA-deficient/insensitive dwarf phenotype observed in these transgenics (denoted by height reduction).
Fig. 1.
Modified expression of PtPHOR1 genes in GA-deficient (35S::PcGA2ox) and GA-insensitive (35S::rgl1 and 35S::gai) transgenic poplar (genotype 717-IB4). Bars represent event mean ± SE for reverse-transcription PCR expression normalized to UBQ for three biological replicates performed on leaf samples collected from 3-month-old greenhouse plants (A: D, dwarf; SD, semi-dwarf) and 2-year-old field-grown plants (B; numbers in parentheses indicate the plant height in cm). Asterisks indicate significant difference (P < 0.05) between transgenic and wild-type (WT) events as determined by ANOVA followed by Dunnett′s post-hoc test.
Expression patterns of the two PHOR1 genes
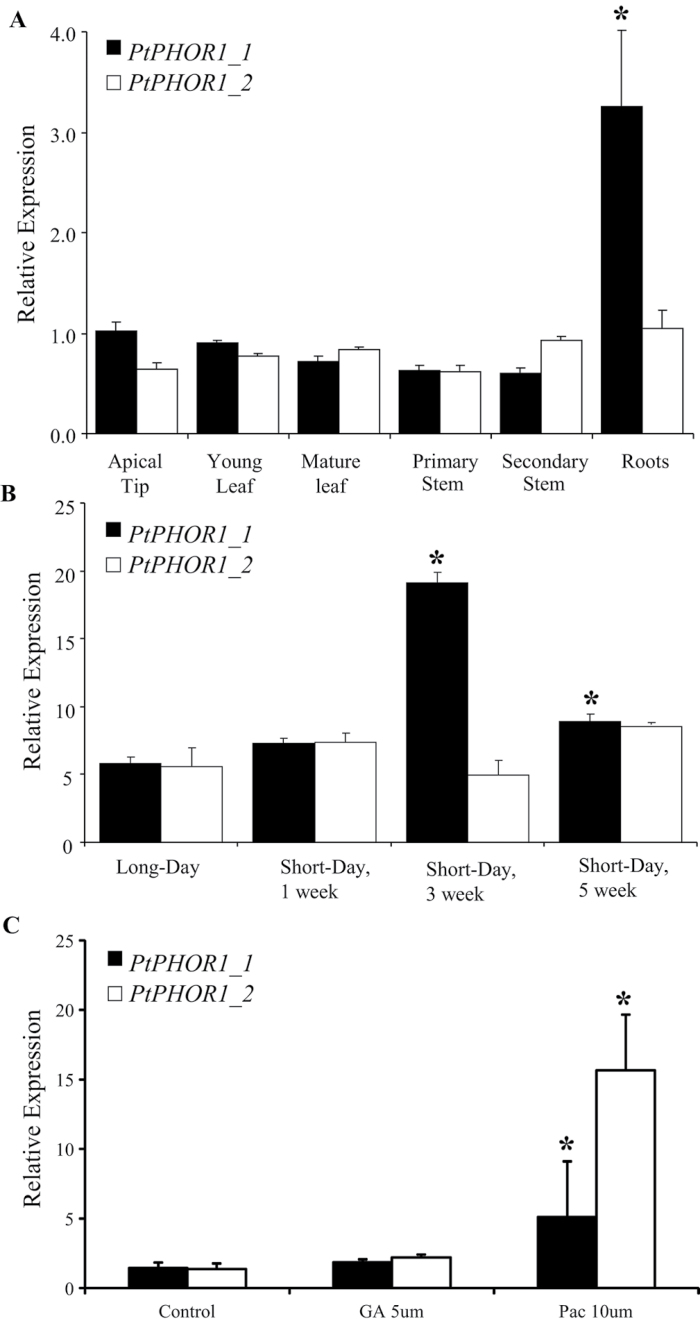
The expression of the two poplar PHOR1 genes was studied in a variety of tissues (Fig. 2A). PtPHOR1_1 transcript was highly abundant in roots and nearly equally expressed in all other organs tested. Expression of PtPHOR1_2 was similar in all tissues analysed. Because potato PHOR1 was found to be responsive to short-day photoperiods (Amador et al., 2001), the present study investigated if this response was conserved in poplar (Fig. 2B). PtPHOR1_1 transcript abundance was highly and significantly increased following 3 weeks of short-day treatment, while PtPHOR1_2 expression was completely non-responsive to short-day treatment.
Fig. 2.
Expression of PtPHOR1 genes in wild-type poplars. Expression was studied in 3-month-old 717-IB4 tissues (A) and leaves subjected to short-day treatment (B). Bars represent mean ± SE for reverse-transcription PCR results normalized to UBQ and CYC. In (A), means are based on three biological replicates: young leaf, leaf-plastochron index=4–7 and expanding; mature leaf, leaf-plastochron index=15 and fully expanded; primary stem, leaf-plastochron index=2–6 and undergoing primary growth; secondary stems, leaf-plastochron index=15–18 and undergoing secondary (woody) growth and roots, soft non-lignified tips. In (B), expression in plants grown under long days (16/8 light/dark) compared to plants that were subsequently subjected to short days (8/16 light/dark) for 1, 3, and 5 weeks; means are based on two biological replicates (each composed of three technical replicates) on pooled leaf samples (leaf-plastochron index=7–10) collected from five wild-type plants. In (C), hormonal treatments are described in the Materials and methods (GA, gibberellin; Pac, paclobutrazol). All treatments were performed with at least two biological replications. Asterisks indicate significant difference (P < 0.05) by ANOVA followed by Tukey′s post-hoc test (A), t-test between long-day and short-day values (B), and t-test between control and treatment (C).
PtPHOR1 overexpression caused declines in adventitious root formation and agravitropic root growth
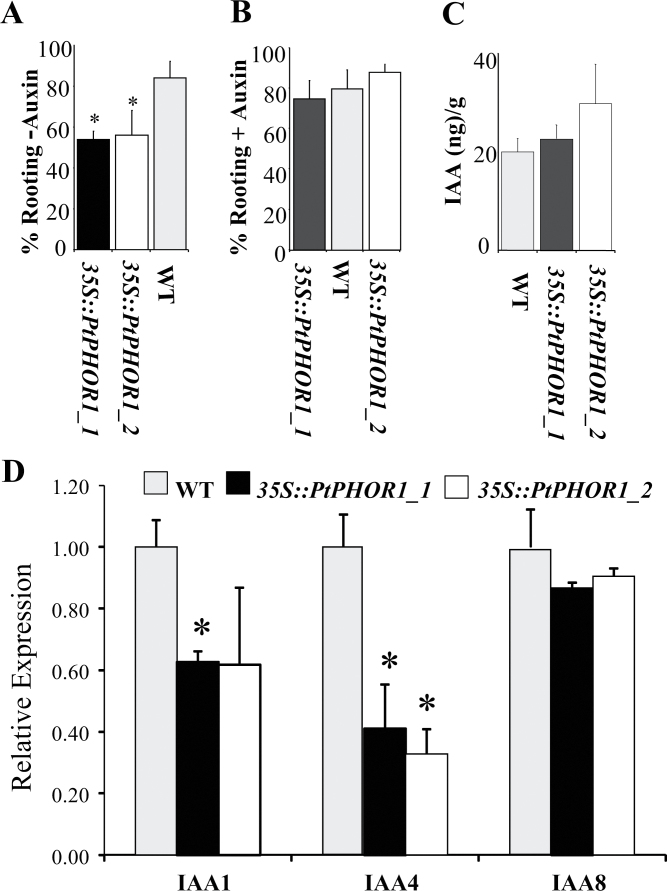
To determine their function with respect to poplar growth and development, PtPHOR1_1 and PtPHOR1_2 were overexpressed in transgenic poplar under the control of the 35S promoter. Six lines (independent insertional events) were selected for each gene and upregulation of the respective transcripts confirmed in five of them (Supplementary Fig. S1, available at JXB online). All PtPHOR1-overexpressing lines showed a drastic decline in adventitious root formation on hormone-free media, so a rooting test was performed on media with and without auxin (Fig. 3A, B). In the absence of auxin, transgenic stem cuttings had significantly lower rooting than WT segments (Fig. 3A). Because of the strong dependence on auxin, it was hypothesized that PtPHOR1 overexpression may affect endogenous auxin levels. Therefore, IAA was measured in transgenic and WT plants but no significant differences were found (Fig. 3C).
Fig. 3.
Overexpression of PtPHOR1_1 and PtPHOR1_2 impaired adventitious rooting. (A, B) Rooting was impaired in an auxin-dependent manner; microshoots were grown for 1 month in media without (A) or with (B) 0.5 μM indole-3-butyric acid; bars represent mean ± SE of wild-type (WT) and transgenic plants 1 month post-propagation, from two independent experiments with at least 16 WT plants and six independent transgenic events with at least four ramets/event for each transgenic line and treatment; rooting percentage is the percentage of stem cuttings that rooted (as denoted by visible initiation of at least one adventitious root) out of the total number of stem cuttings that were used in the experiment. (C) Endogenous indole-3-acetic acid content in plants propagated in vitro from stem cuttings; bars represent mean ± SE based on three events, each with three repetitions, for both transgenic types and three WT replicates, each replicate consisting of shoots and leaves of four plants grown in a single tissue culture box. (D) Expression of IAA1, 4 and 8 was studied in three events, for both transgenic types and three WT replicates. Asterisks indicate significant difference (P < 0.05) by t-test.
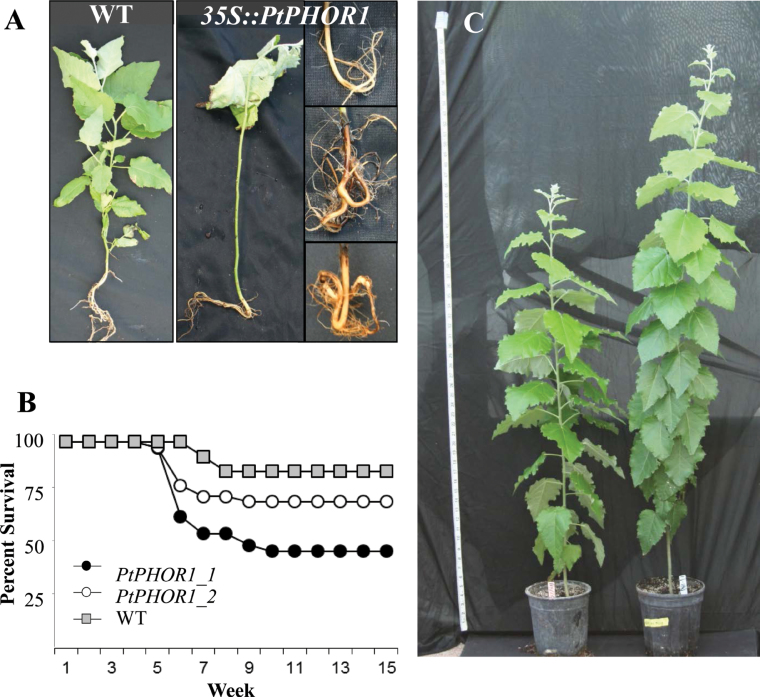
This study also observed, after transfer to greenhouse conditions, that many of the transgenic plants exhibited severe agravitropic root growth, which led to a poorly developed, ball-like root system (Fig. 4A), wilting, and low survival (Fig. 4B). The tap roots were either bent upward or completely entangled in the ball-like structure (Fig. 4A). Consistent with its expression in roots, the transgenics overexpressing PtPHOR1_1 were much more affected than those containing 35S::PtPHOR1_2, as evidenced by the significantly greater increase in their mortality (Fig. 4B). Despite the initial problems with root initiation and agravitropism, most of the lines were able to overcome these abnormalities and later developed a root system that was significantly larger than the WT (see below).
Fig. 4.
Abnormal root growth in 35S::PtPHOR1 transgenics affected early greenhouse survival. (A) Abnormal root growth, plant wilting, and leaf loss in transgenics compared with wild-type (WT) at 4 weeks post plantlet greenhouse acclimation when plants were transplanted to larger pots. (B) Percentage of plants that survived after growing in a greenhouse for 15 weeks. (C) Greenhouse-grown WT (left) and transgenic (right) plants at 15 weeks. Fifteen WT plants and six transgenic events with at least six ramets/event were used in the experiment (this figure is available in colour at JXB online).
PHOR1 overexpression enhances shoot and root growth
The poor survival and abnormal root development of transgenic plants, following greenhouse establishment (Fig. 4), were likely a result of higher sensitivity to the transplanting stress, as the transgenic plants that survived initial abnormalities in root growth later developed normal root systems. This study found significant increases in several growth parameters of PtPHOR1-overexpressing plants (Table 1). The PtPHOR1_2-overexpressing transgenics produced significantly greater amounts of stem and root biomass, while the 35S::PtPHOR1_1 plants showed only a significant increase in root biomass. Neither of the two transgenes had a significant effect on leaf biomass.
Table 1.
PtPHOR1 overexpression increases biomass
Values are mean ± SE biomass of plants grown in a greenhouse for 105 days. *, P < 0.05 by t-test.
| Genotype | Stem (g) | Leaf (g) | Roots (g) |
|---|---|---|---|
| 35S::PtPHOR1_1 | 8.79±1.01 | 13.61±1.47 | 6.19±0.60* |
| 35S::PtPHOR1_2 | 12.6±0.86* | 17.79±9.46 | 6.55±0.28* |
| Wild-type | 8.44±1.12 | 11.65±1.79 | 4.35±0.36 |
RNAi suppression of PHOR1 inhibits shoot and root growth
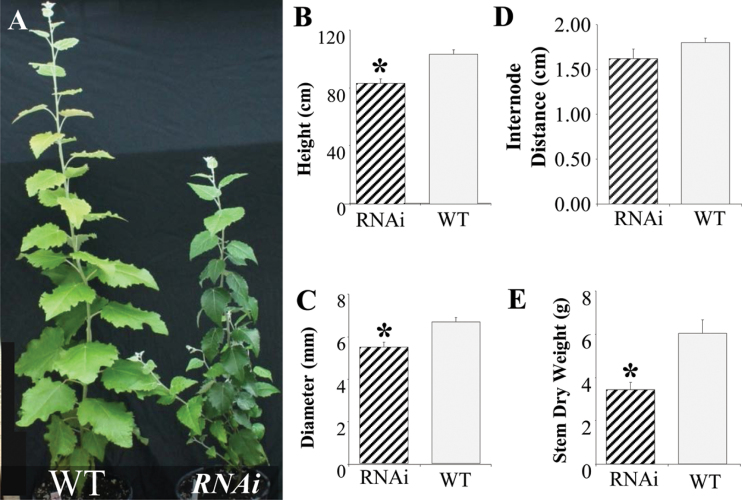
Because of the significant overlap in the expression of the two genes (Fig. 2A), both were targeted for suppression. A 337-bp region of 95% sequence identity between the two genes was used to generate an RNAi construct. Two lines (1 and 2), with significant (P < 0.05) suppression of PtPHOR1_1 and PtPHOR1_2 expression in both roots and leaves (Supplementary Fig. S2), were used in all subsequent experiments. The PtPHOR1-suppressed transgenics showed decreased growth very early in their greenhouse development (Fig. 5), including significant reductions in height, stem diameter, and stem growth (Fig. 5B–E), as well as decreases in leaf, stem, and root biomass (Table 2).
Fig. 5.
Suppression of PtPHOR1 caused a reduction of shoot growth. Results are for 4-month-old greenhouse-grown PtPHOR1 RNA interference (RNAi) transgenics. (A) Above-ground phenotype of representative wild-type (WT) and transgenic plants. (B–E) Shoot growth measurements; bars represent mean ± SE of two RNAi lines, each with at least four ramets, and 10 WT plants: (B) the total length of the stem from base to apex; (C) stem diameter 5cm above the root-collar; (D) internode distance calculated as the mean distance of all internodes in a plant; and (E) dry biomass estimation at 70 °C. All measurements were taken at 120 days. Asterisks denote significant difference (P < 0.05) from WT as determined by ANOVA followed by Dunnett′s post-hoc test (this figure is available in colour at JXB online).
Table 2.
PtPHOR1 suppression decreases biomass accumulation
Values are mean ± SE percentage change in biomass expressed as proportion of wild-type plants grown in the same experiment. *, P < 0.05 by t-test compared to wild-type.
| Genotype | Stem | Leaf | Roots |
|---|---|---|---|
| 35S::PtPHOR1_1 | 104.23±11.98 | 116.83±18.2 | 142.38±19.92* |
| 35S::PtPHOR1_2 | 145.01±10.64* | 146.92±16.7 | 145.84±10.15* |
| PtPHOR1-RNAi | 56.70±5.49* | 55.30±5.51* | 43.79±5.98* |
| Wild-type | 100.00±11.8 | 100.00±14.69 | 100.00±11.29 |
PtPHOR1 suppression leads to root tip swelling and starch accumulation
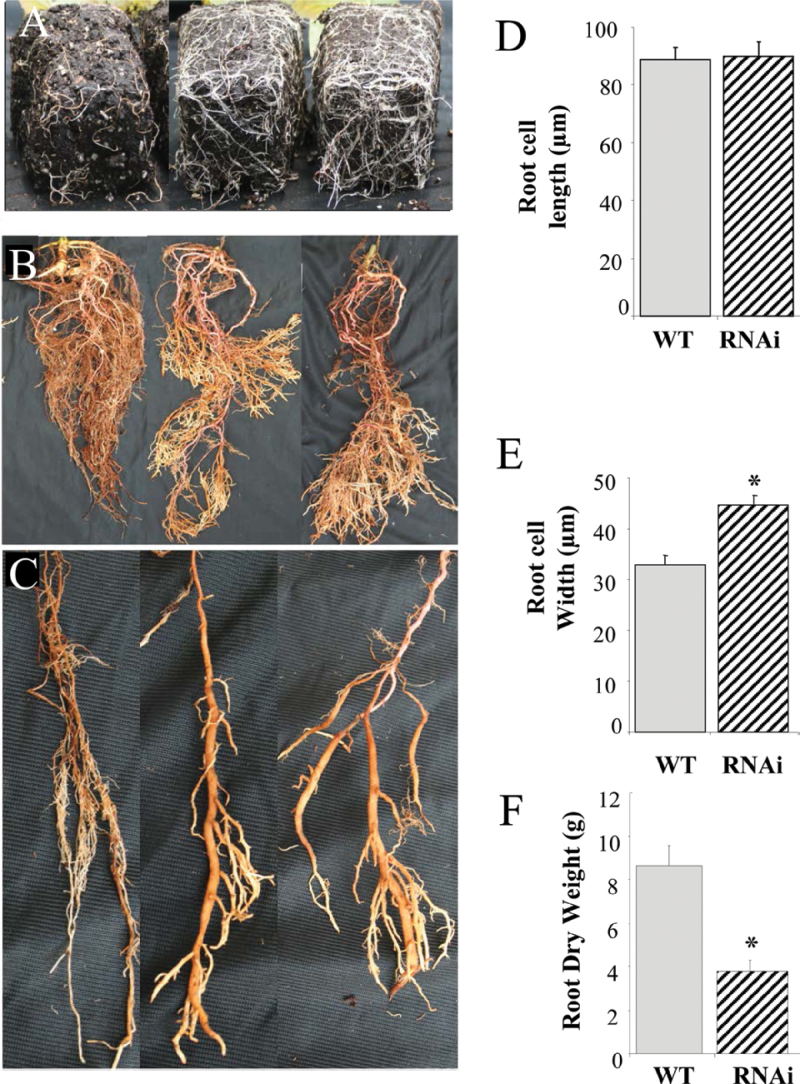
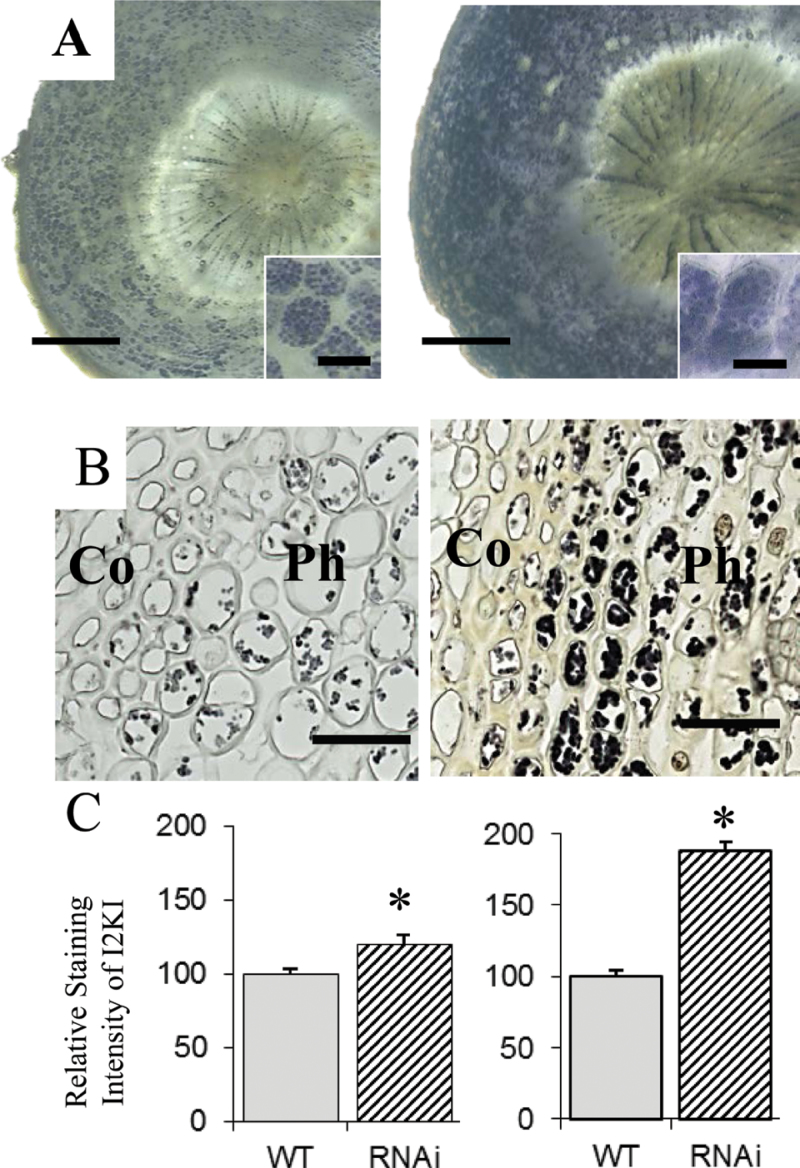
The RNAi plants exhibited lateral roots that were less branched, short, and had swollen tips, and the bulk of the root mass was concentrated toward the bottom of the root system (Fig. 6A–C). The changes in root architecture resulted in significant reductions in root biomass (Fig. 6F, Table 2). To better understand the root phenotype, cross-sections were taken through the affected tissues. Anatomical analysis revealed that cortex cells were significantly larger in diameter (Fig. 6E). Because the root swelling in transgenics resembled a tuber and PHOR1 is known to be involved in tuber formation in S. tuberosum (Amador et al., 2001; Monte et al., 2003), the present study investigated whether the swelling result from accumulation of starch. Staining root sections with K2I indeed showed significantly greater starch accumulation in the RNAi plants (Fig. 7A).
Fig. 6.
Downregulation of PtPHOR1 changed root architecture. (A–C) Altered root morphology of PtPHOR1 RNAi transgenics after 45 days (A) and 90 days (B and C) in a greenhouse; representative wild-type (WT, left) and transgenic roots (middle and right). (D, E) Root cortex cell length (D) and width (E) measured 2mm from the root tips on radial sections of two RNAi lines, with three ramets each, and three WT plants. (F) Root dry weight of two RNAi lines, each with at least four ramets and 10 WT plants. Bars represent event mean ± SE. Asterisks indicate significant difference (P < 0.05) from WT as determined by ANOVA followed by Dunnett′s post-hoc test (this figure is available in colour at JXB online).
Fig. 7.
Starch accumulation was increased in PtPHOR1 RNAi transgenics. (A, B) I2KI stained root cross-sections approximately 6cm from the root tips, inset showing magnification of cortex cells (A), and stem cross-sections (B) of phloem (Ph) and cortex (Co) cells at the 15th internode in wild-type (WT, left) and PtPHOR1-RNAi transgenic (right) plants. (C) Intensity of I2KI staining in cortex cells of root sections (left) and phloem cells of stem sections (right) quantified with ImageJ version 1.38. Asterisks indicate significant difference (P < 0.05) from WT by t-test. Bars: 0.5mm (A), 50 μm (A insets), and 25 μm (B).
RNAi suppression promotes phloem but inhibits xylem formation
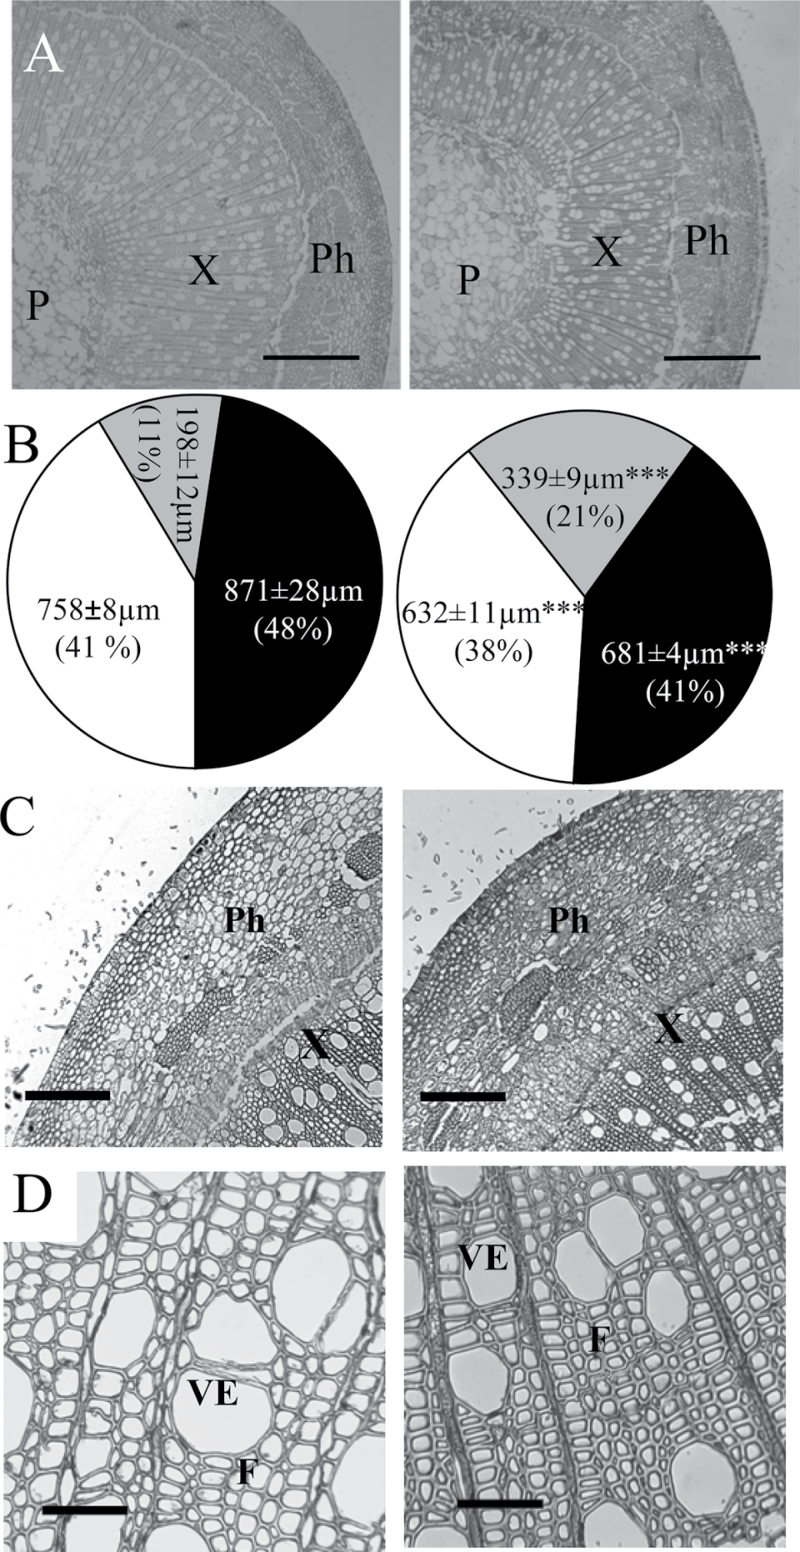
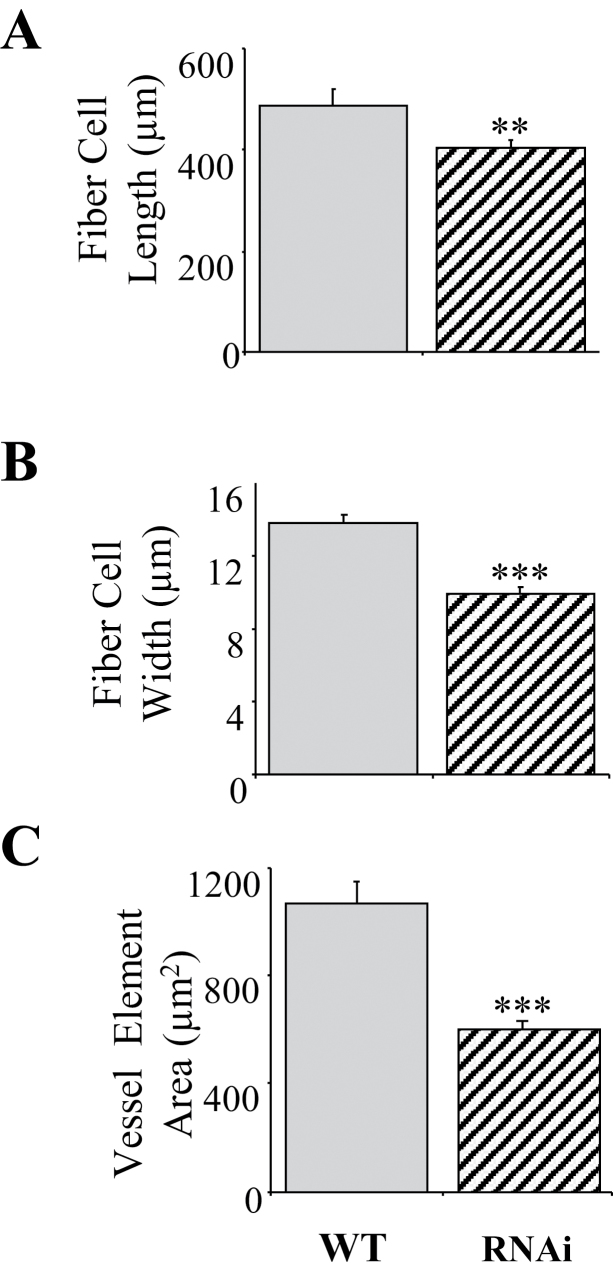
Because of the highly significant effect of RNAi suppression on stem growth (Fig. 5C and E), it was suspected that PtPHOR1 could modify the pattern of secondary growth. Inspection of cross-sections obtained from stems undergoing secondary growth in the WT and RNAi plants revealed changes in stem morphology (Fig. 8). The amount of phloem was significantly increased, whereas the xylem and pith were significantly decreased. The reduced xylem in transgenics appeared to be caused by reduced fibre and vessel size rather than fibre and vessel number (Fig. 9). Both xylem fibres and vessel elements were significantly smaller in transgenics than in WT in both their radial and longitudinal axes. Close examination of the phloem cells revealed accumulation of starch granules, similar to what was seen in the roots (Fig. 7B).
Fig. 8.
PtPHOR1 suppression led to modified stem morphology. Transverse stem sections and measurements were taken from the 15th internode of PtPHOR1-RNAi events 1 and 2, each with three ramets (right), and three wild-type plants (left). (A, C, D) Representative xylem and phloem (A), phloem (C), and xylem (D). (B) Mean ± SE radial cross-stem widths of phloem (grey), xylem (white), and pith (black); numbers in parentheses are relative percentages. Statistical significance was determined by t-test (*, P < 0.05; **, P < 0.01; ***, P < 0.001). F, fibre; P, pith; Ph, phloem; VE, vessel element; X, xylem. Bars, 500 μm (A), 200 μm (C) and 10 μm (D).
Fig. 9.
PtPHOR1 suppression caused a decrease in fibre length. Measurements were taken on cells from the 15th stem internode of PtPHOR1-RNAi events 1 and 2, each with three ramets, and three wild-type (WT) plants. Bars represent mean ± SE. Statistical significance was determined by t-test (**, P < 0.01; ***, P < 0.001).
PtPHOR1 modifications do not alter growth cessation and bud set
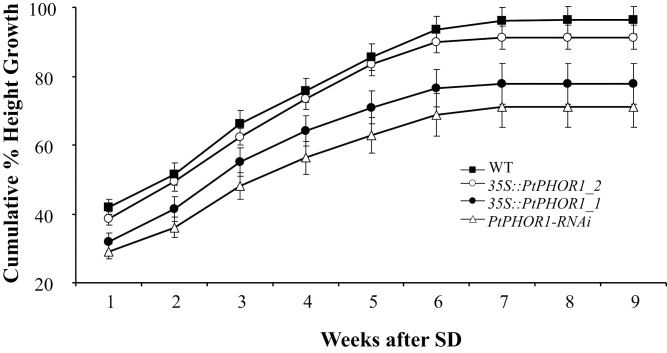
Poplars are highly photoperiod sensitive, and a reduction of day length to approximately 8h causes a cessation of shoot elongation followed by formation of a dormant bud. On a weekly basis, stem elongation was measured and bud formation was observed in WT, overexpressing, and RNAi transgenics. No significant differences were detected in weekly reductions to cumulative percentage height growth (Fig. 10), which lead to the growth cessation and coincided with bud set in both transgenic and WT plants (data not shown).
Fig. 10.
Short-day (SD) dormancy-inducing conditions led to differences in cumulative percentage height growth. Values are mean ± SE of two transgenic events with five to seven ramets/event and seven wild-type (WT) plants. During weeks 1 and 2, plants were grown under long days (16/8 light/dark) and thereafter subjected to short days (8/16 light/dark).
Discussion
PHOR1 function is conserved in poplar
This study provides functional characterization of two putative poplar orthologues of PHOR1 from potato. Expression of this gene was shown to be induced by short days and to have a strong effect on the timing and amount of tuber formation (Amador et al., 2001). As far as is known, this is the first report of PHOR1 characterization outside its initial discovery in potato. Several lines of evidence suggest that its function is strongly conserved in Populus. First, both genes show significant sequence similarity, and, similar to potato, one of the poplar genes is induced by short-day treatment. Second, as in potato, poplar PHOR1 genes appear to interact with GA signalling, as indicated by their significant upregulation in GA-insensitive and -deficient poplar transgenics. Finally, as with potato, downregulation of the genes in transgenic poplar led to decreased stem elongation while overexpression led to increased stem elongation. The conservation of PHOR1 function in non-tuberizing plant suggests that PHOR1 operates within a larger growth and developmental context than just tuber formation.
Partial functional conservation and divergence of poplar PHOR1 genes
Because of the absence of whole genome sequence, it is still unclear how many PHOR1 genes are present in potato; however, Southern blot analysis indicated that there are at least two in the potato genome (Amador et al., 2001). Similarity searches identified three PHOR1-like sequences in Arabidopsis, but to date, little information is available about these genes (Monte et al., 2003). The present study found two genes in the most recent version of the Populus genome (version 2.0). It should be noted that a previous version of the poplar genome indicated three PHOR1 genes, two of which were identical in sequence, in a close proximity on the same linkage group, but this appears to have been an assembly artifact.
Expression and sequence analyses indicated that the two poplar genes may have diverged, at least partially, in function. PtPHOR1_1 is most highly expressed in roots (Fig. 2A) and is induced by short-day treatment (Fig. 2B). In contrast, PtPHOR1_2 is distinct in sequence from PtPHOR_1, and is uniformly expressed across the organs studied and not induced by short days (Fig. 2B). Nevertheless, both genes seemed to be upregulated in the poplar GA-deficient and -insensitive transgenics, and the level of upregulation was correlated with phenotypic severity. When their expression was manipulated transgenically, both poplar PHOR1 genes also had distinct effects on shoot and root growth. Overexpression increased and downregulation inhibited biomass accumulation for both organs in PtPHOR1_2, while PtPHOR1_1 effects were restricted to roots.
PHOR1 role in starch accumulation
One of the interesting yet unexpected outcomes of this study was the increased starch accumulation in both roots and stems of the PHOR1-suppressed poplar plants. Although the effect of the antisense suppression of potato PHOR1 on starch accumulation was not studied, its downregulation led to stimulation of tuber growth (the main starch storage organ in potato) (Amador et al., 2001). The effect of PHOR1 suppression on starch accumulation is particularly interesting because it was associated with growth inhibition in both roots and shoots. It is widely known that developmental shifts to synthesis of storage compounds are associated with growth inhibition and preparation for unfavourable growth conditions (Hermans et al., 2006). Thus, PHOR1 appears to be part of a mechanism that regulates whether carbohydrate is diverted to growth or storage when plants are exposed to conditions that are unfavourable for growth.
The role of PHOR1 in relation to starch metabolism may be most readily explained with its connection to the GA signal transduction pathway (Thomas and Sun, 2004). As a major growth hormone in plants that can cause a rapid spurt of growth, GA plays important roles in the metabolism of carbohydrates that can be readily mobilized to sustain growth. Perhaps the best-known example is the effect of GA on α-amylase activity in barley aleurone cells (Gubler et al., 2002). Exogenous GA application activates the enzyme to mobilize starch in the endosperm during seed germination. More recently, study of a major GA-deactivating enzyme in rice, ELONGATED UPPERMOST INTERNODE (EUI), led to outcomes very similar to that observed in the present work (Zhang et al., 2008). The EUI gene encodes a P450 monooxygenase involved in deactivating bioactive GAs (Zhang et al., 2008). EUI overexpression led to GA deficiency, decreased stem growth, and increased starch granule accumulation. Interestingly, plants with reduced EUI expression showed the opposite phenotype: increased shoot elongation and decreased amyloplast accumulation. Thus, the findings of Zhang et al. (2008) closely mirror those of the present study that PHOR1 suppression leads to decreased shoot growth and increased starch granule development. It is unclear if this is a generalized response to modification of GA response and concentrations, as little information is available about amyloplast development in other GA-associated lesions.
PHOR1 and root development
Several lines of evidence suggest that PHOR1 genes may play a role in control of root development. First, PtPHOR1_1 was found to be more highly expressed in roots than in any other of the organs studied. Similarly, the potato PHOR1 gene was also most highly expressed in roots. Second, overexpression of PtPHOR1_1 led to biomass changes in the roots, but not in leaves and stems. Unfortunately, there is no information on the impact of trangenically altering PHOR1 expression on root growth in potato. Finally, the present study found dramatically reduced adventitious rooting in the transgenics overexpreressing both PtPHOR1_1 and PtPHOR1_2 (Fig. 3). The effect of these genes is specific to the initiation stage; once roots developed, they appeared to grow normally. In fact, they produced more root biomass than control plants. Although auxin did improve rooting, measurement of auxin concentrations suggested that its deficiency is not likely to be the cause of the adventitious rooting decline. However, it is also known that, despite the lack of gross changes in the amount of auxin, several genes encoding important regulators of auxin response were downregulated in the transgenic plants. This suggests decreased auxin sensitivity. Furthermore, previous work has shown that GA strongly affects auxin transport (Bjorklund et al., 2007; Gou et al., 2010; Mauriat et al., 2011). It is therefore possible that PHOR1, as part of GA signalling, may interfere with auxin transport and the capacity for the formation of localized auxin concentrations that are important for root initiation. Therefore, the possibility that PHOR1 expression changes auxin sensitivity and/or transport cannot be discounted.
This study also found a significant impairment of normal gravitropic response in the roots of PHOR1-overexpressing plants. It is well documented that amyloplasts (starch-filled plastids) settle to the bottom of specialized columella cells known as statocytes to direct root tip growth in response to gravity (Chen et al., 1999; Boonsirichai et al., 2002). Although the present study did not measure amyloplast development in PHOR1-overexpressing lines, PHOR1 suppression led to increased starch granule accumulation in the root tip. This suggests that PHOR1 overexpression may have led to amyloplast deficiency and, hence, the agravitropic growth observed after initial transplanting to the greenhouse. An above-mentioned study of the function of the EUI gene (Zhang et al., 2008) supports this explanation. Plants with reduced EUI expression were defective in starch-granule development and gravitropic response, whereas EUI overexpression increased starch accumulation and gravitropic response.
PHOR1 and dormancy
Freezing and dehydration stress during winter months is one of the main challenges facing plants growing in the temperate zone. The adaptive strategies for winter survival are diverse, but one of the major routes for sensing the approaching winter is the perception of shorter photoperiods. In trees, short days elicit cessation of shoot elongation, bud formation, and bud dormancy (Olsen, 2010). Therefore, the responsiveness of PHOR1 to short-day treatment, and its role in mediating growth response, suggests that it takes part in development of dormancy. However, the present analyses of transgenic Populus strongly suggest a positive effect of PHOR1 on shoot growth when overexpressed; hence, its induction by short days, which precede cessation of shoot growth, is somewhat puzzling. Furthermore, modification of PtPHOR1 expression in transgenic plants had no effect on any aspect of above-ground dormancy induction and/or release (e.g., growth cessation, bud set, or flush). Finally, the expression peak of PHOR1 occurs at around 3 weeks of short-day treatment (Fig. 2B), while the actual cessation of growth occurs approximately 3 weeks later, after nearly 6 weeks of short days (Fig. 10). Therefore, there is temporal separation of the highest expression of PHOR1 and the shoot-growth response. Thus, based on the available evidence, it is believed that the induction of PHOR1 by short-day treatment may serve other function(s) than helping to induce growth cessation and bud set. One possible explanation could be that PHOR1 induction is associated with a mechanism for triggering foliar degradation of starch into simple sugars, which are then transported via the phloem to the roots where they are incorporated into starch reserves. Similar metabolic responses have been observed in Populus in preparation for dormancy (Nguyen et al., 1990). Accumulation of starch in roots plays a major role in preparation for winter, but this aspect of dormancy in trees is poorly understood.
PHOR1 role in wood formation
One of the most significant effects of PtPHOR1 downregulation on above-ground development was the reduction in diameter (woody) growth. Inspection of stem sections showed that the effect was caused by a significant reduction of xylem formation. The reduced size of xylem appeared to be primarily due to smaller fibres and vessels. Thus, the downregulation of PtPHOR1 likely reduces the GA response needed to allow normal expansion of xylem cells. Its effect appears to modify all cell types, as suggested by the similar effect on vessels and fibres. Thus, PHOR1 action may be a major means through which GA effects on wood formation are manifested. In contrast to xylem, downregulation of PHOR1 genes resulted in increased phloem production. There is very little information on the role of GA in phloem formation; however, it has been demonstrated that low IAA/GA levels stimulate phloem production (Wareing, 1958; Digby and Wareing, 1966). An increase in phloem to xylem ratio was also seen in transgenic Populus with aberrant auxin response (Nilsson et al., 2008). Thus, an altered GA response in PtPHOR1 RNAi plants may have had a misbalancing effect on auxin, which in turn caused a disproportionate increase in phloem growth. Cellular studies of auxin metabolism in PHOR1-modified plants are likely to be needed to test this hypothesis.
Supplementary material
Supplementary data are available at JXB online.
Supplementary Fig. S1. Overexpression of PtPHOR1_1 and
PtPHOR1_2 in transgenic poplar.
Supplementary Fig. S2. Suppression of PtPHOR1_1 and PtPHOR1_2 in the leaves and roots of PtPHOR1-RNAi transgenic plants.
Supplementary Material
Acknowledgements
This work was supported in part by grants from the US Department of Energy (DOE), Poplar Genome Based Research for Carbon Sequestration in Terrestrial Ecosystems (DE-FG02-06ER64185, DE-FG02-05ER64113), the Consortium for Plant Biotechnology Research (GO12026-203A), the United States Department of Agriculture (USDA) CSREES, the USDA-NRI Plant Genome Program (2003-04345) and the Biotechnology Risk Assessment Research Grants Program (2004–35300-14687), the Plant Feedstock Genomics for Bioenergy: a joint research program of USDA and DOE (2009–65504-05767), and industrial members of the Tree Genomics and Biosafety Research Cooperative at Oregon State University.
References
- Abelenda JA, Navarro C, Prat S. 2011. From the model to the crop: genes controlling tuber formation in potato Current Opinion in Biotechnology 22 287–292 [DOI] [PubMed] [Google Scholar]
- Amador V, Monte E, Garcia-Martinez JL, Prat S. 2001. Gibberellins signal nuclear import of PHOR1, a photoperiod-responsive protein with homology to Drosophila armadillo Cell 106 343–354 [DOI] [PubMed] [Google Scholar]
- Bialek K, Cohen J. 1992. Amide-linked indoleacetic acid conjugates may control levels of indoleacetic acid in germinating seedlings of Phaseolus vulgaris Plant Physiology 100 2002–2007 [DOI] [PMC free article] [PubMed] [Google Scholar]
- Bjorklund S, Antti H, Uddestrand I, Moritz T, Sundberg B. 2007. Cross-talk between gibberellin and auxin in development of Populus wood: gibberellin stimulates polar auxin transport and has a common transcriptome with auxin The Plant Journal 52 499–511 [DOI] [PubMed] [Google Scholar]
- Bloom A, Chapin F, Mooney H. 1985. Resource limitation in plants – an economic analogy Annual Review of Ecological Systems 16 363–392 [Google Scholar]
- Boonsirichai K, Guan C, Chen R, Masson PH. 2002. Root gravitropism: an experimental tool to investigate basic cellular and molecular processes underlying mechanosensing and signal transmission in plants Annual Review of Plant Biology 53 421–447 [DOI] [PubMed] [Google Scholar]
- Busov VB, Meilan R, Pearce DW, Ma C, Rood SB, Strauss SH. 2003. Activation tagging of a dominant gibberellin catabolism gene (GA 2-oxidase) from poplar that regulates tree stature Plant Physiology 132 1283–1291 [DOI] [PMC free article] [PubMed] [Google Scholar]
- Busov V, Meilan R, Pearce DW, Rood SB, Ma C, Tschaplinski TJ, Strauss SH. 2006. Transgenic modification of gai or rgl1 causes dwarfing and alters gibberellins, root growth, and metabolite profiles in Populus Planta 224 288–299 [DOI] [PubMed] [Google Scholar]
- Campanella JJ, Bitincka L, Smalley J. 2003. MatGAT: an application that generates similarity/identity matrices using protein or DNA sequences BMC Bioinformatics 4,29 [DOI] [PMC free article] [PubMed] [Google Scholar]
- Chen R, Rosen E, Masson PH. 1999. Gravitropism in higher plants Plant Physiology 120 343–350 [DOI] [PMC free article] [PubMed] [Google Scholar]
- Digby J, Wareing PF. 1966. The effect of applied growth hormones on cambial division and the differentiation of the cambial derivatives Annals of Botany 30 539–549 [Google Scholar]
- Filichkin SA, Meilan R, Busov VB, Ma C, Brunner AM, Strauss SH. 2006. Alcohol-inducible gene expression in transgenic Populus Plant Cell Reports 25 660–667 [DOI] [PubMed] [Google Scholar]
- Forster MA, Ladd B, Bonser SP. 2011. Optimal allocation of resources in response to shading and neighbours in the heteroblastic species Acacia implexa Annals of Botany 107 219–228 [DOI] [PMC free article] [PubMed] [Google Scholar]
- Franklin GL. Preparation of thin sections of synthetic resins and wood-resin composites, and a new maceration method for wood. Nature. 1945;155:51. [Google Scholar]
- Gleave AP. 1992. A versatile binary vector system with a T-DNA organisational structure conducive to efficient integration of cloned DNA into the plant genome Plant Molecular Biology 20 1203–1207 [DOI] [PubMed] [Google Scholar]
- Gou J, Ma C, Kadmiel M, Gai Y, Strauss S, Jiang X, Busov V. 2011. Tissue-specific expression of Populus C19 GA 2-oxidases differentially regulate above- and below-ground biomass growth through control of bioactive GA concentrations New Phytologist 192 626–636 [DOI] [PubMed] [Google Scholar]
- Gou J, Strauss SH, Tsai CJ, Fang K, Chen Y, Jiang X, Busov VB. 2010. Gibberellins regulate lateral root formation in Populus through interactions with auxin and other hormones The Plant Cell 22 623–639 [DOI] [PMC free article] [PubMed] [Google Scholar]
- Gubler F, Chandler PM, White RG, Llewellyn DJ, Jacobsen JV. 2002. Gibberellin signaling in barley aleurone cells. Control of SLN1 and GAMYB expression Plant Physiology 129 191–200 [DOI] [PMC free article] [PubMed] [Google Scholar]
- Hermans C, Hammond JP, White PJ, Verbruggen N. 2006. How do plants respond to nutrient shortage by biomass allocation? Trends in Plant Science 11 610–617 [DOI] [PubMed] [Google Scholar]
- Holsters M, de WD, Depicker A, Messens E, van MM, Schell J. 1978. Transfection and transformation of Agrobacterium tumefaciens Molecular and General Genetics 163 181–187 [DOI] [PubMed] [Google Scholar]
- Lang GA. 1987. Dormancy: a new universal terminology HortScience 22 817–820 [Google Scholar]
- Mauriat M, Sandberg LG, Moritz T. 2011. Proper gibberellin localization in vascular tissue is required to control auxin-dependent leaf development and bud outgrowth in hybrid aspen The Plant Journal 67 805–816 [DOI] [PubMed] [Google Scholar]
- Monte E, Amador V, Russo E, Martinez-Garcia J, Prat S. 2003. PHOR1, a U-Box GA signaling component with a role in proteasome degradation? Journal of Plant Growth Regulation 22 152–162 [Google Scholar]
- Nguyen PV, Dickmann DI, Pregitzer KS, Hendrick R. 1990. Late-season changes in allocation of starch and sugar to shoots, coarse roots, and fine roots in two hybrid poplar clones Tree Physiology 7 95–105 [DOI] [PubMed] [Google Scholar]
- Nilsson J, Karlberg A, Antti H, Lopez-Vernaza M, Mellerowicz E, Perrot-Rechenmann C, Sandberg G, Bhalerao RP. 2008. Dissecting the molecular basis of the regulation of wood formation by auxin in hybrid aspen The Plant Cell 20 843–855 [DOI] [PMC free article] [PubMed] [Google Scholar]
- Olsen JE. 2010. Light and temperature sensing and signaling in induction of bud dormancy in woody plants Plant Molecular Biology 73 37–47 [DOI] [PubMed] [Google Scholar]
- Pringa E, Martinez-Noel G, Muller U, Harbers K. 2001. Interaction of the RING finger-related U-box motif of a nuclear dot protein with ubiquitin-conjugating enzymes Journal of Biological Chemistry 276 19617–19623 [DOI] [PubMed] [Google Scholar]
- Regier N, Streb S, Zeeman SC, Frey B. 2010. Seasonal changes in starch and sugar content of poplar (Populus deltoides × nigra cv. Dorskamp) and the impact of stem girdling on carbohydrate allocation to roots Tree Physiology 30 979–987 [DOI] [PubMed] [Google Scholar]
- Ruberti I, Sessa G, Ciolfi A, Possenti M, Carabelli M, Morelli G. 2011. Plant adaptation to dynamically changing environment: the shade avoidance response Biotechnology Advances (epublication ahead of print) [DOI] [PubMed] [Google Scholar]
- Thomas SG, Sun TP. 2004. Update on gibberellin signaling. A tale of the tall and the short Plant Physiology 135 668–676 [DOI] [PMC free article] [PubMed] [Google Scholar]
- Thornley J. 1972. A balanced quantitative model for root-shoot ratios in vegetative plants Annals of Botany 36 431–441 [Google Scholar]
- Wareing PF. 1958. Interaction between indole-acetic acid and gibberellic acid in cambial activity Nature 181 1744–1745 [DOI] [PubMed] [Google Scholar]
- Wargo PM. 1975. Estimating starch content in roots of deciduous trees – a visual technique Upper Darby, PA: Northeastern Forest Experiment Station Forest Service. USDA Forest Service Research Paper NE-313, pp 1–6
- Zawaski C, Kadmiel M, Ma C, Gai Y, Jiang X, Strauss SH, Busov VB. 2011. SHORT INTERNODES-like genes regulate shoot growth and xylem proliferation in Populus New Phytologist 191 678–691 [DOI] [PubMed] [Google Scholar]
- Zhang Y, Zhu Y, Peng Y, Yan D, Li Q, Wang J, Wang L, He Z. 2008. Gibberellin homeostasis and plant height control by EUI and a role for gibberellin in root gravity responses in rice Cell Research 18 412–421 [DOI] [PubMed] [Google Scholar]
Associated Data
This section collects any data citations, data availability statements, or supplementary materials included in this article.


