

Abstract
Loss of a sensory modality elicits both unimodal changes in the deprived cortex and cross-modal alterations in the remaining sensory systems. Unimodal changes are proposed to recruit the deprived cortex for processing the remaining senses, while cross-modal changes are thought to refine processing of spared senses. Hence coordinated unimodal and cross-modal changes are likely beneficial. Despite this expectation, we report in mice that losing behaviorally relevant patterned vision is sufficient to trigger cross-modal synaptic changes in the primary somatosensory cortex barrel fields, but is insufficient to drive unimodal synaptic plasticity in visual cortex (V1), which requires a complete loss of visual activity. In addition, cross-modal changes depend on whisker inputs. Our results demonstrate that unimodal and cross-modal synaptic plasticity occur independently of each other and rely on distinct sensory requirements.
Introduction
Loss of vision triggers diverse compensatory changes, including alterations in the activity of sensory cortical areas and sensory perception (Bavelier and Neville, 2002). For instance, visual cortex of blind subjects is recruited during tactile tasks, such as Braille reading, and for sound processing (Sadato et al., 1996; Cohen et al., 1997; Merabet et al., 2009). In addition, there is evidence of enhanced tactile and auditory perception in blind subjects (Lessard et al., 1998; Röder et al., 1999; Grant et al., 2000; Van Boven et al., 2000; Goldreich and Kanics, 2003; Gougoux et al., 2004). Cross-modal recruitment of visual cortex and facilitation of Braille reading can be quite rapid, requiring only a few days of blindfolding (Merabet et al., 2008). In addition to these systems level changes, cross-modal plasticity is also observed at synaptic levels in primary sensory cortices following visual deprivation (Goel et al., 2006; Jitsuki et al., 2011), which we proposed may be cellular substrates underlying sensory adaptation in blind individuals (Goel et al., 2006; Lee, 2012). Depriving rodents of vision by dark exposure (DE) enhances AMPA receptor (AMPAR)-mediated excitatory synaptic transmission in layer 2/3 (L2/3) of primary visual cortex (V1), but reduces it in primary somatosensory (S1) and auditory (A1) cortices (Goel et al., 2006). Both the unimodal changes in V1 and the cross-modal changes in other primary sensory cortices were global and followed the rules of a homeostatic synaptic plasticity mechanism termed “synaptic scaling” (Turrigiano et al., 1998). The opposite changes produced in V1 versus other cortical areas suggest that they may have distinct functional roles. It is plausible that the global scaling up of V1 synapses by visual deprivation might allow recruitment of V1 for processing previously subthreshold inputs carrying tactile or auditory information, while scaling down of S1 and A1 synapses may act to sharpen the receptive field properties for enhanced perception. In support of the latter, visual deprivation was shown to sharpen the tuning of primary somatosensory cortex barrel field (S1BF) L2/3 neurons to the principal whisker (Jitsuki et al., 2011). In any case, optimal sensory compensation would require recruitment of both unimodal and cross-modal changes. We report here that these two forms of synaptic plasticity require different degrees of visual deprivation and can occur independently of each other, which predicts that the degree of blindness will produce different sensory compensation.
Materials and Methods
Animals
Wild-type mice (C57BL/6) of either sex were reared in a normal light cycle (12 h light/dark) until they were 3 weeks old, before visual deprivation. All procedures conformed to the guidelines of the National Institutes of Health and were approved by the Institutional Animal Care and Use Committees of University of Maryland and Johns Hopkins University.
Sensory deprivation
Dark exposure.
Dark exposure was performed as described previously (Goel et al., 2006; Goel and Lee, 2007). Briefly, mice were kept in a dark room for either 2 or 7 d. During this period, mice were cared for using infrared vision goggles under dim infrared light.
Bilateral lid suture.
Mice were anesthetized by intraperitoneal injection of ketamine/xylazine (50 and 10 mg/kg, respectively). Lidocaine was applied to the eye area after cleaning. Both eyelid margins were trimmed and sutured together. Triple antibiotic ointment was applied afterward to prevent infection. After recovery from anesthesia, bilateral lid suture (LS) mice were housed with their sighted littermates and placed in a normal light cycle for either 2 d or a week. Mice were monitored daily to ensure the lids remained sutured.
Binocular enucleation.
Mice were anesthetized by isoflurane vapor. Both eyes were removed and triple antibiotic ointment was applied. Binocular enucleation mice returned to their home cage with sighted littermates, and were kept in a normal light cycle. Mice were monitored daily to make sure there was no bleeding or infection.
Whisker deprivation.
Mice were anesthetized by isoflurane vapor. All whiskers from both sides were plucked with blunt-end tweezers. Whisker deprivation (WD) mice returned to their home cage with control mice with intact whiskers and were kept in a normal light cycle. Mice were monitored daily and new whiskers were plucked every 2–3 d following the same procedure.
Preparation of brain slices and whole-cell recording
Preparations were done as previously described (Goel and Lee, 2007; Gao et al., 2010; Goel et al., 2011). In brief, mice were killed by decapitation following overdose of isoflurane. Acute visual and somatosensory cortical slices (300 μm thick) were cut using a vibratome (Vibratome 3000 series, Ted Pella) in ice-cold dissection buffer (containing, in mm: 212.7 sucrose, 2.6 KCl, 1.23 NaH2PO4, 26 NaHCO3, 10 dextrose, 3 MgCl2, and 1 CaCl2) saturated with 5% CO2/95% O2. The slices recovered in ACSF (containing, in mm: 124 NaCl, 5 KCl, 1.25 NaH2PO4, 26 NaHCO3, 10 dextrose, 1.5 MgCl2, and 2.5 CaCl2, saturated with a mixture of 5% CO2/95% O2) at room temperature for at least 1 h before recording. Slices were transferred to a recording chamber perfused with ACSF with 1 μm TTX, 20 μm bicuculline, and 100 μm dl-2-amino-5-phosphonovalerate (APV) to isolate AMPAR-mediated miniature EPSCs (mEPSCs). Recording pipettes (3–5 MΩ) were filled with internal solution (containing, in mm: 130 Cs-gluconate, 8 KCl, 1 EGTA, 10 HEPES, 4 ATP, and 1 QX-314, pH 7.25, 285–295 mOsm). Pyramidal neurons from L2/3 were visualized using an upright microscope (Nikon E600FN) equipped with infrared oblique illumination. S1BF was identified by the landmark of barrels in L4. Whole-cell recordings were done with membrane potential held at −80 mV. mEPSCs were recorded by an Axopatch amplifier 700B (Molecular Devices), digitized at 10 kHz through a data acquisition board (National Instruments), and stored using Igor Pro software (WaveMetrics). Data were analyzed using MiniAnalysis software (Synaptosoft) with a detection threshold set to three times the root mean square noise. mEPSCs with rise time >3 ms, and cells showing a negative correlation between rise time and amplitude, were excluded because they might reflect dendritic filtering. Average mEPSC amplitude and frequency were calculated from 200 consecutive mEPSCs, and compared across groups using one-way ANOVA. p < 0.05 was taken as significant.
Peak-scaled nonstationary fluctuation analysis of AMPAR channel properties
The AMPAR channel properties, including the single-channel conductance (γ), number of open channels at peak (N), and the channel open probability (Popen), were assessed by peak-scaled nonstationary fluctuation analysis (pNSFA) using the MiniAnalysis software (Synaptosoft) (Hartveit and Veruki, 2007). From each cell, 100–150 well isolated mEPSCs were selected and peak-scaled to match their average. These scaled mEPSCs were aligned with their average and the variance of the decay phase was plotted against the amplitude, which was fitted with the equation: σ2 = iI − I2/N + b, where σ2 is variance, I is mean current, i is single-channel current, N is the number of open channels at peak current, and b is background variance.
From the above equation, γ was calculated as follows: γ = i/V, where V is the driving force, which was 80 mV under our recording conditions (holding potential = −80 mV and reversal potential for AMPAR = 0 mV). Only cells with curve fit R2 > 0.5 were used for analysis.
Whisking frequency measurement
After a 1 h room habituation period, mice were placed individually in a clear, bedding-less cage identical to the home cage dimensions (40 × 20 × 20 cm3). The cage was lit with diffuse white light illumination from below to optimize whisker visualization. A novel object was placed in the center of the cage, and the animal was allowed to explore the environment and the object for 5 min. Eight opportunistic video segments 4 s in length were recorded at 150 frames per second using a Hamamatsu C9300-221 camera at full resolution (640 × 480). The camera was suspended 0.5 m above the cage using a tripod. Videos were collected with HCImage software (Hamamatsu) and analyzed frame by frame with VLC media player. Whisking frequency was analyzed manually by an experimentally naive student. A whisk was counted as a full front to back sweep of the majority of C row whiskers. Free whisking was defined as spontaneous whisking while the whiskers were not touching any object or walls of the cage. Object whisking was defined as having at least 2 whiskers touching the object during the whisking sweeps. Each day of whisking observation the mice were presented with a novel object. The objects were all clear glassware (50 ml flask, 250 ml flask, and 50 ml beaker), and randomly presented to mice on different days. Objects were cleaned between each mouse. Whisking frequencies over the eight video segments were averaged for each mouse for each day. Average whisking frequencies were compared across groups with two-way ANOVA and p < 0.05 was considered significant.
Results
In human studies the degree of blindness is reported to affect cross-modal plasticity (Lessard et al., 1998; D'Angiulli and Waraich, 2002). Therefore, we examined whether different degrees of visual deprivation could independently recruit unimodal and cross-modal synaptic plasticity. To do this, we compared the effects of different modes of visual deprivation (VD)—including DE, binocular enucleation (EN), and bilateral LS—on synaptic function in both V1 and S1BFs. The different modes of VD were chosen on the basis that DE specifically removes visually driven activity without impacting spontaneous retinal activity, EN removes both, and LS removes only patterned vision but leaves diffuse light response through the eyelids and spontaneous retinal activity intact. VD was initiated in 3-week-old mice, and AMPAR-mediated mEPSCs were recorded from L2/3 pyramidal neurons in V1 and S1BF.
Consistent with our previous findings (Goel et al., 2006), 7 d of DE (7d-DE) respectively increased and decreased mEPSC amplitudes in V1 and S1BF without altering the frequency (Fig. 1A,B). The amplitude changes followed a multiplicative scaling rule (Fig. 1C,D), which preserves the individual differences in synaptic strength despite global scaling (Turrigiano et al., 1998). A shorter duration of DE (2d-DE) only increased mEPSC amplitudes in V1 without altering S1BF (Fig. 1A,B), suggesting a longer window of activity integration is needed for cross-modal changes. Changes in mEPSC amplitude support postsynaptic modifications of AMPARs. To further examine this, we analyzed well isolated mEPSCs from each group using a pNSFA (Traynelis et al., 1993), which deduces the single-channel properties from the variance of the decay phase of mEPSCs (Fig. 1E). Dark exposure for 7 d (7d-DE) upregulated the single-channel conductance (γ) in V1, but decreased the number of open channels at peak (N) in S1BF, without altering the channel open probability (Popen) (Fig. 1F). The changes in V1 support a scenario that DE recruits Ca2+-permeable AMPARs (CP-AMPARs) (Goel et al., 2006, 2011), which have higher conductance (Swanson et al., 1997), to replace existing synaptic AMPARs. In S1BF, the decrease in N suggests that DE reduces the total number of synaptic AMPARs. We found clear differences in basal mEPSC amplitude and larger γ in S1BF than in V1 (Fig. 1), which may reflect more CP-AMPARs at synapses under basal conditions (Goel et al., 2006). These results support the idea that distinct primary cortical areas have different set points in excitatory synaptic transmission under normal conditions.
Figure 1.
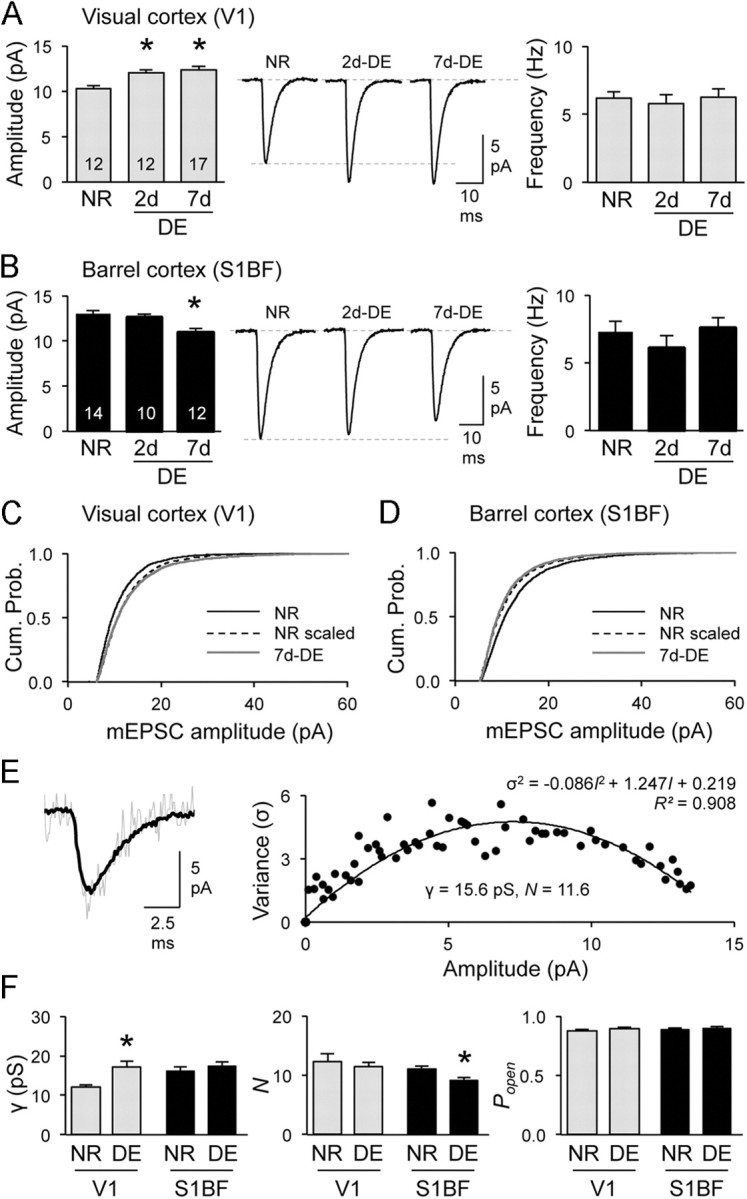
Cross-modal regulation of AMPAR-medicated synaptic transmission in S1BF requires a longer duration of visual deprivation than unimodal changes in V1. A, B, In V1 (A), 2d- and 7d-DE increased the average mEPSC amplitude (left) without changing mEPSC frequency (right). B, In S1BF, only 7d-DE reduced the average mEPSC amplitude (left). Middle, Average mEPSC traces. Data in Table 1. Note that mEPSCs in S1BF are significantly larger in amplitude compared with V1. C, D, The changes in mEPSC amplitude with 7d-DE is multiplicative in both V1 and S1BF. In V1 (C), 7d-DE (gray line) produced a significant rightward shift in the cumulative probability of mEPSC amplitudes compared with NR (black solid line). Multiplying mEPSC amplitudes of NR (NR scaled, black dotted line) with a scaling factor 1.19, produced an overlapping cumulative probability graph to 7d-DE (Kolmogrov–Smirnov test, p = 0.31). In S1BF (D), multiplying mEPSC amplitudes of NR (black solid line) with a scaling factor of 0.84 (NR scaled, black dotted line) produced a cumulative probability curve that overlaps with 7d-DE (gray line) (Kolmogrov–Smirnov test, p = 0.052). E, An example of pNSFA (NR-S1BF neuron). Top, An average mEPSC trace (black) overlapped with a peak-scaled individual mEPSC (gray). From this, the variance of the decay phase is calculated and plotted (bottom) to fit with the equation shown to derive γ, N, and Popen. F, In V1, 7d-DE increased γ without changing N or Popen. In S1BF, 7d-DE only decreased N. *p < 0.05. Note S1BF shows a significantly larger basal γ compared with V1.
Table 1.
Comparison of mEPSC and neuronal parameters across the experimental groups in V1 and S1BF
| Area | VD | Groups | mEPSC amplitude (pA) | mEPSC frequency (Hz) | mEPSC rise time (ms) | mEPSC decay τ (ms) | RMS noise | Rs (MΩ) | Ri (MΩ) |
|---|---|---|---|---|---|---|---|---|---|
| V1 | NR | 10.3 ± 0.3 | 6.2 ± 0.5 | 1.6 ± 0.04* | 2.8 ± 0.1 | 1.7 ± 0.05 | 19.3 ± 0.8 | 465 ± 60 | |
| DE | 2d-DE | 12.0 ± 0.3* | 5.8 ± 0.7 | 1.4 ± 0.02* | 2.5 ± 0.1* | 1.8 ± 0.02 | 17.5 ± 0.8 | 349 ± 77 | |
| 7d-DE | 12.3 ± 0.4* | 6.3 ± 0.6 | 1.5 ± 03.0* | 2.7 ± 0.1 | 1.7 ± 0.03 | 18.7 ± 0.8 | 343 ± 50 | ||
| NR | 9.6 ± 0.3 | 6.1 ± 1.0 | 1.6 ± 0.05 | 3.1 ± 0.2 | 1.7 ± 0.05 | 17.4 ± 1.2 | 320 ± 34 | ||
| EN | 2d-EN | 11.7 ± 0.5* | 4.8 ± 0.5 | 1.6 ± 0.05 | 3.2 ± 0.2 | 1.7 ± 0.05 | 17.8 ± 1.3 | 335 ± 58 | |
| 7d-EN | 12.1 ± 0.4* | 5.2 ± 0.7 | 1.5 ± 0.05 | 2.9 ± 0.2 | 1.7 ± 0.04 | 16.8 ± 0.9 | 315 ± 36 | ||
| NR | 9.9 ± 0.3 | 5.9 ± 0.8 | 1.6 ± 0.04 | 3.1 ± 0.2 | 1.7 ± 0.05 | 19.0 ± 1.4 | 393 ± 43 | ||
| LS | 2d-LS | 10.1 ± 0.6 | 4.8 ± 0.5 | 1.2 ± 0.03 | 2.9 ± 0.1 | 1.6 ± 0.05 | 19.6 ± 1.7 | 317 ± 35 | |
| 7d-LS | 10.3 ± 0.3 | 6.0 ± 0.4 | 1.6 ± 0.04 | 3.2 ± 0.1 | 1.6 ± 0.04 | 17.9 ± 1.0 | 327 ± 24 | ||
| WD | 11.8 ± 0.5* | 5.5 ± 0.8 | 1.7 ± 0.05 | 3.2 ± 0.2 | 1.7 ± 0.05 | 17.8 ± 1.0 | 313 ± 23 | ||
| WD + LS | 11.7 ± 0.5* | 5.4 ± 0.4 | 1.5 ± 0.03 | 2.9 ± 0.1 | 1.7 ± 0.04 | 17.9 ± 0.9 | 292 ± 15 | ||
| S1BF | NR | 13 ± 0.4 | 7.3 ± 0.8 | 1.6 ± 0.04 | 3.1 ± 0.1 | 1.8 ± 0.04 | 15.6 ± 1.0 | 262 ± 18 | |
| DE | 2d-DE | 12.6 ± 0.4 | 6.1 ± 1 | 1.5 ± 0.04 | 2.8 ± 0.2 | 1.8 ± 0.05 | 14.8 ± 1.5 | 335 ± 59 | |
| 7d-DE | 10.9 ± 0.4* | 7.6 ± 0.8 | 1.6 ± 0.04 | 3.1 ± 0.2 | 1.8 ± 0.04 | 17 ± 1.2 | 224 ± 14 | ||
| NR | 12.6 ± 0.6 | 7.2 ± 1.2 | 1.6 ± 0.05 | 3.1 ± 0.2 | 1.8 ± 0.05 | 15.2 ± 1.2 | 373 ± 111 | ||
| EN | 2d-EN | 12.5 ± 0.6 | 7.6 ± 1.1 | 1.6 ± 0.04 | 3.2 ± 0.2 | 1.8 ± 0.06 | 16.5 ± 1.5 | 252 ± 31 | |
| 7d-EN | 10.5 ± 0.5* | 7.0 ± 0.7 | 1.7 ± 0.04 | 3.6 ± 0.2 | 1.7 ± 0.05 | 18.0 ± 1.3 | 223 ± 17 | ||
| NR | 12.7 ± 0.4 | 6.8 ± 0.6 | 1.7 ± 0.03* | 3.4 ± 0.2 | 1.8 ± 0.05 | 16.2 ± 1.3 | 267 ± 74 | ||
| LS | 2d-LS | 12.5 ± 0.6 | 7.6 ± 1.1 | 1.6 ± 0.04* | 3.2 ± 0.2 | 1.8 ± 0.06 | 16.5 ± 1.5 | 252 ± 31 | |
| 7d-LS | 10.5 ± 0.5* | 7.0 ± 0.7 | 1.7 ± 0.04 | 3.6 ± 0.2 | 1.7 ± 0.05 | 18.0 ± 1.3 | 223 ± 17 | ||
| WD | 11.8 ± 0.4 | 6.2 ± 0.8 | 1.7 ± 0.04 | 3.3 ± 0.1 | 1.8 ± 0.04 | 17.3 ± 1.1 | 259 ± 24 | ||
| WD + LS | 12.6 ± 0.3 | 7.3 ± 0.6 | 1.6 ± 0.02* | 3.0 ± 0.1 | 1.8 ± 0.03 | 14.2 ± 0.8 | 194 ± 14 |
*p < 0.05 with LSD post hoc test following one-way ANOVA (p < 0.05). RMS, Root mean square; Rs, series resistance, Ri, input resistance.
Binocular EN mirrored the changes seen with DE in both V1 and S1BF (Fig. 2A–D). In contrast, LS did not alter the mean amplitude of mEPSCs in V1 (Fig. 3A), suggesting that the residual vision through the eyelids is sufficient to prevent V1 scaling. Seven days of bilateral lid suture (7d-LS) still decreased the amplitude of mEPSCs in S1BF (Fig. 3B) indicating that cross-modal plasticity is independent of changes in V1. Furthermore, these results suggest that losing patterned vision, which is critical for providing meaningful information for guiding behavior, is sufficient to trigger cross-modal plasticity in S1BF. In contrast, unimodal changes in V1 require a complete loss of vision. The cross-modal decrease in mEPSC amplitudes with EN and LS followed the rules of multiplicative synaptic scaling like DE (Figs. 2C, 3C), but only EN mimicked the changes in AMPAR channel function (Fig. 2D).
Figure 2.

Eliminating spontaneous retinal activity does not add to losing vision. A, In V1, 2d- and 7d-EN increased the average mEPSC amplitude (left) without changing the frequency (right). B, In S1BF, only 7d-EN reduced the average mEPSC amplitude (left). Middle, Average mEPSC traces. *p < 0.05. Data in Table 1. C, 7d-EN multiplicatively scaled down mEPSCs in S1BF (scaling factor = 0.86; Kolmogrov–Smirnov test, p = 0.71). D, Comparison in AMPAR single-channel properties as analyzed by pNSFA analysis of mEPSCs between NR (N) and 7d-EN (E). In V1, 7d-EN significantly increased the single-channel conductance (γ) of AMPARs without changes in N or Popen (data not shown). In S1BF, 7d-EN reduced the N without significantly altering γ or Popen (data not shown). *p < 0.05.
Figure 3.

A loss of patterned vision drives cross-modal plasticity of S1BF synapses dependent on whisker inputs. A, B, LS did not alter the average mEPSC amplitude in V1 (A), but 7d-LS decreased it in S1BF, which was prevented by WD (B). WD alone increased the average mEPSC amplitude in V1, but did not alter it in S1BF. Data in Table 1. C, 7d-LS multiplicatively scaled down mEPSCs in S1BF (scaling factor = 0.83; Kolmogrov–Smirnov test, p = 0.18). D, Visual deprivation does not change the frequency of whisking. Top, The frequency of whisks measured during free whisking did not differ between NR and LS mice at 2, 5, and 7 d post-lid suture surgery (NR-2d = 10.8 ± 0.6 Hz, n = 10; NR-5d = 9.9 ± 1.0 Hz, n = 12; NR-7d = 10.5 ± 0.5 Hz, n = 11; LS-2d = 10.3 ± 0.7 Hz, n = 11; LS-5d = 10.3 ± 0.8 Hz, n = 13; LS-7d = 9.8 ± 0.4 Hz, n = 11; ANOVA, p = 0.72). Bottom, The frequency of active whisks during novel object exploration was not different between NR and LS groups (NR-2d = 19.0 ± 1.1 Hz, n = 10; NR-5d = 20.9 ± 2.4 Hz, n = 11; NR-7d = 20.5 ± 1.5 Hz, n = 11; LS-2d = 17.5 ± 1.1 Hz, n = 10; LS-5d = 17.5 ± 0.9 Hz, n = 13; LS-7d = 18.2 ± 0.9 Hz, n = 10; ANOVA, p = 0.80). *p < 0.05.
Our results thus far suggest that unimodal changes in V1 are not required to drive cross-modal synaptic changes in S1BF. Therefore, we determined whether cross-modal changes depend on bottom-up sensory information from the whiskers by plucking all whiskers bilaterally during the 7d-LS. WD alone for 7 d did not alter mEPSCs in S1BF, but prevented the amplitude decrease seen with 7d-LS (Fig. 3B). Interestingly, 7d-WD cross-modally increased mEPSC amplitudes in V1 (Fig. 3A) in a non-multiplicative manner (Kolmogorov–Smirnov test between cumulative probability of mEPSC amplitudes of normal reared (NR) scaled by a factor of 1.2 to those of WD: p < 0.001). The direction of cross-modal change in mEPSCs with WD was in the opposite direction to that elicited in S1BF with VD (Figs. 1, 2), which reflects possible opposite subthreshold cross-modal interaction between these two cortical areas (Iurilli et al., 2012). In any case, the data from S1BF indicate that whisker inputs are necessary for VD-induced cross-modal synaptic plasticity. However, this was not likely due to an increase in whisking activity, because there was no difference in the whisking frequency (both passive and active whisking) between LS and NR (Fig. 3D). However, we cannot rule out whether other parameters of whisking, including amplitude, velocity, or duration (Carvell and Simons, 1990), might be altered. There was no significant change in the general locomotion activity of LS mice measured in their home cages (Fig. 3D), which suggests that there is no gross alteration in normal activity.
Discussion
Collectively, our data suggest that cross-modal synaptic plasticity is orchestrated by the loss of behaviorally relevant vision, and requires inputs from the intact senses independent of changes in V1. One surprising aspect of our results is that cross-modal synaptic plasticity, while requiring a longer duration, was triggered by a milder form of vision loss (i.e., LS) compared with unimodal plasticity, which required a complete loss of visual inputs. This predicts that cellular substrates underlying sensory compensation would differ depending on the degree of vision loss. Losing behaviorally relevant patterned vision would only induce cross-modal synaptic plasticity, while a total loss of vision would engage both cross-modal and unimodal cortical changes. The requirement of bottom-up whisker inputs for cross-modal synaptic changes is in line with the “tactile” hypothesis, which proposes that bottom-up (i.e., sensory experience arising from the periphery) tactile experience enhances tactile acuity in blind (Grant et al., 2000; Wong et al., 2011). It is also consistent with enhanced whisker-induced synaptic plasticity in VD mice (Jitsuki et al., 2011). However, we did not observe a gross increase in whisking activity with VD. This suggests that the decrease in mEPSC amplitude in S1BF by VD is not likely simply due to down scaling driven by increased whisking. A parsimonious explanation would be that bottom-up sensory inputs act in conjunction with intracortical or top-down (i.e., feedback and modulatory inputs from higher order brain areas) influences to drive cross-modal synaptic changes. Whether this is the case would require further studies, but it is of interest to note that L2/3 neurons are in an ideal position for combining these two inputs due to their heavy intracortical and feedback innervation from higher order cortical areas (Felleman and Van Essen, 1991; Coogan and Burkhalter, 1993; Binzegger et al., 2004). Furthermore, a recent study demonstrated that VD increases serotonergic tone in S1BF (Jitsuki et al., 2011), which enhanced whisker activity-driven AMPAR synaptic trafficking. Hence, changes in global neuromodulatory tone may also play a critical role in cross-modal synaptic plasticity. At first glance, Jitsuki et al. results seemingly contradict our findings, in that they reported strengthening of L4 to L2/3 synapses in S1BF with 2d-LS (Jitsuki et al., 2011). However, our measurement of mEPSCs is across many synapses on L2/3 pyramidal neurons, and considering the sparse representation of L4 inputs to L2/3 (Feldmeyer et al., 2002; Binzegger et al., 2004) we would be biased toward intracortical inputs. It is possible that VD globally decreases intracortical inputs and selectively increases thalamocortical inputs to S1BF, which would act to enhance the signal-to-noise ratio for better tactile processing. Further studies are warranted to examine the differences in cross-modal regulation of intracortical versus thalamocortical inputs.
One interesting aspect revealed from our study is that there is clearly a difference in basal excitatory synaptic transmission and directionality of cross-modal synaptic plasticity in V1 and S1BF. We previously also noted a larger basal mEPSC amplitude in S1BF, which correlated with a higher content of AMPAR GluA1 (or GluR1) subunit at synapses (Goel et al., 2006). The larger γ of AMPARs reported here is consistent with this, because GluA1 subunit containing AMPARs have larger conductance than GluA1 lacking receptors (Hollmann et al., 1991; Oh and Derkach, 2005). A recent study highlighted that normal subthreshold cross-modal interaction between different senses is rather complex in that visual experience elicits depolarizing responses in L2/3 of S1BF, while whisker activation produces hyperpolarization in L2/3 of V1 (Iurilli et al., 2012). Hence the opposite cross-modal changes observed in S1BF following VD and in V1 after WD is perhaps a reflection of these complex basal interactions. In any case, our results indicate that cross-modal homeostatic synaptic changes are widely recruited, albeit different in polarity, across primary sensory cortices after losing a sensory modality.
Cross-modal synaptic changes in S1BF were observed with VD after normal early development, suggesting that they can occur in relatively mature brain circuits. This is reminiscent of the enhancement of tactile acuity in blind individuals independent of childhood vision or the degree of blindness (Goldreich and Kanics, 2003), and likely reflect functional changes of existing connections. While coordinated recruitment of both unimodal and cross-modal changes are likely to produce maximal benefits to compensate for loss of vision, our results demonstrate that these two plasticity mechanisms depend on distinct sensory requirements and can occur independently. Our results suggest that different degrees of vision loss will result in sensory compensation via distinct cortical substrates.
Footnotes
This work was supported by NIH grants (R01-EY014882 and R21-NS070645) to H.-K.L. We thank Dr. A. Kirkwood for helpful discussions.
References
- Bavelier D, Neville HJ. Cross-modal plasticity: where and how? Nat Rev Neurosci. 2002;3:443–452. doi: 10.1038/nrn848. [DOI] [PubMed] [Google Scholar]
- Binzegger T, Douglas RJ, Martin KA. A quantitative map of the circuit of cat primary visual cortex. J Neurosci. 2004;24:8441–8453. doi: 10.1523/JNEUROSCI.1400-04.2004. [DOI] [PMC free article] [PubMed] [Google Scholar]
- Carvell GE, Simons DJ. Biometric analyses of vibrissal tactile discrimination in the rat. J Neurosci. 1990;10:2638–2648. doi: 10.1523/JNEUROSCI.10-08-02638.1990. [DOI] [PMC free article] [PubMed] [Google Scholar]
- Cohen LG, Celnik P, Pascual-Leone A, Corwell B, Falz L, Dambrosia J, Honda M, Sadato N, Gerloff C, Catalá MD, Hallett M. Functional relevance of cross-modal plasticity in blind humans. Nature. 1997;389:180–183. doi: 10.1038/38278. [DOI] [PubMed] [Google Scholar]
- Coogan TA, Burkhalter A. Hierarchical organization of areas in rat visual cortex. J Neurosci. 1993;13:3749–3772. doi: 10.1523/JNEUROSCI.13-09-03749.1993. [DOI] [PMC free article] [PubMed] [Google Scholar]
- D'Angiulli A, Waraich P. Enhanced tactile encoding and memory recognition in congenital blindness. Int J Rehabil Res. 2002;25:143–145. doi: 10.1097/00004356-200206000-00008. [DOI] [PubMed] [Google Scholar]
- Feldmeyer D, Lübke J, Silver RA, Sakmann B. Synaptic connections between layer 4 spiny neurone-layer 2/3 pyramidal cell pairs in juvenile rat barrel cortex: physiology and anatomy of interlaminar signalling within a cortical column. J Physiol. 2002;538:803–822. doi: 10.1113/jphysiol.2001.012959. [DOI] [PMC free article] [PubMed] [Google Scholar]
- Felleman DJ, Van Essen DC. Distributed hierarchical processing in the primate cerebral cortex. Cereb Cortex. 1991;1:1–47. doi: 10.1093/cercor/1.1.1-a. [DOI] [PubMed] [Google Scholar]
- Gao M, Sossa K, Song L, Errington L, Cummings L, Hwang H, Kuhl D, Worley P, Lee HK. A specific requirement of Arc/Arg3.1 for visual experience-induced homeostatic synaptic plasticity in mouse primary visual cortex. J Neurosci. 2010;30:7168–7178. doi: 10.1523/JNEUROSCI.1067-10.2010. [DOI] [PMC free article] [PubMed] [Google Scholar]
- Goel A, Lee HK. Persistence of experience-induced homeostatic synaptic plasticity through adulthood in superficial layers of mouse visual cortex. J Neurosci. 2007;27:6692–6700. doi: 10.1523/JNEUROSCI.5038-06.2007. [DOI] [PMC free article] [PubMed] [Google Scholar]
- Goel A, Jiang B, Xu LW, Song L, Kirkwood A, Lee HK. Cross-modal regulation of synaptic AMPA receptors in primary sensory cortices by visual experience. Nat Neurosci. 2006;9:1001–1003. doi: 10.1038/nn1725. [DOI] [PMC free article] [PubMed] [Google Scholar]
- Goel A, Xu LW, Snyder KP, Song L, Goenaga-Vazquez Y, Megill A, Takamiya K, Huganir RL, Lee HK. Phosphorylation of AMPA receptors is required for sensory deprivation-induced homeostatic synaptic plasticity. PLoS One. 2011;6:e18264. doi: 10.1371/journal.pone.0018264. [DOI] [PMC free article] [PubMed] [Google Scholar]
- Goldreich D, Kanics IM. Tactile acuity is enhanced in blindness. J Neurosci. 2003;23:3439–3445. doi: 10.1523/JNEUROSCI.23-08-03439.2003. [DOI] [PMC free article] [PubMed] [Google Scholar]
- Gougoux F, Lepore F, Lassonde M, Voss P, Zatorre RJ, Belin P. Neuropsychology: pitch discrimination in the early blind. Nature. 2004;430:309. doi: 10.1038/430309a. [DOI] [PubMed] [Google Scholar]
- Grant AC, Thiagarajah MC, Sathian K. Tactile perception in blind Braille readers: a psychophysical study of acuity and hyperacuity using gratings and dot patterns. Percept Psychophys. 2000;62:301–312. doi: 10.3758/bf03205550. [DOI] [PubMed] [Google Scholar]
- Hartveit E, Veruki ML. Studying properties of neurotransmitter receptors by non-stationary noise analysis of spontaneous postsynaptic currents and agonist-evoked responses in outside-out patches. Nat Protoc. 2007;2:434–448. doi: 10.1038/nprot.2007.47. [DOI] [PubMed] [Google Scholar]
- Hollmann M, Hartley M, Heinemann S. Ca2+ permeability of KA-AMPA–gated glutamate receptor channels depends on subunit composition. Science. 1991;252:851–853. doi: 10.1126/science.1709304. [DOI] [PubMed] [Google Scholar]
- Iurilli G, Ghezzi D, Olcese U, Lassi G, Nazzaro C, Tonini R, Tucci V, Benfenati F, Medini P. Sound-driven synaptic inhibition in primary visual cortex. Neuron. 2012;73:814–828. doi: 10.1016/j.neuron.2011.12.026. [DOI] [PMC free article] [PubMed] [Google Scholar]
- Jitsuki S, Takemoto K, Kawasaki T, Tada H, Takahashi A, Becamel C, Sano A, Yuzaki M, Zukin RS, Ziff EB, Kessels HW, Takahashi T. Serotonin mediates cross-modal reorganization of cortical circuits. Neuron. 2011;69:780–792. doi: 10.1016/j.neuron.2011.01.016. [DOI] [PMC free article] [PubMed] [Google Scholar]
- Lee HK. Ca-permeable AMPA receptors in homeostatic synaptic plasticity. Front Mol Neurosci. 2012;5:17. doi: 10.3389/fnmol.2012.00017. [DOI] [PMC free article] [PubMed] [Google Scholar]
- Lessard N, Paré M, Lepore F, Lassonde M. Early-blind human subjects localize sound sources better than sighted subjects. Nature. 1998;395:278–280. doi: 10.1038/26228. [DOI] [PubMed] [Google Scholar]
- Merabet LB, Hamilton R, Schlaug G, Swisher JD, Kiriakopoulos ET, Pitskel NB, Kauffman T, Pascual-Leone A. Rapid and reversible recruitment of early visual cortex for touch. PLoS One. 2008;3:e3046. doi: 10.1371/journal.pone.0003046. [DOI] [PMC free article] [PubMed] [Google Scholar]
- Merabet LB, Battelli L, Obretenova S, Maguire S, Meijer P, Pascual-Leone A. Functional recruitment of visual cortex for sound encoded object identification in the blind. Neuroreport. 2009;20:132–138. doi: 10.1097/WNR.0b013e32832104dc. [DOI] [PMC free article] [PubMed] [Google Scholar]
- Oh MC, Derkach VA. Dominant role of the GluR2 subunit in regulation of AMPA receptors by CaMKII. Nat Neurosci. 2005;8:853–854. doi: 10.1038/nn1476. [DOI] [PubMed] [Google Scholar]
- Röder B, Teder-Sälejärvi W, Sterr A, Rösler F, Hillyard SA, Neville HJ. Improved auditory spatial tuning in blind humans. Nature. 1999;400:162–166. doi: 10.1038/22106. [DOI] [PubMed] [Google Scholar]
- Sadato N, Pascual-Leone A, Grafman J, Ibañez V, Deiber MP, Dold G, Hallett M. Activation of the primary visual cortex by Braille reading in blind subjects. Nature. 1996;380:526–528. doi: 10.1038/380526a0. [DOI] [PubMed] [Google Scholar]
- Swanson GT, Kamboj SK, Cull-Candy SG. Single-channel properties of recombinant AMPA receptors depend on RNA editing, splice variation, and subunit composition. J Neurosci. 1997;17:58–69. doi: 10.1523/JNEUROSCI.17-01-00058.1997. [DOI] [PMC free article] [PubMed] [Google Scholar]
- Traynelis SF, Silver RA, Cull-Candy SG. Estimated conductance of glutamate receptor channels activated during EPSCs at the cerebellar mossy fiber-granule cell synapse. Neuron. 1993;11:279–289. doi: 10.1016/0896-6273(93)90184-s. [DOI] [PubMed] [Google Scholar]
- Turrigiano GG, Leslie KR, Desai NS, Rutherford LC, Nelson SB. Activity-dependent scaling of quantal amplitude in neocortical neurons. Nature. 1998;391:892–896. doi: 10.1038/36103. [DOI] [PubMed] [Google Scholar]
- Van Boven RW, Hamilton RH, Kauffman T, Keenan JP, Pascual-Leone A. Tactile spatial resolution in blind braille readers. Neurology. 2000;54:2230–2236. doi: 10.1212/wnl.54.12.2230. [DOI] [PubMed] [Google Scholar]
- Wong M, Gnanakumaran V, Goldreich D. Tactile spatial acuity enhancement in blindness: evidence for experience-dependent mechanisms. J Neurosci. 2011;31:7028–7037. doi: 10.1523/JNEUROSCI.6461-10.2011. [DOI] [PMC free article] [PubMed] [Google Scholar]