

Abstract
Objective
Sphingomyelin synthase (SMS) catalyzes the conversion of ceramide to sphingomyelin (SM), and sits at the crossroads of sphingolipid biosynthesis. SMS has two isoforms: SMS1 and SMS2. Although they have the same SMS activity, they are different enzymes with distinguishable subcellular localizations and cell expression patterns. It is conceivable that these differences could yield different consequences, in terms of sphingolipid metabolism and its related atherogenesis.
Methods and Results
we created Sms1 gene knockout (KO) mice and found that Sms1 deficiency significantly decreased plasma, liver, and macrophage SM (59%, 45%, and 54%, respectively), but had only a marginal effect on ceramide levels. Surprisingly, we found that Sms1 deficiency dramatically increased glucosylceramide and GM3 levels in plasma, liver, and macrophages (4 to 12 fold), while Sms2 deficiency had no such effect. We evaluated total SMS activity in tissues and found that Sms1 deficiency causes 77% reduction of SMS activity, indicating SMS1 is the major SMS in macrophages. Moreover, Sms1 deficient-macrophages have significantly higher glucosylceramide synthase activity. We also found that Sms1 deficiency significantly attenuated toll-like 4 receptor-mediated NF-κB and MAP kinase activation after LPS treatment. To evaluate atherogenicity, we transplanted Sms1 KO mouse bone marrow into LDL receptor KO mice (Sms1−/−→Ldlr−/−). After 3 months on a Western diet, these animals showed a significant decrease of atherosclerotic lesions in the root and the entire aorta (35% and 44%, P<0.01, respectively), and macrophage content in lesions (51%, P<0.05), compared with WT→Ldlr−/−) mice.
Conclusions
Sms1 deficiency decreases SM, but dramatically increases the levels of glycosphingolipids. Atherosclerosis in Sms1−/−→Ldlr−/− mice is significantly decreased.
Keywords: Sphingomyelin synthase 1, sphingomyelin, glucosylceramide synthase, glycosphingolipids, cholesterol efflux, inflammation, bone marrow transplantation, atherosclerosis
Sphingomyelin synthase (SMS) sits at the crossroads of sphingolipid biosynthesis. Blockage of SMS activity should influence not only SM and ceramide levels, but also those of other related sphingolipids, including glycosphingolipid, sphingosine, and sphingosine-1-phosphate. SMS has two isoforms: SMS1 and SMS2. Although both enzymes catalyze the same reactions, their subcellular localizations are different: SMS1 is found in the trans-Golgi apparatus, while SMS2 is predominantly found in the plasma membranes (1). It is conceivable that different cellular localizations could yield different consequences, in terms of sphingolipid metabolism and its related atherogenesis. We found that Sms2 deficiency significantly decreases SM levels in the blood, the liver and macrophages, but has only a marginal influence on other sphingolipid levels (2), and Sms2 total deficiency decreases atherosclerosis in mice (3). Although we have reported that macrophage Sms2 deficiency has antiatherogenic properties, SMS2 is only responsible for about 16% of total activity in macrophages (4). Thus the consequences of Sms deficiency in macrophages are still largely unknown.
Macrophage toll-like receptors (TLRs) are critically involved in inflammatory responses. Lipid rafts appear to provide a platform for interaction of TLRs with their ligands in macrophages (5–8), initiating NFκB and MAP kinase activation, a proinflammatory cytokine production, thus leading to inflammatory responses. TLR4 has been showed to play a role in early atheroma development (9). It is also conceivable that fundamental changes in the sphingolipid levels of the plasma membranes in Sms1 KO would influence the function of these proteins and alter inflammatory responses.
In the present study, we examined the effect of Sms1 deficiency on plasma, liver, and macrophage sphingolipid metabolism. Moreover, we examined macrophage-mediated cholesterol efflux and macrophage-mediated inflammatory responses after LPS induction. Finally, we evaluated macrophage-Sms1 deficiency on atherosclerosis.
Methods
See the supplemental materials (available online at http://atvb.ahajournals.org) for expanded Methods for: Creation of Sms1 KO mice, Bone marrow-derived macrophage (BMDM) isolation and culture, Lipid analyses by LC/MS/MS, (10) Lysenin treatment and cell mortality measurement, (2) SMS activity assay (2, 11), Glucosylceramide synthase activity assay, Cell surface receptor analysis by fluorescence-activated-cell sorter (FACS), Western blot analysis, Bone marrow transplantation to replace peripheral macrophages, immunostaining of macrophages in the plaque, and statistical analysis.
Results
Sms1 KO mouse preparation
We generated Sms1 KO mice by deleting part of exon 1, which contains the translation initiation codon ATG. This approach created an Sms1 null mouse allele (Fig. 1A), as shown by Southern blot (Fig. 1B). Real-time PCR demonstrated that there is no Sms1 expression whatever in the liver and macrophages (Fig. 1C). However, Sms1 deficiency does not influence Sms2 expression levels (Fig. 1D).
Figure 1.

Sms1 KO mouse preparation and SMS analysis. Panel A, Strategy for Sms1 KO mouse preparation. Panel B, Southern blot for Sms1. Genomic DNA was digested with HindIII and a 370-bp DNA fragment, just 3′ to the targeting vector, was used as a probe for Southern blots +/+, wild type; +/− heterozygous; −/−, homozygous; Panel C, SMS1 mRNA levels measured by real-time PCR; Panel D, SMS2 mRNA levels measured by real-time PCR. Panel E, SMS activity in Sms1 KO macrophages and the liver. Panel F, SMS activity in Sms2 KO macrophages and the liver. Mφ, macrophages. Values are Mean ± SD, n=5, *P<0.05.
Sms1 deficiency dramatically decreases macrophage SMS activity (77%, P<0.001) and produces a smaller but still significant reduction in liver SMS activity (15%, P<0.05) (Fig. 1E). On the other hand, Sms2 deficiency dramatically decreases liver SMS activity (80%, P<0.001) and produces a smaller but once again significant reduction in macrophage SMS activity (16%, P<0.05) (Fig. 1F). These results suggest that SMS1 is the major isoform in macrophages, while SMS2 is the major one in the liver. Moreover, Sms1 deficiency decreases brain, spleen, and lung SMS activity, while Sms2 deficiency decreases small intestine and kidney SMS activity (Supplement Fig. I).
Both Sms1 and Sms2 deficiencies decrease SM levels, while Sms1 deficiency dramatically increases glycosphingolipid levels, but that of Sms2 does not
We utilized enzymatic assays to measure plasma lipid levels in Sms1 KO and control animals, finding no significant changes in total cholesterol, phospholipids, or triglycerides (Supplement Table I). We then used LC/MS/MS to measure SM, ceramide, sphingosine-1-phosphate (S1P), hydroxyceramide, glucosylceramide, GM3, and phosphatidylcholine (PC) levels in mouse plasma. We found, as expected, significant decreases in plasma SM levels (52%, P<0.001) (Table 1). Unlike the results with Sms2 KO mice (Table 1) (12), plasma ceramide levels were not different in Sms1 KO mice as compared with controls. To our surprise, we also found that both glucosylceramide and GM3 were dramatically increased (7-fold and 6-fold, respectively) in Sms1 KO mouse plasma, but no such phenotype was observed in Sms2 KO animals (Table 1). Other tested sphingolipids showed no significant changes.
Table 1.
Mouse tissue sphingolipid measurement (LC/ESI/MS/MS).
| Mice | SM | PC | Cer | DHCer | S1P | Sa1P | Sph | GlyCer | GM3 |
|---|---|---|---|---|---|---|---|---|---|
| Plasma | μg/ml
|
ng/ml
|
|||||||
| WT | 95±10 | 1216±125 | 805±33 | 263±27 | 307±15 | 122±21 | 10±1 | 3714±358 | 342±22 |
| Sms1 KO | 38±6* | 1139±101 | 888±80 | 300±16 | 314±29 | 123±18 | 8±1 | 25705±2317* | 1996±219* |
| WT | 89±8 | 1192±87 | 796±55 | 307±36 | 351±30 | 103±16 | 12±2 | 3209±277 | 329±34 |
| Sms2 KO | 32±4* | 1232±110 | 1032±50* | 331±29 | 323±19 | 111±21 | 10±3 | 3638±421 | 367±51 |
| Liver | μg/mg protein
|
ng/mg protein
|
|||||||
| WT | 9±2 | 78±16 | 247±29 | 33±4 | --- | --- | 4±1 | 104±10 | 22±2 |
| Sms1 KO | 5±1* | 71±19 | 184±21* | 29±6 | --- | --- | 3±1 | 396±31* | 120±13* |
| WT | 7±3 | 82±21 | 267±31 | 39±5 | --- | --- | 5±2 | 122±15 | 16±3 |
| Sms2 KO | 3±1* | 76±11 | 284±42 | 33±8 | --- | --- | 4±1 | 109±19 | 19±5 |
| Macrophages | μg/mg protein
|
ng/mg protein
|
|||||||
| WT | 33±5 | 157±31 | 985±98 | 116±33 | --- | --- | 16±3 | 85±17 | 151±50 |
| Sms1 KO | 11±2* | 161±41 | 1027±128 | 143±36 | --- | --- | 35±19* | 1019±26* | 1255±77* |
| WT | 39±4 | 171±19 | 890±109 | 86±16 | --- | --- | 25±3 | 111±20 | 103±12 |
| Sms2 KO | 31±3* | 168±33 | 962±91 | 96±39 | --- | --- | 30±5 | 130±18 | 99±7 |
Value, mean±SD, n=6.
P<0.01.
SM, sphingomyelin; PC, phosphatidylcholine; Cer, ceramide; DHCer, dihydroceramide; Glycer, glucosylceramide; Sph, sphingosine; S1P, sphingosine-1-phosphate; Sa1P, sphinganine-1-phosphate.
It is known that the liver is one of the major organs for the production of SM-rich and atherogenic apolipoprotein B-containing lipoproteins (13). Since Sms1 KO mice showed a decrease of plasma SM levels, we next sought to measure sphingolipids in the liver. Although Sms1 is not a major isoform in the liver, its deficiency still significantly decreased liver SM levels (36%, P<0.05) (Table 1). Interestingly, liver ceramide levels were significantly decreased (26%, P<0.05), rather than increased. Glucosylceramide and GM3 again showed a dramatic increase (3.8-fold and 5.5-fold, respectively), compared with controls (Table 1).
Macrophages are the most prominent cell types in atherosclerotic lesions, and are associated with one hallmark of the disease: inflammation (13, 14). Since SMS1 is the major SMS in macrophages, it is important to study the consequences of Sms1 deficiency in relation to atherosclerosis. Sms1 deficiency significantly decreased macrophage SM levels (70%, P<0.0001) (Table 1). Macrophage ceramide levels were not significantly changed. Glucosylceramide and GM3 again showed dramatic increases (12-fold and 7-fold, respectively), compared with controls (Table 1).
To determine whether Sms1 deficiency affects membrane levels of SM, we employed lysenin which recognizes SM only when it forms aggregates or microdomains in the plasma membranes, subsequently lysing the cells. Therefore, lysenin-mediated cell mortality could indirectly reflect SM levels in the plasma membranes. As indicated in Figure 2A, Sms1−/− macrophages, red blood cells, and hepatocytes showed significantly less sensitivity to lysenin-mediated cytolysis than control cells. This implies that Sms1 deficiency significantly decreases SM levels in macrophage and other cell plasma membranes.
Figure 2.

Sms1 deficiency-mediated decrease of macrophage plasma membrane SM and increase of glycosphinglipids have no effect on cholesterol efflux. Panel A, Measurement of lysenin-mediated cell mortality. We used our published protocol to measure lysenin-mediated cell mortality (2). Panel B and C, macrophage plasma membrane lipid analysis by LC/MS/MS. Panel D, glucosylceramide synthase activity measurement. Macrophages were incubated with 3 μg/ml of NBD-ceramide at 37°C for 1 hr. Medium was collected after incubation. Total lipids were extracted from medium and were separated by thin layer chromatography (TLC) and the result was shown; Panel E and F, Quantitative display of NBD-glucosylceramide and NBD-SM in medium from WT and Sms1 KO macrophages; RBC, red blood cells; Mφ, macrophages; SM, sphingomyelin, PC, phosphatidylcholine; Chol, cholesterol; Cer, ceramide; GluCer, glucosylceramide. Values are Mean ± SD, n=5, *P<0.01.
We also isolated plasma membranes from WT and Sms1−/− macrophages, and performed Western blot to check the purity of the isolated plasma membranes. As shown in Supplemental Figure II, plasma membrane markers (Na+/K+ ATPase) were well detected. But no mitochondrial marker (Cytochrome C) could be found in the plasma membrane fraction, indicating that the plasma membrane preparation had achieved a satisfactory state of purity. We then utilized LC/MS/MS to measure plasma membrane sphingolipid levels. As shown in Figures 2B and C, Sms1−/− macrophage plasma membranes displayed significantly less SM (65%, P<0.001), and significantly more glucosylceramide (8.5 fold, P<0.0001) and GM3 (6.2 fold, P<0.0001). However, they exhibited no differences in ceramide, cholesterol, or PC levels, as compared with controls.
To investigate the mechanism of glucosylceramide accumulation, we incubated macrophages with NBD labeled ceramide (NBD-Cer) and measured NBD-glucosylceramide levels in the medium. We found that Sms1 deficiency causes significantly more NBD-glucosylceramide accumulation in the medium (2.75-fold, P<0.001) (Fig. 2D and E), suggesting Sms1 deficient macrophages have significantly higher glucosylceramide synthase activity than controls. We also did western blot for glucosylceramide synthase and found it was increased (Supplemental Fig. III). Moreover, we found that the production of NBD-SM is negligible during the one-hour incubation (Fig. 2D and F), suggesting, again, that SMS1 is the major SMS in macrophages.
To investigate the effect of membrane SM directly, we examined whether exogenous SM supplementation could change the inflammatory properties of WT macrophages. We used lysenin assay to evaluate cell membrane SM levels and found exogenous supplementation of SM in culture increased the sensitivity of macrophages in response to lysenin-mediated cell death (Supplemental Fig. IVA). More importantly, SM supplementation could promote IL-6 production in response to LPS stimulation (10ng/ml, 16hrs) in a dose dependent fashion (Supplemental Fig. IVB). We also supplemented macrophages with different concentrations of glucosylceramide and GM3, and then measured IL-6 levels in the culture medium after LPS treatment. We found that neither of them has any effect (Supplemental Fig. IVC and D). Thus, our data supports that reduced membrane SM levels resulting from Sms1 deficiency caused the blunted inflammatory response of the macrophages.
Sms1-deficient macrophages attenuate NFκB and MAP kinase activation
To determine the impact of macrophage Sms1 deficiency on macrophage-mediated inflammation, LPS-induced MAP kinase and NFκB activation in Sms1 KO macrophages were compared with those of controls. As shown in Figure 3, starting 15 minutes after LPS (10 ng/ml) treatment, Sms1 KO macrophages displayed significantly decreased levels of all three phosphorylated MAP kinases (Phospho-p42/44, Phospho-JUK, and Phospho-p38), while total protein levels were not significantly altered (Figs. 3A-D). We also measured cytoplasmic IκBα, which must be degraded for NFκB to become activated, and found that its degradation was attenuated (Figs. 3A and E). These results indicate that Sms1 deficiency diminishes LPS-mediated macrophage MAP kinase and NFκB activation.
Figure 3.

Western blot of MAP kinase and IκBα and FACS analysis of TLR4. Macrophages were stimulated with LPS (10 ng/ml) for 0, 15 min, and 30 min. Macrophages homogenates were used for MAP kinase analysis. Macrophages were lysed and the cytoplasmic fraction isolated for IκBα analysis. Panel A, Western blot for MAP kinase, total protein and phosphorylated protein, and IκBα. Panel B–D, Quantitative display of the ratio of phosphorylated protein/total protein of MAP kinases; Panel E, Quantitative display of cytosol IκBα; Panel F, macrophage surface TLR4 analysis by FACS; Panel G, Quantitative display of FACS analysis. Values are Mean ± SD, n=6, *P<0.01.
We then sought to investigate LPS-induced cell surface recruitment of TLR4 and its coreceptor MD2, a consequence of signaling upstream of NFκB activation (15). FACS analysis showed that, after LPS stimulation, Sms1 KO macrophages contained fewer TLR4-MD2 complexes on the cell surfaces than control macrophages (Figs. 3F and G). This result indicates that Sms1 is essential for LPS-induced cell surface TLR4-MD2 complex recruitment.
We also sought to determine the impact of macrophage Sms1 deficiency on macrophage proinflammatory cytokine production, which is downstream of MAP kinase and NFκB activation. We performed an ex vivo study using LPS to stimulate cultured macrophages from both WT and Sms1 KO mice. We found that Sms1 deficiency significantly attenuates LPS-mediated IL-6 and TNFα secretion from macrophages, compared with controls (Figs. 4A and B). In line with these findings, we also discovered that plasma IL-6 and TNFα levels in Sms1 KO mice are significantly decreased after LPS stimulation (Figs. 4C and D), suggesting that Sms1 deficiency in macrophages results in less sensitivity to LPS- mediated inflammation. Since both IL-6 and TNFα levels were very low without LPS treatment, we can only measured monocyte chemotactic protein-1 (MCP-1), a chemokine involved in inflammation, and found that Sms1 KO mice have significantly less MCP-1 in the circulation (Fig. 4E). Moreover, Sms1 deficiency also significantly attenuates LPS-mediated MCP-1 secretion from macrophages (Fig. 4F).
Figure 4.

Cytokine and chemokine measurement in macrophage medium and mouse plasma. Panel A and B, IL6 and TNFα in macrophage medium after LPS treatment; Panel C and D, IL6 and TNFα mouse plasma after LPS treatment; Panel E, MCP-1 levels in mouse plasma without LPS treatment. Panel F, MCP-1 levels in mouse plasma after LPS treatment. All cytokine and chemokine were analyzed by ELISA. Results are representatives of 6 animals in each group. Values are mean ± SD, n=6, * P<0.01
We also measured macrophage apoA-I- and HDL-mediated cholesterol efflux and we did not find significant changes between the Sms1 KO and WT macrophages (Supplemental Fig. V).
Macrophage-specific Sms1 KO mouse preparation and atherosclerosis evaluation
Twenty six Ldlr−/− mice were lethally irradiated. After3 hours, half the animals were transplanted with Sms1−/− mouse bone marrow cells (Sms1−/−→Ldlr−/−), and the other half with WT ones (WT→Ldlr−/−). We monitored the process of cell replacement by PCR, using genomic DNA from mouse white blood cells as a template, and measured them 8 weeks after transplantation.
As expected, bone marrow-derived Sms1−/−→Ldlr−/− macrophages had no Sms1 expression (Supplement Fig. VIA), but had normal Sms2 mRNA levels (Supplement Fig. VIB). Sms1−/−→Ldlr−/− macrophages had significantly lower total SMS activity than controls (Supplement Fig. VIC, P<0.001). Sms1−/−→Ldlr−/− macrophages had significantly less SM levels and significantly higher Glucosylceramide and GM3 levels compared with controls (Supplement Table II). We also found that Sms1−/−→Ldlr−/− macrophages secreted significantly less IL-6 after LPS stimulation, compared with WT→Ldlr−/− controls (Supplement Fig. VII). At this point, the rest of the animals were switched to a Western diet (0.15% cholesterol, 20% saturated fat) for 3 months. We measured plasma lipid levels (cholesterol, SM, PC, and triglycerides) in these animals, finding no significant changes (Supplement Table III). There was no significant difference of blood cell counts between WT and Sms2 KO mice (Supplement Table IV).
To evaluate the impact of macrophage Sms1 deficiency on atherogenesis, we dissected mouse aortas and photographed them. We also measured proximal and whole aortic lesion areas. After 3 months on a Western diet, we found that all mice (18/18) had lesions in the aortic arch. However, the Sms1−/−→Ldlr−/− animals had observably smaller ones than the WT→Ldlr−/− ones (Fig. 5A).
Figure 5.
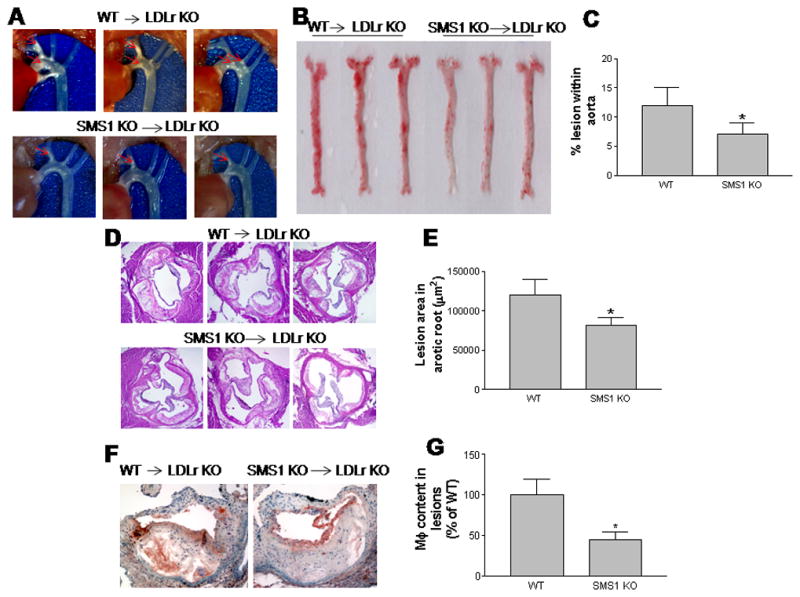
Sms1−/− bone marrow transplanted Ldlr−/− mice (Sms1−/−→Ldlr−/−) on a western diet have reduced atherosclerotic plaques with less macrophage accumulation. Panel A, Aortic arches with atherosclerotic plaques (red arrows). Panel B, En face aortic plaque analysis after Oil Red O staining. Panel C, Quantitative display of en face assay. Panel D, Aortic root assay for proximal lesion areas after H&E staining. Panel E, Quantitative display of root assay. Panel F, immunohistochemical staining of macrophage accumulation in lesions (brown staining). Panel G, Quantitative display of macrophage content. Results are representatives of nine animals in each group. Quantifications were done by using Image J software. Values are mean ± SD, n=9, * P<0.01.
We also found that the Sms1−/−→Ldlr−/− animals had 45% less lesion area in the whole aorta (Figs. 5B and C), and 35% less in the proximal aorta (Figs. 5D and E), compared with WT→Ldlr−/− mice. These differences were highly significant (P<0.001 and P<0.01, respectively).
We did immunohistochemistry for macrophages, finding that they were significantly decreased in Sms1−/−→Ldlr−/− mice, compared with controls (Figs. 5F and G). We determined the blood cell counts for both Sms1−/−→Ldlr−/− and WT→Ldlr−/− mice, finding no significant changes (Supplement Table IV).
Discussion
While we were preparing our Sms1 KO mice, Yano et al. reported that their Sms1 KO mice exhibited moderate neonatal lethality, reduced body weight, loss of fat tissues mass, β cell mitochondrial dysfunction, and insulin secretion inhibition (16). We also found that the targeted allele was not segregated in a Mendelian fashion. Homozygous crosses did not yielded viable progeny. We did not observe the body weight reduction and the reason is unknown. In this study, we focused on plasma and tissue sphingolipid metabolism and examine the atherosclerosis in Ldlr−/− mice which were transplanted with Sms1 deficient bone marrows. All these aspects were not investigated by the previous study (16).
In this study, we have demonstrated for the first time that disruption of the Sms1 gene caused: 1) a significant reduction of SM levels in the plasma, macrophages, and liver, and marginal changes on ceramide levels; 2) a dramatic increase of glycosphingolipid levels in the plasma, macrophages and liver; and 3) a significant reduction of macrophage MAP kinase and NFκB activation after LPS treatment. Finally and most importantly, Sms1 deficiency in bone marrow-derived cells led to a decrease in atherosclerosis in Ldlr−/− mice fed a Western diet for 3 months.
The first key finding of this study is that SMS1, like SMS2 (11), makes an important contribution to the de novo SM biosynthesis and SM levels in plasma, and in cell membranes. In support of our data, another report has indicated that both SMS1 and SMS2 are required for SM homeostasis and growth in human HeLa cells (17). SMS1 and SMS2 activity are coexpressed in a variety of tissues and cells (Supplement Fig. I). SMS1 is the major SMS in macrophages (Fig. 1E), while SMS2 is the major one in the liver (Fig. 1F).
The second key finding is that Sms1 deficiency dramatically increased glycosphingolipid levels, but that of Sms2 did not. The most common inherited defect in glycosphingolipid breakdown is Gaucher disease, an autosomal-recessive disorder arising from mutations in the gene encoding the lysosomal acid β-glucosidase 1 (GBA1) (18). GBA1-deficient mice have a Gaucher disease-like phenotype (19). GBA2 is a second glucosylceramidase located in the ER rather than the lysosome. Glucosylceramides have been found to accumulate in multiple tissues from GBA2 KO mice, leading to decreased fertility and the formation of abnormal sperm (20). We examined the bone marrow and spleens from Sms1 KO mice, finding no glucosylceramide accumulation or giant monocytes (typical cells in Gaucher disease) (data not shown) (20). We also measured glucosidase activity, finding no differences between the KO and control mice (data not shown). However, Sms1 deficiency significantly increased glucosylceramide synthase activity in macrophages (Figs. 2D and E). We believe that glucosylceramide synthase is upregulated to avoid ceramide accumulation in Golgi complex.
The different locations of SMS1 and SMS2 may explain why Sms1 deficiency accumulates glycosphingolipids in the tissues, but that of Sms2 does not. On one hand, SMS1 (1, 21), glucosylceramide synthase (22), and ganglioside synthases (23) are located in the same Golgi compartment. Sms1 deficiency promotes glucosylceramide and ganglioside accumulation by providing more substrate, i.e. ceramide. The Golgi-accumulated glycosphingolipids might influence the lipid levels in other organelles, plasma membranes, and blood, through vesicle trafficking, fusion, and secretion. On the other hand, SMS2 is located in cell plasma membranes where there are no glucosylceramide synthase or ganglioside synthase activities, so that Sms2 deficiency has no impact on glycosphingolipid accumulation.
It has been reported that the interaction of SM, cholesterol, and glycosphingolipids drives the formation of plasma membrane rafts (24). SMS1 has been implicated in the regulation of lipid raft SM level and raft functions such as FAS receptor clustering, (25) endocytosis, and apoptosis.(26) In this study, we observed that Sms1 deficiency not only reduces membrane SM levels significantly, but also increases those of membrane glycosphingolipids dramatically (Fig. 2C). The question is whether these changes influence macrophage inflammatory responses.
Sms1 deficiency has anti-inflammation properties. Accumulation of glycosphingolipids may make contribution to this property. It has been shown that dietary gangliosides decrease cholesterol content, caveolin expression, and inflammatory mediators in rat intestinal cell lipid rafts (27). Contrary, some reports have indicated that glycosphingolipids are potential atherogenic lipids (28). Thus, in general, the relationship between glycosphingolipid metabolism and inflammation is still largely unknown. In this study, we found that Sms1 deficiency, like that of Sms2, attenuates NFκB and MAP kinase activations. Our lipid supplement study indicated that SM but not glucosylceramide or GM3 enrichment on plasma membrane promotes inflammatory responses in macrophages after LPS stimulation (Supplement Figure IV).
The third key finding is that macrophage Sms1 deficiency decreases the atherogenic plaque size (Fig. 5A–E). In general, macrophage Sms1 deficiency yields a phenotype similar to that of Sms2 deficiency, in terms of atherogenicity. This is probably due to the reduction of SM in macrophages and in macrophage plasma membranes, which reduces inflammatory responses. While there has been a report indicating that inhibition of glucosylceramide synthase reduces atherosclerosis in mice, this has not been confirmed by another investigation (29). In this study, we found that Sms1 deficiency-mediated macrophage glycosphingolipid accumulation does not have proatherogenic properties (Fig. 5).
Ceramide can be generated through the de novo pathway (30) as well as sphingomyelinase pathway (31). Roles have been proposed for ceramide in atherogenesis, including mediating apoptosis (32) and inflammatory cytokine production (33). However, Sms1 deficiency has no effect on ceramide levels (Table 1; Fig. 2C); Thus Sms1 deficiency-mediated antiatherogenic effects might not be related to ceramide levels.
Macrophages cannot limit the uptake of cholesterol, and therefore depend on cholesterol efflux pathways for preventing their transformation into foam cells. Several ATP-binding cassette transporters (34) facilitate the efflux of cholesterol from macrophages. It is conceivable that fundamental changes of sphingolipid levels in plasma membranes could influence the function of these proteins, altering cholesterol efflux. Indeed, enhanced apoA-I-dependent cholesterol efflux by ABCA1 from SM-deficient Chinese hamster ovary (CHO) cells has been reported (35). We also reported that Sms2 deficiency decreases macrophage cholesterol efflux (4). However, we did not find changes in cholesterol efflux between the Sms1 KO and WT macrophages (Supplemental Fig. V).
In conclusion, Sms1 deficiency causes blunted NFκB and MAP kinase responses to inflammatory/immunological stimuli, and reduces atherosclerosis in a mouse model. Specific inhibition of SMS1 in macrophages may very well provide an antiatherosclerotic phenotype in which inflammatory responses can be curtailed.
Supplementary Material
Acknowledgments
We thank Drs. David Peake, and Youyan Zhang (Eli Lilly) for their valued support and technical guidance.
Sources of Funding
This study was supported by grants from the National Institutes of Health (HL093419), VA grant (BX000900) and the American Heart Association (Grant-in-Aid 0755922T).
Footnotes
Disclosures
No author reports any conflict of interest.
References
- 1.Huitema K, van den Dikkenberg J, Brouwers JF, Holthuis JC. Identification of a family of animal sphingomyelin synthases. EMBO J. 2004;23:33–44. doi: 10.1038/sj.emboj.7600034. [DOI] [PMC free article] [PubMed] [Google Scholar]
- 2.Hailemariam TK, Huan C, Liu J, Li Z, Roman C, Kalbfeisch M, Bui HH, Peake DA, Kuo MS, Cao G, Wadgaonkar R, Jiang XC. Sphingomyelin synthase 2 deficiency attenuates NFkappaB activation. Arterioscler Thromb Vasc Biol. 2008;28:1519–1526. doi: 10.1161/ATVBAHA.108.168682. [DOI] [PubMed] [Google Scholar]
- 3.Fan Y, Shi F, Liu J, Dong J, Bui HH, Peake DA, Kuo MS, Cao G, Jiang XC. Selective reduction in the sphingomyelin content of atherogenic lipoproteins inhibits their retention in murine aortas and the subsequent development of atherosclerosis. Arterioscler Thromb Vasc Biol. 2010;30:2114–2120. doi: 10.1161/ATVBAHA.110.213363. [DOI] [PMC free article] [PubMed] [Google Scholar]
- 4.Liu J, Huan C, Chakraborty M, Zhang H, Lu D, Kuo MS, Cao G, Jiang XC. Macrophage sphingomyelin synthase 2 deficiency decreases atherosclerosis in mice. Circ Res. 2009;105:295–303. doi: 10.1161/CIRCRESAHA.109.194613. [DOI] [PMC free article] [PubMed] [Google Scholar]
- 5.Lee HK, Dunzendorfer S, Soldau K, Tobias PS. Double-stranded RNA-mediated TLR3 activation is enhanced by CD14. Immunity. 2006;24:153–163. doi: 10.1016/j.immuni.2005.12.012. [DOI] [PubMed] [Google Scholar]
- 6.Wang R, Town T, Gokarn V, Flavell RA, Chandawarkar RY. HSP70 enhances macrophage phagocytosis by interaction with lipid raft-associated TLR-7 and upregulating p38 MAPK and PI3K pathways. J Surg Res. 2006;136:58–69. doi: 10.1016/j.jss.2006.06.003. [DOI] [PubMed] [Google Scholar]
- 7.Nakahira K, Kim HP, Geng XH, Nakao A, Wang X, Murase N, Drain PF, Sasidhar M, Nabel EG, Takahashi T, Lukacs NW, Ryter SW, Morita K, Choi AM. Carbon monoxide differentially inhibits TLR signaling pathways by regulating ROS-induced trafficking of TLRs to lipid rafts. J Exp Med. 2006;203:2377–2389. doi: 10.1084/jem.20060845. [DOI] [PMC free article] [PubMed] [Google Scholar]
- 8.Szabo G, Dolganiuc A, Dai Q, Pruett SB. TLR4, ethanol, and lipid rafts: a new mechanism of ethanol action with implications for other receptor-mediated effects. J Immunol. 2007;178:1243–1249. doi: 10.4049/jimmunol.178.3.1243. [DOI] [PubMed] [Google Scholar]
- 9.Higashimori M, Tatro JB, Moore KJ, Mendelsohn ME, Galper JB, Beasley D. Role of toll-like receptor 4 in intimal foam cell accumulation in apolipoprotein E-deficient mice. Arterioscler Thromb Vasc Biol. 2011;31:50–57. doi: 10.1161/ATVBAHA.110.210971. [DOI] [PMC free article] [PubMed] [Google Scholar]
- 10.Bui HH, Leohr JK, Kuo MS. Analysis of sphingolipids in extracted human plasma using liquid chromatography electrospray ionization tandem mass spectrometry. Anal Biochem. 2012 doi: 10.1016/j.ab.2012.01.027. [DOI] [PubMed] [Google Scholar]
- 11.Li Z, Hailemariam TK, Zhou H, Li Y, Duckworth DC, Peake DA, Zhang Y, Kuo MS, Cao G, Jiang XC. Inhibition of sphingomyelin synthase (SMS) affects intracellular sphingomyelin accumulation and plasma membrane lipid organization. Biochim Biophys Acta. 2007;1771:1186–1194. doi: 10.1016/j.bbalip.2007.05.007. [DOI] [PMC free article] [PubMed] [Google Scholar]
- 12.Liu J, Zhang H, Li Z, Hailemariam TK, Chakraborty M, Jiang K, Qiu D, Bui HH, Peake DA, Kuo MS, Wadgaonkar R, Cao G, Jiang XC. Sphingomyelin synthase 2 is one of the determinants for plasma and liver sphingomyelin levels in mice. Arterioscler Thromb Vasc Biol. 2009;29:850–856. doi: 10.1161/ATVBAHA.109.185223. [DOI] [PMC free article] [PubMed] [Google Scholar]
- 13.Nilsson A, Duan RD. Absorption and lipoprotein transport of sphingomyelin. Journal of lipid research. 2006;47:154–171. doi: 10.1194/jlr.M500357-JLR200. [DOI] [PubMed] [Google Scholar]
- 14.Libby P. Inflammation in atherosclerosis. Nature. 2002;420:868–874. doi: 10.1038/nature01323. [DOI] [PubMed] [Google Scholar]
- 15.Ogawa S, Lozach J, Benner C, Pascual G, Tangirala RK, Westin S, Hoffmann A, Subramaniam S, David M, Rosenfeld MG, Glass CK. Molecular determinants of crosstalk between nuclear receptors and toll-like receptors. Cell. 2005;122:707–721. doi: 10.1016/j.cell.2005.06.029. [DOI] [PMC free article] [PubMed] [Google Scholar]
- 16.Yano M, Watanabe K, Yamamoto T, Ikeda K, Senokuchi T, Lu M, Kadomatsu T, Tsukano H, Ikawa M, Okabe M, Yamaoka S, Okazaki T, Umehara H, Gotoh T, Song WJ, Node K, Taguchi R, Yamagata K, Oike Y. Mitochondrial dysfunction and increased reactive oxygen species impair insulin secretion in sphingomyelin synthase 1-null mice. J Biol Chem. 2011;286:3992–4002. doi: 10.1074/jbc.M110.179176. [DOI] [PMC free article] [PubMed] [Google Scholar]
- 17.Tafesse FG, Huitema K, Hermansson M, van der Poel S, van den Dikkenberg J, Uphoff A, Somerharju P, Holthuis JC. Both sphingomyelin synthases SMS1 and SMS2 are required for sphingomyelin homeostasis and growth in human HeLa cells. The Journal of biological chemistry. 2007;282:17537–17547. doi: 10.1074/jbc.M702423200. [DOI] [PubMed] [Google Scholar]
- 18.Zimran A, Gelbart T, Westwood B, Grabowski GA, Beutler E. High frequency of the Gaucher disease mutation at nucleotide 1226 among Ashkenazi Jews. Am J Hum Genet. 1991;49:855–859. [PMC free article] [PubMed] [Google Scholar]
- 19.Xu YH, Quinn B, Witte D, Grabowski GA. Viable mouse models of acid beta-glucosidase deficiency: the defect in Gaucher disease. Am J Pathol. 2003;163:2093–2101. doi: 10.1016/s0002-9440(10)63566-3. [DOI] [PMC free article] [PubMed] [Google Scholar]
- 20.Yildiz Y, Matern H, Thompson B, Allegood JC, Warren RL, Ramirez DM, Hammer RE, Hamra FK, Matern S, Russell DW. Mutation of beta-glucosidase 2 causes glycolipid storage disease and impaired male fertility. J Clin Invest. 2006;116:2985–2994. doi: 10.1172/JCI29224. [DOI] [PMC free article] [PubMed] [Google Scholar]
- 21.Yamaoka S, Miyaji M, Kitano T, Umehara H, Okazaki T. Expression cloning of a human cDNA restoring sphingomyelin synthesis and cell growth in sphingomyelin synthase-defective lymphoid cells. The Journal of biological chemistry. 2004;279:18688–18693. doi: 10.1074/jbc.M401205200. [DOI] [PubMed] [Google Scholar]
- 22.Marks DL, Wu K, Paul P, Kamisaka Y, Watanabe R, Pagano RE. Oligomerization and topology of the Golgi membrane protein glucosylceramide synthase. J Biol Chem. 1999;274:451–456. doi: 10.1074/jbc.274.1.451. [DOI] [PubMed] [Google Scholar]
- 23.Allende ML, Li J, Darling DS, Worth CA, Young WW., Jr Evidence supporting a late Golgi location for lactosylceramide to ganglioside GM3 conversion. Glycobiology. 2000;10:1025–1032. doi: 10.1093/glycob/10.10.1025. [DOI] [PubMed] [Google Scholar]
- 24.Simons K, Ikonen E. Functional rafts in cell membranes. Nature. 1997;387:569–572. doi: 10.1038/42408. [DOI] [PubMed] [Google Scholar]
- 25.Miyaji M, Jin ZX, Yamaoka S, Amakawa R, Fukuhara S, Sato SB, Kobayashi T, Domae N, Mimori T, Bloom ET, Okazaki T, Umehara H. Role of membrane sphingomyelin and ceramide in platform formation for Fas-mediated apoptosis. J Exp Med. 2005;202:249–259. doi: 10.1084/jem.20041685. [DOI] [PMC free article] [PubMed] [Google Scholar]
- 26.Van der Luit AH, Budde M, Zerp S, Caan W, Klarenbeek JB, Verheij M, Van Blitterswijk WJ. Resistance to alkyl-lysophospholipid-induced apoptosis due to downregulated sphingomyelin synthase 1 expression with consequent sphingomyelin- and cholesterol-deficiency in lipid rafts. Biochem J. 2007;401:541–549. doi: 10.1042/BJ20061178. [DOI] [PMC free article] [PubMed] [Google Scholar]
- 27.Park EJ, Suh M, Thomson B, Thomson AB, Ramanujam KS, Clandinin MT. Dietary ganglioside decreases cholesterol content, caveolin expression and inflammatory mediators in rat intestinal microdomains. Glycobiology. 2005;15:935–942. doi: 10.1093/glycob/cwi078. [DOI] [PubMed] [Google Scholar]
- 28.Glaros EN, Kim WS, Wu BJ, Suarna C, Quinn CM, Rye KA, Stocker R, Jessup W, Garner B. Inhibition of atherosclerosis by the serine palmitoyl transferase inhibitor myriocin is associated with reduced plasma glycosphingolipid concentration. Biochem Pharmacol. 2007;73:1340–1346. doi: 10.1016/j.bcp.2006.12.023. [DOI] [PubMed] [Google Scholar]
- 29.Glaros EN, Kim WS, Rye KA, Shayman JA, Garner B. Reduction of plasma glycosphingolipid levels has no impact on atherosclerosis in apolipoprotein E-null mice. J Lipid Res. 2008;49:1677–1681. doi: 10.1194/jlr.E800005-JLR200. [DOI] [PubMed] [Google Scholar]
- 30.Merrill AH., Jr Characterization of serine palmitoyltransferase activity in Chinese hamster overy cells. Biochimica et biophysica acta. 1983;754:284–291. doi: 10.1016/0005-2760(83)90144-3. [DOI] [PubMed] [Google Scholar]
- 31.Hannun YA. Functions of ceramide in coordinating cellular responses to stress. Science. 1996;274:1855–1859. doi: 10.1126/science.274.5294.1855. [DOI] [PubMed] [Google Scholar]
- 32.Mallat Z, Tedgui A. Current perspective on the role of apoptosis in atherothrombotic disease. Circulation research. 2001;88:998–1003. doi: 10.1161/hh1001.090571. [DOI] [PubMed] [Google Scholar]
- 33.Gulbins E, Kolesnick R. Raft ceramide in molecular medicine. Oncogene. 2003;22:7070–7077. doi: 10.1038/sj.onc.1207146. [DOI] [PubMed] [Google Scholar]
- 34.Cavelier C, Lorenzi I, Rohrer L, von Eckardstein A. Lipid efflux by the ATP-binding cassette transporters ABCA1 and ABCG1. Biochimica et biophysica acta. 2006;1761:655–666. doi: 10.1016/j.bbalip.2006.04.012. [DOI] [PubMed] [Google Scholar]
- 35.Nagao K, Takahashi K, Hanada K, Kioka N, Matsuo M, Ueda K. Enhanced apoA-I-dependent cholesterol efflux by ABCA1 from sphingomyelin-deficient Chinese hamster ovary cells. The Journal of biological chemistry. 2007;282:14868–14874. doi: 10.1074/jbc.M611230200. [DOI] [PubMed] [Google Scholar]
Associated Data
This section collects any data citations, data availability statements, or supplementary materials included in this article.