Abstract
For interstitial photodynamic therapy (PDT), cylindrical diffusing fibers (CDF’s) are often used to deliver light. This study examines the feasibility and accuracy of using CDF’s to characterize the absorption (μa) and reduced scattering (μs′) coefficients of heterogeneous turbid media. Measurements were performed in tissue-simulating phantoms with μa between 0.1 and 1cm−1 and μs′ between 3 and 10 cm−1 with CDF’s 2 to 4 cm in length. Optical properties were determined by fitting the measured light fluence rate profiles at a fixed distance from the CDF axis using a heterogeneous kernel model in which the cylindrical diffusing fiber is treated as a series of point sources. The resulting optical properties were compared with independent measurement using a point source method. In a homogenous medium, we are able to determine the absorption coefficient μa using a value of μs′ determined a priori (uniform fit) or μs′ obtained by fitting (variable fit) with standard(maximum) deviations of 6% (18%) and 18% (44%), respectively. However, the CDF method is found to be insensitive to variations in μs′, thus requiring a complementary method such as using a point source for determination of μs′. The error for determining μa decreases in very heterogeneous turbid media because of the local absorption extremes. The data acquisition time for obtaining the one-dimensional optical properties distribution is less than 8 seconds. This method can result in dramatically improved accuracy of light fluence rate calculation for CDFs for prostate PDT in vivo when same model and geometry is used for forward calculations using the extrapolated tissue optical properties.
Keywords: photodynamic therapy, optical properties
1 INTRODUCTION
Photodynamic therapy (PDT) is a treatment modality where light of a given wavelength activates a photosensitizing drug in the presence of oxygen (Dougherty et al., 1998). PDT is often used to treat superficial tumors like those of skin, lung, esophagus and bladder. PDT is approved by the US Food and Drug Administration for the treatment of obstructing lung cancer, micro-invasive lung cancer and obstructing esophageal cancer and Barrett’s esophagus with high-grade dysplasia.
Prostate cancer is the most common malignancy in men in the United States (Jemal A, 2011). Several clinical trials of prostate PDT have been published (Weersink et al., 2005a; Weersink et al., 2005b; Nathan et al., 2002; Zaak et al., 2004; Stripp et al., 2004; Verigos et al., 2006; Trachtenberg et al., 2007; Trachtenberg et al., 2008; Patel et al., 2008). Unlike superficial treatments where collimated laser source is used, point sources or cylindrical diffusing fibers (CDFs) are inserted interstitially into prostate gland using techniques similar to those used in brachytherapy. Our current work focuses on PDT for treatment of solid tumors and lesions in solid organs.
Optical fiber-based isotropic detectors are used in clinical trials of PDT to measure incident and scattered light (Baas et al., 1997; Solonenko et al., 1999; Zhu et al., 2005a). Calculation of the distribution of light in the tissue at points other than the point of measurement, however, requires knowledge of the optical properties of the tissue. Several publications have addressed the issue of determining the optical properties in human (Chen et al., 1997; Essenpreis, 1992; Chen and Hetzel, 1998; Lee et al., 1997; Pantelides et al., 1990; Whitehurst et al., 1994; Lee et al., 1995, 1999; Zhu et al., 2005b; Zhu et al., 2005c) and animal (Arnfield et al., 1993; Chen et al., 1997; Zhu et al., 2003) prostate tissues. Most commonly, the optical properties are determined by measuring the fluence rate at different source-detector separations. By measuring the relative fluence rate for a range of separations, the diffusion approximation of light transport can be used to determine the effective attenuation coefficient μeff which depends on both μa and μs′. In an infinite medium, additional information is required to separate the two coefficients. In our previous work, we have separated the optical coefficients using a calibrated measurement of the absolute fluence rate, which also provides information about the in vivo fluence rate (Dimofte et al., 2005; Zhu et al., 2005b). These methods are robust and reliable, and rigorously separate the effects of absorption and scattering. However, they suffer one drawback that may make clinical implementation outside of a clinical trial impractical; the optical properties are measured with a different set of sources than those used for treatment, which generally relies on cylindrical diffusive fibers (CDF) (Stripp et al., 2004; D’Amico and Coleman, 1996; Lee et al., 1997; Zhu and Finlay, 2006). This requires insertion of light sources that are not used clinically, which significantly increases the total time required for the procedure.
In this work, we seek to replace the point-like light source used to measure optical properties in our previous work with the CDF’s used for treatment light delivery. This new measurement method, while slightly less robust than the point-source method, can be implemented using only the CDF inserted for treatment, and, with proper switching, can be performed during small breaks in treatment that do not significantly extend the treatment time. We anticipate that this will be a significant advance in the effort to bring quantitative light dosimetry to the clinic.
2 METHODS
2.1 Isotropic detectors and cylindrical diffusive fibers (CDF)
The detectors used in this study were optical fiber-based isotropic detectors (Rare Earth Medical, West Yarmouth, MA) of the scattering-tip type (Marijnissen and Star, 1996). The light collected by the detectors was digitized using a photodiode-based in-vivo light dosimetry system (Zhu et al., 2005a). The detectors were calibrated to measure absolute fluence rate in air and corrected for the effects of decreased refractive index mismatch in the liquid and solid phantoms (Star et al., 1988; Star, 1997). In the case of our liquid phantoms, the reading was increased by a factor of 1.8 (Zhu et al., 2005a). Each corrected profile was divided by the source power.
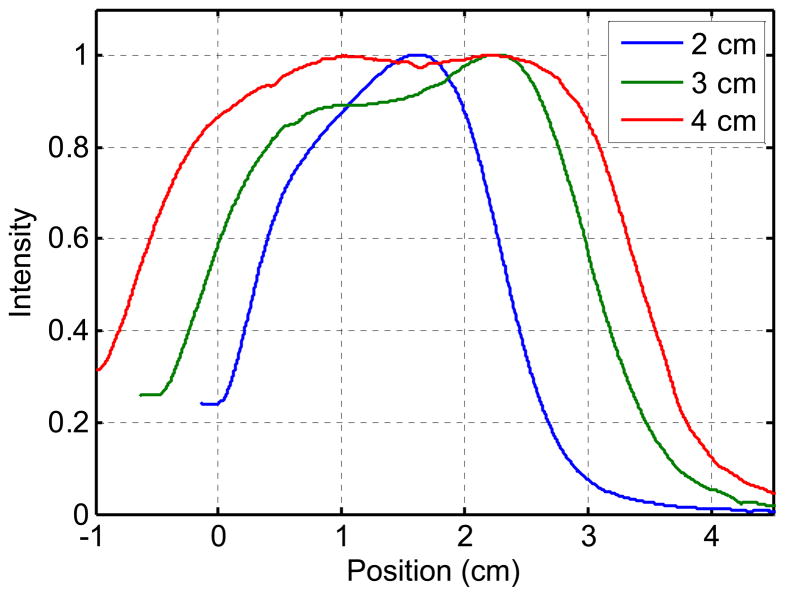
To account for the effect of the non-uniform source strength distribution of the CDF’s, the light distribution was measured in air using an isotropic detector scanned along each CDF. Figure 1 shows a typical in-air light fluence distributions of CDF’s of different lengths (2, 3 and 4 cm).
Figure 1.
Examples of the in-air light fluence rate distribution for 2, 3 and 4 cm long CDF placed 7mm from the isotropic detector. The intensity was normalized to be 1 at the maximum value
2.2 Phantom preparation
Optical properties were measured in liquid and solid phantoms. The liquid tissue simulating phantoms were made of separate scattering and absorbing components, namely fat emulsion (Liposyn III, 30% Abbott Lab, North Chicago, IL) and India ink (Higgins black India ink #4418, Higgins, Bellwood IL). The phantoms were placed in a plastic container that was painted in black and was large enough (18.2 × 14.6 × 7.7 cm3) to avoid scattering from the boundaries. This type of phantom has been described in the literature by Madsen (Madsen, 1992).
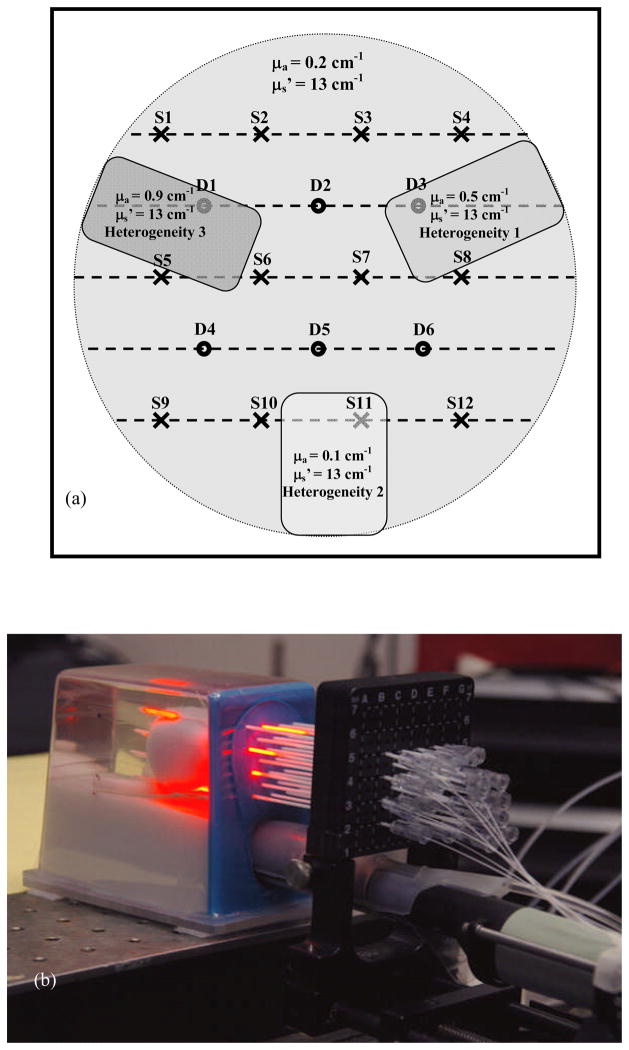
RTV silicon phantoms were prepared using the method described by Bays et al (Bays et al., 1997) and Beck et al (Beck et al., 1998). These phantoms are composed of a base compound (RTV12A), curing agent (RTV12C), absorber (Carbon black) and scatterer (titanium dioxide (TiO2)). The inhomogeneous solid phantom used for our measurements was composed of a uniform phantom with μa = 0.2 cm−1 and μs′ = 13cm−1 and three small in homogeneities, each having the same scattering coefficient of 13 cm−1, and absorption coefficients of 0.1, 0.5 and 0.9 cm−1.
2.3 Independent Characterization of phantom optical properties
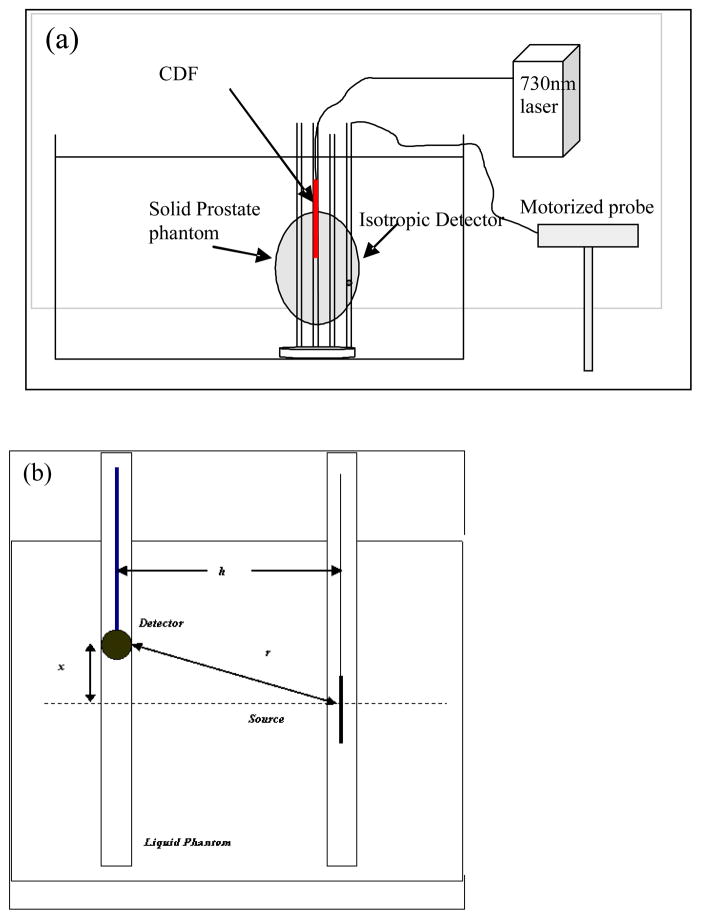
The optical properties were calculated based on the concentrations of the India ink and intralipid (or carbon black and TiO2 in the solid phantoms), and independently determined in liquid phantoms using measurements based on a point source in the liquid phantoms (Dimofte et al., 2005). The experimental setup for point source measurement is shown in Figure 2. We used a device consisting of 2 parallel catheters separated by 0.5 cm. An isotropic point source was placed in one of the catheters and connected to a 730 nm diode laser (Diomed 730, Cambridge, UK). An isotropic detector was placed in the other catheter. The isotropic detector was connected to a light dosimetry system and its position was controlled by a translation stage, allowing the detector to be scanned along its catheter parallel to the light source. Fluence rate measurements were made at 0.05 mm intervals along its movement. The data acquisition speed for a scan of 10 cm distance with 2000 data points was about 8 seconds, giving a scan speed of 12.5 mm/s.
Figure 2.
Schematics for (a) the inhomogeneous prostate phantom and (b) the homogeneous liquid phantom. The distance between the CDF and the detector is h. The CDF is placed at a distance x from the surface of the phantom, while the detector is moved along the catheter.
2.4 Interstitial phantom measurements
Cylindrical diffusing fibers (CDF’s) with active lengths of 2 to 4 cm were used as light sources and were placed inside the phantom through transparent plastic catheters (Flexi-needle, Best medical International, Springfield, VA). A 15-W, 732 nm diode laser (Model 730, Diomed, Ltd., Cambridge, United Kingdom) was used as the light source. The catheters were aligned to the prostate using a template that provided spacing of 0.5cm in lateral and vertical directions (Fig. 2a). The fluence rate was measured using a 0.5 mm scattering tip isotropic detector that was moved along a parallel catheter using a motorized probe described above. Measurements were taken in both a solid prostate-simulating phantom and liquid phantoms, as shown schematically in Fig. 2a and Fig. 2b, respectively.
Transparent catheters were inserted in parallel, through a template, into the prostate with the guidance of a transrectal ultrasound (TRUS) unit. The CDFs were placed in the catheters, in such way that it would cover the entire prostate, as shown in Fig. 3(b). The placement in the prostate phantom of each of the twelve CDF’s (S1 through 12) as well as the placement of the six detectors (D1 through D6) is shown in Fig. 3(a). For the point source measurements, the position of the light sources and detectors were switched, i.e., point sources are now placed in positions labeled D1 – D6 while 12 isotropic detectors were placed in positions labeled S1 – S12. There are cases when the catheter exits the prostate phantom and CDFs are actually placed partially in the exterior of the phantom. This will produce a scan that started in the air for the initial part of the scan, and then is continued in the phantom. When analyzing this data set, we fit the entire range, but we ignore the optical properties obtained in the phantom’s exterior.
Figure 3.
(a) Diagram showing the needle positioning and the three in homogeneity placements throughout the prostate phantom. The CDF and detectors placement is shown by crosses and the dots, respectively. The three inhomogeneities are drawn as grey colored rectangles throughout the phantom. (b) Experimental setup for prostate measurement showing the phantom and the placement of the catheters inside the phantom.
As in a clinical prostate PDT procedure, even though the tips of all catheters were planned to be aligned on the same apex plane, they deviated to up to 1 cm. All measured profiles were therfore shifted to align the calculated light fluence rate with the measured light fluence rate so that the starting point of the CDF is defined as starting point, i.e., 0 cm.
2.5 Data analysis and source modeling
To rigorously determine the optical properties in a heterogeneous phantom, one has to solve the inverse problem for the steady state light diffusion equation, which has the form:
| (1) |
where D=1/3μs′ is the diffusion coefficient. Both optical properties (μa and μs′) are assumed to be spatially variant.
In our previous work using point-like sources to determine optical properties interstitially, we have used the diffusion approximation to the optical radiative transport equation an in infinite homogeneous medium,
| (2) |
where r is the distance from the source and S is the source power. Given an calibrated measurement of fluence rate in the tissue, this model can rigorously separate μa and μs′ using standard nonlinear minimization techniques (Dimofte et al., 2005).
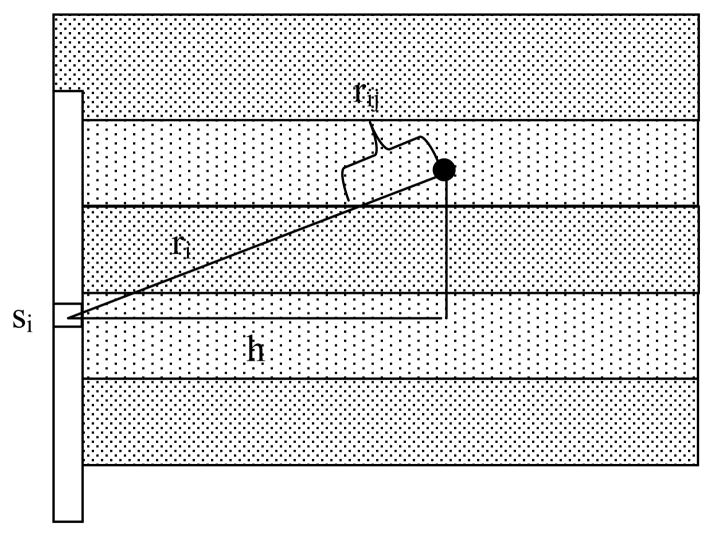
When this model is extended to a CDF of finite length, the model and the fitting become more complicated. We model a CDF as a sum of N point sources. In an infinite, homogeneous medium, the corresponding expression for the fluence rate is:
| (3) |
Where ri is the distance from the ith point source to the point of interest, and si is the power of the ith point source (see Fig. 4). The values of si are determined by measurements of the distribution of light emitted along the length of the CDF (Φair) as described above (see Fig. 1) and the total source power of the CDF (Smeas), and calculated subject to the constraints:
| (4a) |
| (4b) |
where Δx is the spacing between the point sources used to model the CDF. In the parallel-catheter geometry employed here, we rely on the falloff with distance along the catheter to separate μa and μs′. For a point source, this problem is well-posed, as we have demonstrated previously (Dimofte et al., 2005). In the limit of an infinitely long CDF, the problem becomes ill posed because of the symmetry of the source; in the parallel-catheter geometry, we vary the position of the detector along a line parallel to the source axis, so an infinite source yields no falloff information. In reality, we have the intermediate situation of a finite but extended source. We take advantage of this by collecting data beyond the end of the source, including the falloff of light beyond the source. Accounting for heterogeneities in addition to the extended source poses a solvable but computationally challenging problem. To address this, we have implemented a two-step fitting algorithm.
Figure 4.
Schematic of the linear diffuser model for a cylindrical diffusing fiber (CDF) with length composed of a series of point sources. The medium is divided into bins along the direction of the CDF’s long axis, as shown. The optical properties used to calculate the contribution from source i to the point of interest (solid circle) are averaged along the line connecting the two, weighted by the fractional length contained in each bin (rij), as described in the text.
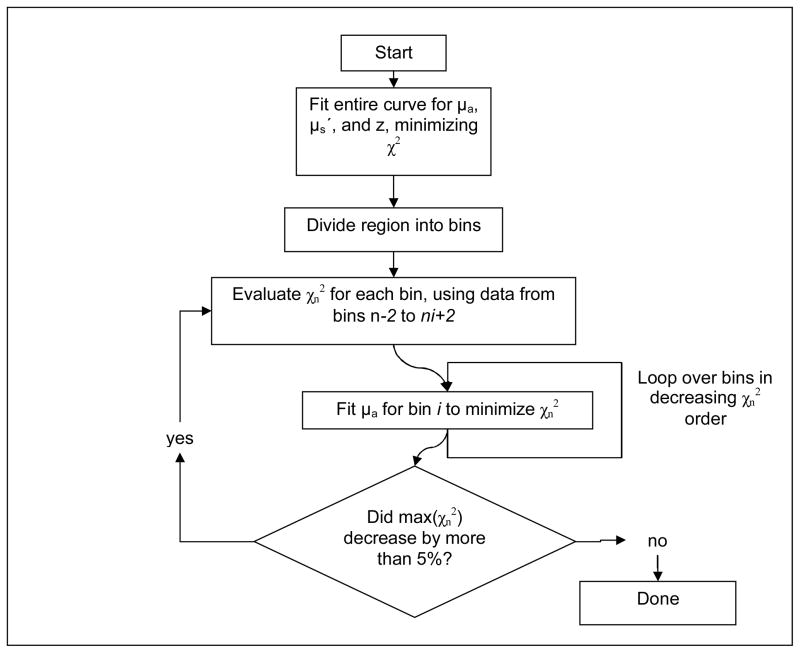
First, the entire curve is fit assuming homogeneous optical properties using the Nelder-Mead nonlinear multidimensional minimization algorithm available in Matlab (fminsearch). This step takes into account the measured variations in the intensity of the CDF, but not variations in optical properties. A third free parameter is the alignment of the source and detector along the z (longitudinal) direction. The result is a three-dimensional optimization that converges rapidly, ensures proper alignment of the source and detector positions, and produces uniform optical properties.
In reality, the optical properties of tissue are rarely truly uniform. The second step in the fitting algorithm is designed to account for variations in optical properties. We have previously demonstrated the ability of similar measurements using point sources of illumination to constrain both μa and μs′ (Dimofte et al., 2005). In the case of CDFs, however, the number of free parameters (one value of μa and one value of μs′ for each spatial location) becomes large compared to the number of measurements used to constrain them. While there are up to 1000 points per scan, they are made in close physical proximity with a single illumination source, so they do not constitute independent measurements. Therefore, it is impractical to determine μa and μs′ at every location. Instead, we assume that μs′ is uniform within each scan, and calculate the variation in μa. To investigate the influence of uncertainty in μs′ determination, we have also performed fits using a modified version of this first step, in which the value of μs′ is fixed and the free parameters are μa and the source alignment in the z direction. This required a priori knowledge of μs′, so it is necessary to use independent methods, such as point source measurements, to determine μs′.
The scan is divided into regions determined by the resolution of the desired optical property map. The medium is assumed to consist of optically homogeneous slabs whose borders are perpendicular to the CDF’s long axis, as shown in Fig. 4. The (chi-squared) deviation between the initial (uniform optical properties) fit and the measured data within each region is calculated. Because this step allows μa to vary spatially, we must take into account the fact that the space between the source and the point of interest may include regions with different μa. We replace equation 4 with
| (5) |
where the mean effective attenuation coefficient is the average weighted by the fraction of the line connecting the source and the point of interest that falls within each bin:
| (6) |
Here, nbin is the number of optical properties bins between the source and detector, μeff(ij) is the effective attenuation coefficient of the jth bin, and rij is the distance along the line connecting the source and detector that falls within the jth bin, as shown in Fig. 4. Hence, each term in the sum in Eq. 4 requires a separate weighted average to calculate μeff.
Each region’s μa is fit individually. The fit uses as its penalty function the chi-squared goodness-of-fit statistic calculated over the region being optimized and the adjacent four regions (two on either side), χn2.
| (7) |
Where Φmeas(k) and σmeas(k) are the measured fluence rate and estimated measurement uncertainty at the kth measurement point, respectively, and Φcalc(k) is the fluence rate calculated for the kth measurement point using equation 5. The sum in equation 7 includes all measurement points within regions n−2 to n+2. This ensures that the optimal μa will be consistent with the continuous measured data. At each iteration, the value of χn2 is calculated for each region. The regions are ranked and fit in order of decreasing χn2. A simple, one-dimensional, nonlinear fit (fminbnd, Matlab) is performed to optimize only the value of μa within the selected region. In each iteration, the value of μa in each region is constrained to change by no more than 30% in either direction, to prevent spatial oscillations in the solution. The value of 30% was chosen empirically as a reasonable balance between conversion speed and solution smoothness. The cycle of fitting is repeated until subsequent fits decrease the maximum value of χn2 by less than 5%. A flowchart of this fitting process is shown in Fig. 5.
Figure 5.
Flowchart of the two-step fitting algorithm used to extract μa and μs′ in heterogeneous media. The penalty functions χ2 and χn2 are calculated over the entire measured curve and the nth bin and its two nearest neighbors, respectively.
To evaluate the sensitivity of our model and algorithm to μa and μs′, we generated an ideal fluence profile Φ0 (z) using Eq. 2 assuming homogenous optical properties μa0 and μs0′. We then varied μa and μs′ across a wide range and calculated the Root-Mean-Square (RMS) deviation between the resulting Φ profile and Φ0 (z). The resulting deviation surface is analogous to χ2, but does not take into account the uncertainty in the measurement. It therefore describes the inherent sensitivity of the model to variations in optical properties.
The form of Eq. 5 is similar to that referred to as “model 1” in our previous work on light fluence rate calculations in heterogeneous media (Li and Zhu, 2008). This formalism has been shown to agree with measurements in heterogeneous media to within 35% (Li and Zhu, 2008). Although the formula can be improved to achieve better agreement with measurements, it comes with added computational burden and is thus not used in the current study. We compared the results of our current model (Eq. 5) with those of a finite element method (FEM) calculation using the diffusion equation (equation 1).
3. RESULTS
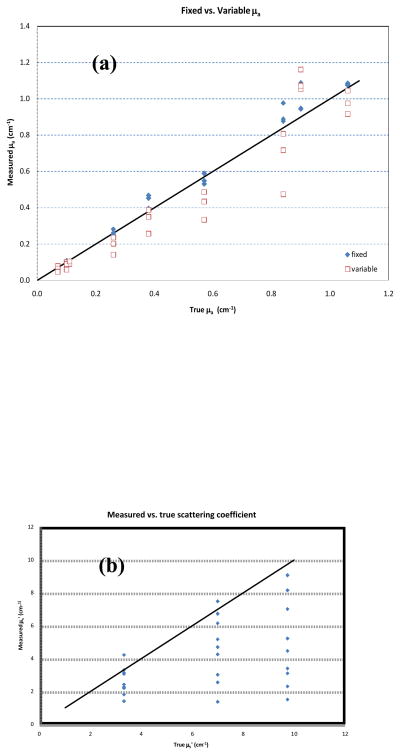
Measurements of the optical properties of a homogeneous sample were within clinically acceptable uncertainties, as shown in table 1. When the value of μs′ was allowed to vary (columns labeled ‘uniform source variable - μs′ fit’), the optical properties were determined with slightly larger uncertainty than when the value of μs′ is fixed based on a priori knowledge (columns labeled ‘uniform source fixed – μs fit’). CDF methods are insensitive to the value of μs′, a point illustrated graphically in Fig. 6(b). While the overall trend in best-fit μs′ values follows the true values, individual points deviate by more than a factor of 2 (Fig. 6b). The results in homogeneous phantoms illustrate that the absorption coefficients obtained using CDF are quite reliable, independent of the value of corresponding μs′.
Table 1.
A summary of accuracy of obtaining optical properties for CDF methods using fixed μs′ (fixed fit), fixed μs′ ± 20%, and extrapolated μs′ (variable μs′ fit). Lengths of CDF used were 2, 3 and 4cm. The first column specifies the length of CDF used. The second column specifies the optical properties of the phantom determined using a point source method. The third column specifies the mean and standard deviation (stdev) and the relative stdev (%) of the measured μa using fixed μs′ to the known value. The difference (%diff) between measured mean value and the known value are also shown. The fourth column shows the mean μa value if the fixed μs′ is off from the true values by ± 20% along with its difference to the true values (%diff). The fifth column specifies the measured mean and standard deviation (stdev) and the relative stdev (%) of the measured μa using variable μs′ method. The difference between the measured mean value and the known values for μa and μs′ are also shown. Optical phantoms were made with Liposyn concentrations varying from 0.3% to 1.52% and ink concentrations varying from 0.0023%, to 0.023%. The separation between the two catheters was 0.5 cm. The unit for μa and μs′ is 1/cm.
| CDF Length | Known values | Uniform Source Fixed-μs′ fit | μs′ +/− 20% | % diff | Uniform Source Variable-μs′ fit | |||||||||||
|---|---|---|---|---|---|---|---|---|---|---|---|---|---|---|---|---|
| μa | μs′ | μa | μa | μs′ | μa | μs′ | ||||||||||
| mean | stdev | rel stdev | % diff | μa(+) | μa(−) | μa(+) | μa(−) | mean | stdev | rel stdev | mean | % diff | % diff | |||
| 2cm | 0.11 | 3.31 | 0.10 | 0.011 | 11% | −7% | 0.13 | 0.06 | 26% | −39% | 0.09 | 0.012 | 13% | 3.15 | −18% | −5% |
| 0.57 | 3.31 | 0.59 | 0.063 | 11% | 3% | 0.50 | 0.54 | −16% | −8% | 0.49 | 0.07 | 15% | 2.43 | −15% | −27% | |
| 1.06 | 3.31 | 1.08 | 0.085 | 8% | 2% | 0.99 | 1.21 | −8% | 13% | 0.98 | 0.10 | 10% | 2.20 | −8% | −33% | |
| 0.07 | 6.99 | 0.07 | 0.016 | 23% | 0% | 0.10 | 0.04 | 37% | −46% | 0.08 | 0.02 | 22% | 7.48 | 11% | 7% | |
| 0.26 | 6.99 | 0.25 | 0.029 | 11% | −2% | 0.28 | 0.24 | 10% | −6% | 0.24 | 0.03 | 12% | 6.15 | −9% | −12% | |
| 0.84 | 6.99 | 0.89 | 0.088 | 10% | 6% | 0.68 | 0.81 | −24% | −9% | 0.81 | 0.14 | 18% | 2.55 | −4% | −63% | |
| 0.10 | 9.73 | 0.11 | 0.018 | 17% | 6% | 0.12 | 0.09 | 8% | −18% | 0.10 | 0.02 | 17% | 9.07 | 0% | −7% | |
| 0.38 | 9.73 | 0.40 | 0.040 | 10% | 4% | 0.42 | 0.47 | 5% | 17% | 0.35 | 0.05 | 15% | 5.23 | −8% | −46% | |
| 0.90 | 9.73 | 0.94 | 0.071 | 8% | 5% | 0.99 | 1.16 | 5% | 22% | 1.05 | 0.14 | 13% | 3.40 | 17% | −65% | |
|
| ||||||||||||||||
| 3cm | 0.11 | 3.31 | 0.11 | 0.017 | 16% | −4% | 0.14 | 0.08 | 30% | −25% | 0.09 | 0.02 | 19% | 3.07 | −17% | −7% |
| 0.57 | 3.31 | 0.55 | 0.031 | 6% | −4% | 0.57 | 0.48 | 4% | −13% | 0.43 | 0.04 | 9% | 2.27 | −24% | −31% | |
| 1.06 | 3.31 | 1.08 | 0.088 | 8% | 2% | 1.10 | 1.03 | 2% | −5% | 0.92 | 0.11 | 12% | 1.82 | −13% | −45% | |
| 0.07 | 6.99 | 0.07 | 0.018 | 26% | −3% | 0.09 | 0.06 | 32% | −9% | 0.06 | 0.02 | 27% | 6.73 | −9% | −4% | |
| 0.26 | 6.99 | 0.26 | 0.045 | 17% | 0% | 0.26 | 0.19 | 0% | −27% | 0.20 | 0.05 | 26% | 4.70 | −22% | −33% | |
| 0.84 | 6.99 | 0.88 | 0.058 | 7% | 4% | 0.80 | 0.83 | −9% | −6% | 0.47 | 0.06 | 12% | 4.26 | −44% | −39% | |
| 0.10 | 9.73 | 0.11 | 0.020 | 19% | 7% | 0.11 | 0.08 | 0% | −21% | 0.09 | 0.02 | 23% | 8.16 | −10% | −16% | |
| 0.38 | 9.73 | 0.45 | 0.022 | 5% | 19% | 0.48 | 0.48 | 6% | 7% | 0.39 | 0.04 | 10% | 4.47 | 2% | −54% | |
| 0.90 | 9.73 | 0.95 | 0.068 | 7% | 5% | 0.87 | 0.96 | −8% | 2% | 1.07 | 0.13 | 12% | 3.10 | 19% | −68% | |
|
| ||||||||||||||||
| 4cm | 0.11 | 3.31 | 0.10 | 0.046 | 45% | −6% | 0.15 | 0.08 | 41% | −19% | 0.10 | 0.05 | 46% | 3.31 | −5% | 0% |
| 0.57 | 3.31 | 0.53 | 0.088 | 17% | −7% | 0.52 | 0.52 | −3% | −3% | 0.33 | 0.12 | 37% | 1.41 | −41% | −57% | |
| 1.06 | 3.31 | 1.09 | 0.290 | 27% | 2% | 1.00 | 0.93 | −8% | −14% | 1.05 | 0.21 | 20% | 4.23 | −1% | 28% | |
| 0.07 | 6.99 | 0.08 | 0.022 | 29% | 10% | 0.08 | 0.07 | 8% | −13% | 0.05 | 0.02 | 43% | 5.17 | −33% | −26% | |
| 0.26 | 6.99 | 0.28 | 0.046 | 16% | 8% | 0.25 | 0.25 | −11% | −11% | 0.14 | 0.05 | 36% | 3.02 | −46% | −57% | |
| 0.84 | 6.99 | 0.98 | 0.107 | 11% | 16% | 0.87 | 0.95 | −11% | −3% | 0.72 | 0.23 | 32% | 1.37 | −15% | −80% | |
| 0.10 | 9.73 | 0.09 | 0.025 | 29% | −14% | 0.10 | 0.07 | 12% | −20% | 0.06 | 0.02 | 41% | 7.01 | −41% | −28% | |
| 0.38 | 9.73 | 0.47 | 0.085 | 18% | 23% | 0.40 | 0.43 | −14% | −8% | 0.26 | 0.13 | 51% | 2.31 | −32% | −76% | |
| 0.90 | 9.73 | 1.09 | 0.123 | 11% | 21% | 0.95 | 1.07 | −13% | −2% | 1.16 | 0.35 | 30% | 1.51 | 29% | −84% | |
Figure 6.
(a) Absorption coefficient measured with fixed scattering coefficients vs. variable scattering coefficients for different CDF lengths. (b) Measured scattering coefficient vs. expected one for different lengths CDF. Data plotted for three reduced scattering coefficients: 3.3, 7 and 9.7 cm−1.
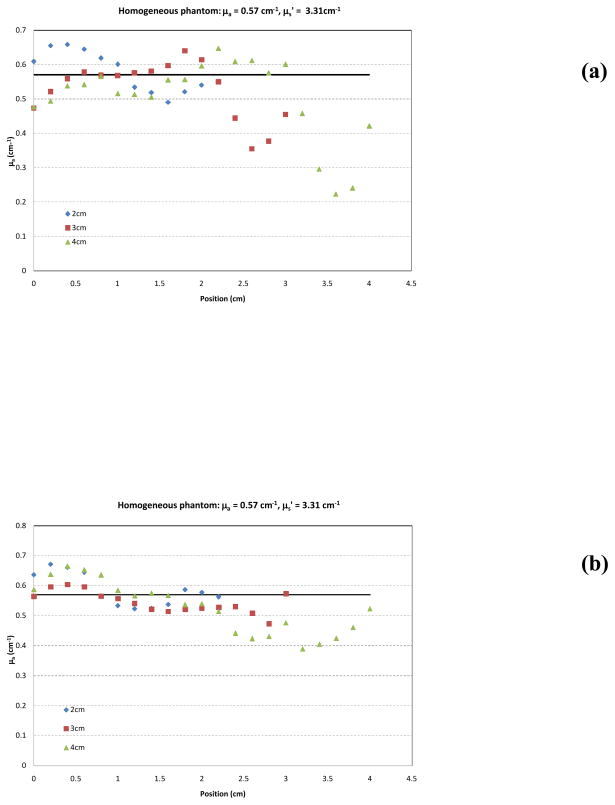
To evaluate the effect of approximating the physical source distribution with a uniform distribution, we fit a subset of the data shown in table 1 with both the measured source distribution (as shown in Fig. 1) and the uniform approximation. The results are summarized in Table 2. Changing the source distribution can influence the shape of the best-fit absorption distribution. This phenomenon is illustrated in Fig. 7(a & b), which shows the best fit of absorption coefficient based on the in air source profile (Fig. 7a) and the uniform profile (Fig. 7b) based on the variable-μs′ method for a selected homogeneous phantom. Data are shown for 2, 3 and 4 cm long CDF’s. The solid lines represent the expected value of μa. The uniform source strength gives more accurate recovery of μa. It is possible that the in-air scan may not completely represent the intensity profile distribution in all directions and that a uniform distribution may result in a better overall description of the intensity profile.
Table 2.
A summary of accuracy in determining absorption coefficient using CDF methods with uniform source strength distribution (uniform fit) and actual source strength distribution (in-air scan fit) in liquid phantom. The first column specifies the length of CDF used. The second column specifies the absorption coefficient μa of the phantom determined using a point source method. The third column specifies the mean and the standard deviation (stdev) of the measured μa using the uniform profile. The percentage difference (%diff) between the mean and the known μa value is also listed. The fourth column specifies the mean and the stdev of the measured μa using in-air profile. Fixed known μs′ was used in all fits. Lengths of CDFs used were 2, 3 and 4 cm. The three optical phantoms were made with Liposyn concentration of 0.71% (μs′ = 3.31 cm−1) and ink concentrations: 0.0023%, 0.011% and 0.023%. The unit of μa is 1/cm.
| CDF Length | Known Values | Uniform Fit | In-air scan fit | ||
|---|---|---|---|---|---|
|
| |||||
| μa | μa ± μa | %diff (%) | μa ± μa | %diff (%) | |
| 2cm | 0.11 | 0.10 ± 0.01 | −7% | 0.11 ± 0.02 | −5% |
| 0.57 | 0.59 ± 0.06 | 3% | 0.59 ± 0.06 | 4% | |
| 1.06 | 1.08 ± 0.09 | 2% | 1.09 ± 0.10 | 3% | |
|
| |||||
| 3cm | 0.11 | 0.10 ± 0.02 | −4% | 0.11 ± 0.03 | −1% |
| 0.57 | 0.55 ± 0.03 | −4% | 0.55 ± 0.06 | −3% | |
| 1.06 | 1.08 ± 0.09 | 2% | 1.08 ± 0.08 | 2% | |
|
| |||||
| 4cm | 0.11 | 0.10 ± 0.05 | −6% | 0.10 ± 0.04 | −7% |
| 0.57 | 0.53 ± 0.09 | −7% | 0.53 ± 0.08 | −7% | |
| 1.06 | 1.09 ± 0.29 | 2% | 1.06 ± 0.18 | 0% | |
Figure 7.
Measured absorption coefficient μa vs. position along CDF using fixed a priori μs′ for 2, 3 and 4 cm long CDFs using (a) in-air source profile and (b) uniform source profile. The solid line represents the expected value for μa (0.57 cm−1). The expected value for μs′ is 3.3 cm−1.
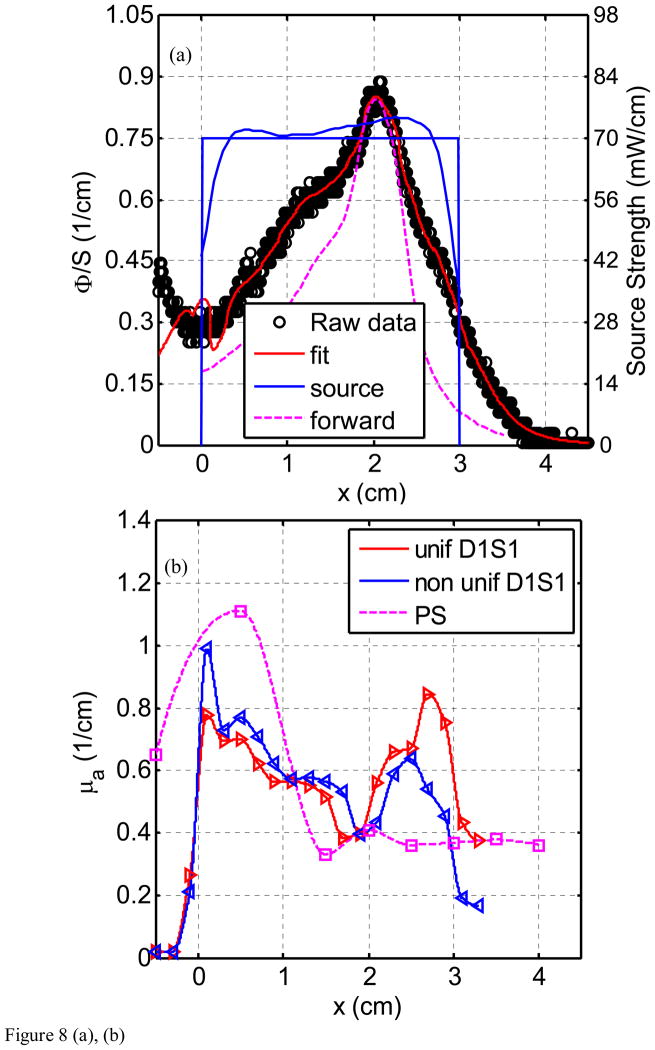
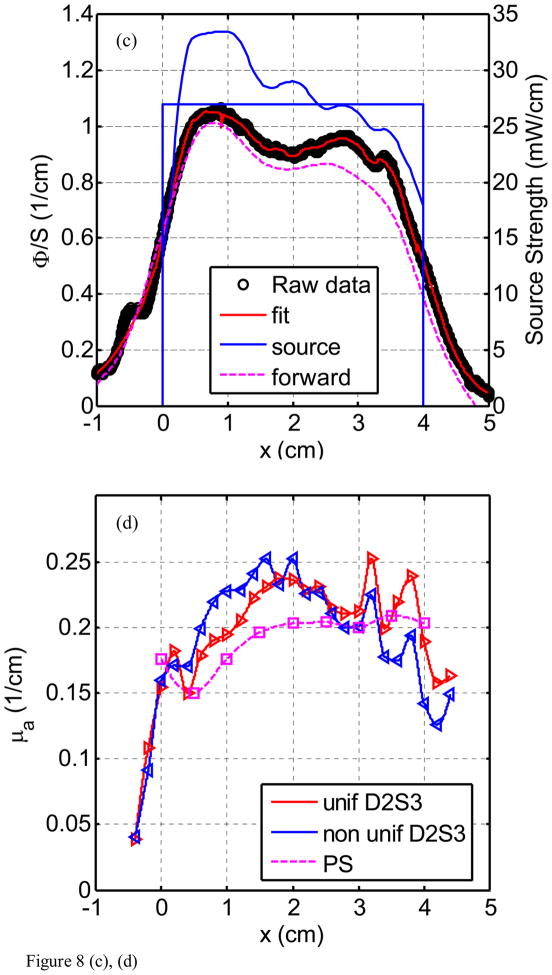
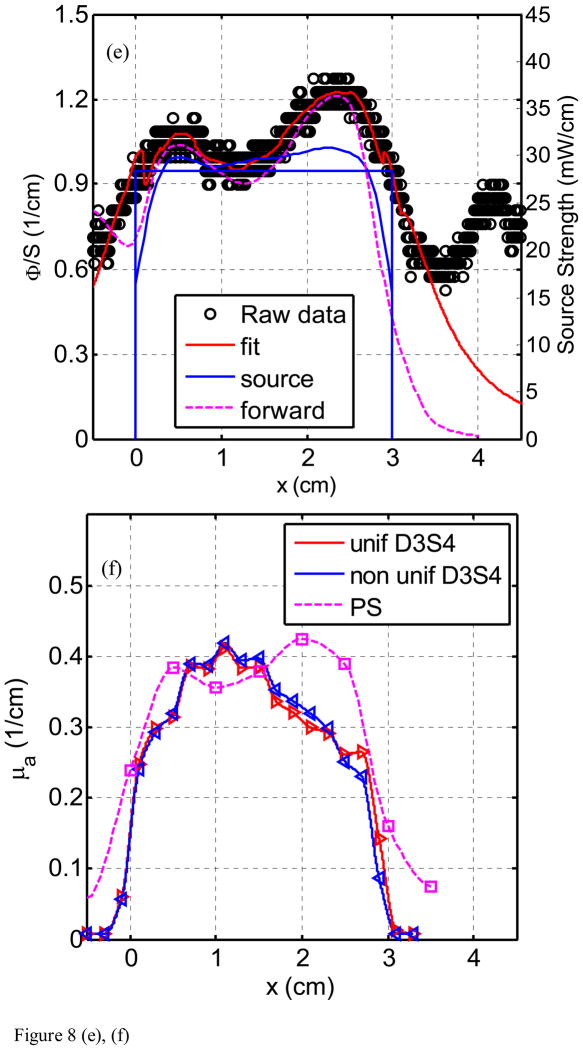
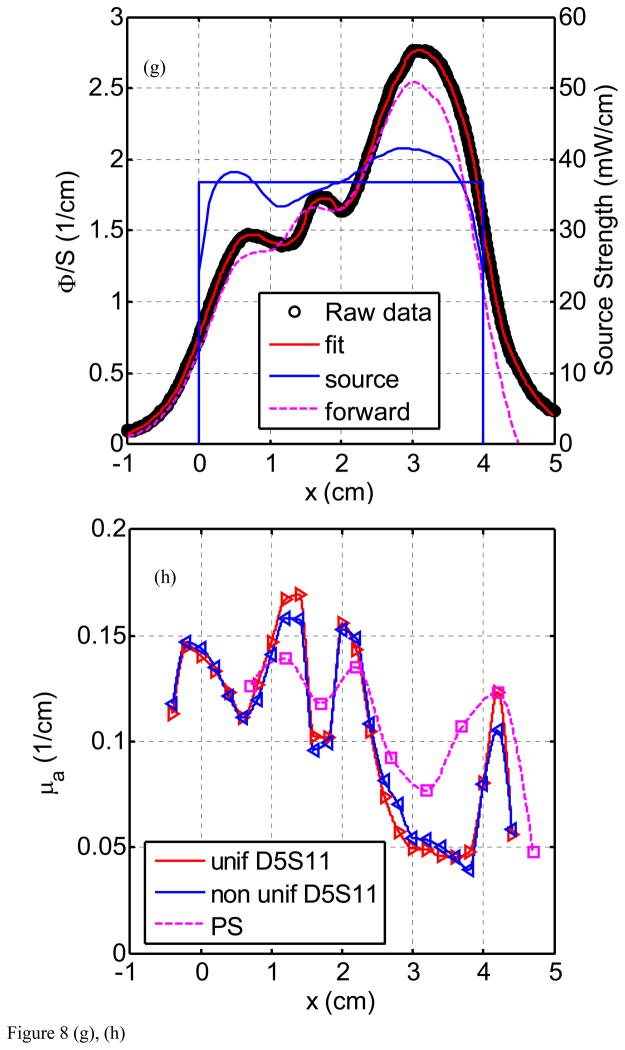
Figure 8(a) through (h) show the fluence rate per unit source strength (upper graph, left vertical axis), the source strength (upper graph, right vertical axis), and absorption coefficients vs. position along CDF (lower graph) obtained from various detector - CDF pairs in the solid prostate phantom for a 4-cm long CDF. Figure 8(a) is for light fluence rate per source strength and source strength distribution for the pair detector 1 and source 1 (D1–S1). The dots represent the data, the red line represents the fit, and the solid and dotted blue lines show the source strength for uniform and actual distributions of that particular CDF based on the in-air scan (Eq. 4), respectively. Notice the origin of x-axis (0) is always aligned with the starting edge of the CDF. Figure 8(b) plots the absorption coefficient vs. distance as determined along the CDF direction. Figure 8(c) and d show the results for the detector 2 and source 3 (for a 4cm long CDF). In Fig. 8(e) and (f), the results are shown for detector 3 and source 4 (4 cm long CDF). Figures 8(g) and (h) plot the results for detector 5 and source 11. The summary results comparing the measured and the known optical properties are listed in Table 3.
Figure 8.
Light fluence rate (mW/cm2) per source strength (mW/cm) (upper graph) and extrapolated absorption coefficients μa (lower graph) for various detector-CDF pairs in the heterogeneous prostate phantom. In the upper graphs, the dots represent measured data, the red line represents the fit, the solid blue lines represent the in air scan and the uniform source strength of that particular CDF, and the dashed lines represent the FEM-based forward calculation using the extrapolated optical properties, respectively, for (a) source 1 and detector 1, (c) source 3 and detector 2, (e) source 4 and detector 3, and (g) source 11 and detector 5. The light fluence rate per source strength and source strength use left and right vertical axes, respectively. In the lower graph, μa vs. position using point and CDFs are plotted for (b) source 1 and detector 1, (d) source 3 and detector 2, (f) source 4 and detector 3, and (h) source 11 and detector 5.
Table 3.
Results for heterogeneous phantom. The first three columns list the known values and position of μa for the phantom background and three heterogeneities (numbered 1, 2, 3, clockwise starting from upper right corner) according to Fig. 3. Column four lists the mean and standard deviation of the measured μa for the background and the three heterogeneities. The last column specifies the percentage difference between the measured and the true μa value.
| Description | Region specification | True μa values | Uniform Fit | In-air scan fit | ||||
|---|---|---|---|---|---|---|---|---|
|
| ||||||||
| Measured μa values | % diff | Max % diff | Measured μa values | % diff | Max % diff | |||
|
| ||||||||
| Background | D2, S3 (Fig. 8d) | 0.2 | 0.212±0.026 | 6% | 26% | 0.212±0.026 | 6% | 26% |
| Heterogeneity 1 | D3, S4 (Fig. 8f) | 0.5 | 0.381±0.024 | 24% | 33% | 0.390±0.022 | 22% | 30% |
| Heterogeneity 2 | D5, S11 (Fig. 8h) | 0.1 | 0.130±0.030 | 30% | 69% | 0.127±0.029 | 27% | 57% |
| Heterogeneity 3 | D1, S1 (Fig. 8b) | 0.9 | 0.654±0.085 | 27% | 37% | 0.731±0.146 | 19% | 37% |
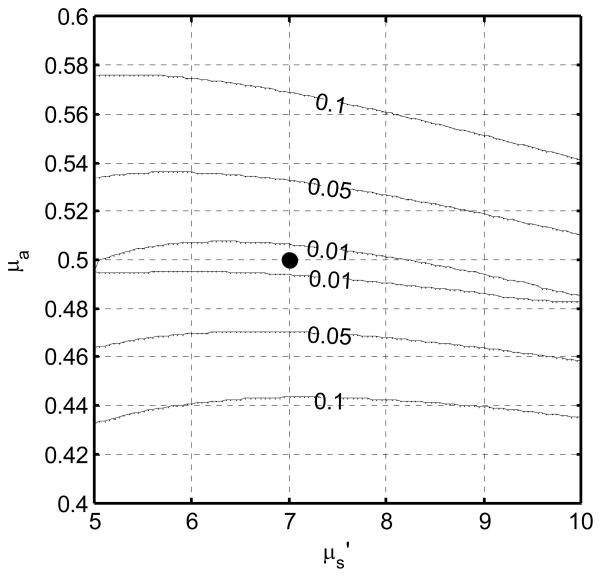
The inherent sensitivity of our model to the absorption and scattering parameters is illustrated in Fig. 9. The contours represent lines of iso-RMS deviation between an ideal fluence distribution calculated with optical properties μa and μs′, and one calculated with the nominal optical properties μa0 and μs0′, 0.5 and 7 cm-1, respectively in this example. The narrow, nearly horizontal contours indicate that the algorithm is inherently more sensitive to μa than μs′.
Figure 9.
RMS relative deviation in fluence rate measured along a line parallel to an ideal 4 cm source in an infinite medium. The simulated optical properties (where the deviation is zero) are indicated by the solid circle.
4. DISCUSSION
The uncertainties of extrapolating the absorption coefficients μa using CDF in homogeneous phantoms are examined in detail in Table 1 and Fig. 6a. The standard (maximum) deviation for determining μa in homogeneous optical phantom is 6% (18%) and 18% (44%) for uniform source fixed-μs′ fit and uniform source variable-μs′ fit, respectively (Table 1). The uniform source fixed-μs′ fit uses a uniform source strength along CDF and use the prior known μs′ while the uniform source variable-μs′ fit uses a uniform source strength along CDF and allow the software to determine μs′ on its own, which can be up to 84% different from the true μs′. Figure 6a shows the same results in Table 1 graphically. To further examine the impact of errors of μs′ on the determination of μa, we have also shown the extrapolated μa data in Table 1 when μs′ is deliberately set to ±20% from its true values. In this case, the standard (maximum) deviation for determining μa in homogeneous optical phantom is 15% (46%).
The uncertainty of extrapolating the reduced scattering coefficients μs′ in a homogeneous phantom is shown in Table 1 and Fig. 6b for different lengths of CDF. The sensitivity for determination of μs′ is quite poor using CDFs. This results from the fact that the independent determination of μa and μs′ requires two independent measurements. In the case of the point source, these are the absolute value of the fluence rate and the rate of falloff with distance. It is only beyond the ends of a finite CDF that the differentiation between μa and μs′ approaches the point-source situation. As a result, independent method such as the point source method should be used to determine μs′.
The idealized case of synthetic data produced with homogeneous optical properties provides insight into the sensitivity of the fitting algorithm, as shown in Fig. 9, which plots contours of relative RMS deviation in signal measured from a 4-cm CDF in a homogenous medium. The deviation about the true μa and μs′ (0.5 and 7 cm−1, respectively) changes rapidly with μa but only slowly with μs′. In fact, the 1% RMS error contour encompassed μs′ values from 5 to 10 cm−1, but μa values only from 0.48 to 0.51 cm−1. Similar results are found across the range of optical properties measured in this work (data not shown). When fitting real data, this deviation is essentially the chi-squared used to constrain the fit. It is therefore not surprising that finding the minimum chi squared constrains μa relatively tightly, but μs′ only very loosely. The best fit optical properties lie in a long, narrow “valley” in χ2 space, aligned nearly parallel to the μs′ axis, making the best fit value of μs′ very sensitive to any noise in the measurement.
Figure 7 shows that when we apply the heterogeneous algorithm using CDF to a homogenous phantom, the code is able to recover the absorption coefficient μa correctly, even though one does not assume that μa were homogeneous. As a result, the data in Table 1, is an average of data obtained in 9 phantoms, each is similar to Fig. 7(b). Figure 7(b) represents the uncertainties one would expect using uniform source strength.
Similar values of μa are also obtained whether one uses the realistic source strength distribution for the CDF (using the in-air scan) or assuming the CDF has uniform source strength distribution, see Fig. 7. A summary of accuracy in determining absorption coefficient using CDF methods with uniform source strength distribution (uniform fit) and actual source strength distribution (in-air scan fit) in liquid phantom is shown in Table 2. The percentage difference between extrapolated mean and the true μa is up to 7% for the uniform source strength and up to 12% for the in-air source strength profile. The standard deviation of μa for each μa condition is also about the same (see Table 2). However, the spatial distribution of μa deviates generally more from the true μa for the in-air source strength profile than that for the uniform source strength profile. The reason is unknown but we speculate that the actual in-air source strength may have a directional dependence which is not accounted for in the current study.
The comparison between μa obtained using point sources and CDF methods shows good agreement in heterogeneous prostate phantom (Fig. 8). This is indicative that our approximation (Eq. 5) used in calculating light fluence rate in heterogeneous medium yields acceptable accuracy. Using CDF method to extrapolate μa is more sensitive in showing heterogeneity than using the point source method simply because the step size for moving the point source is kept at 0.5 cm which can result in missing the regions with large heterogeneity. Comparison of the fit μa also agreed with the expected absorption coefficients as shown in Fig. 3(a). For D1–S1 combination (Fig. 8b), the fit μa (0.6 – 1.0 cm−1) is in the region of the expected μa (0.9 cm−1) for heterogeneity 3. For D2–S3 combination (Fig. 8d), the fit μa (0.15 – 0.2 cm−1) is in good agreement with the expected μa (0.2 cm−1) for the background. For D3 – S4 combination (Fig. 8f), the fit μa (0.2 – 0.43 cm−1) is in between the μa for the background (0.2 cm−1) and the μa (0.5 cm−1) for heterogeneity 1. For D5 – S11 combination (Fig. 8h), the fit μa (0.1 – 0.15 cm−1) is in between the μa for the background (0.2 cm−1) and the μa (0.1 cm−1) for heterogeneity 2. Table 3 summarizes the percentage difference between the true values and the extrapolated values.
We concluded from the uncertainty analysis of the results in Fig. 8 and Table 3 that one can accurately extrapolate μa to an standard(maximum) deviations of 30% (69%) using the uniform source strength and 27% (57%) using the in-air profile. Substantial differences between measured and expected values of the phantom could be attributed to many errors: first, there is the possibility of a breakdown of our algorithm in a heterogeneous medium. However, we have shown with forward FEM calculation in the heterogeneous phantom (Fig. 8) that the error caused by our algorithm is not significant, resulting in an error of up to 30% in light fluence rate given a very heterogeneous condition. The second significant source of error is due to the physical locations of the distances between CDFs (or point sources) and detectors. In the algorithm, they were assumed to be exactly on the 0.5cm grid. In reality, they are most likely not, very possible up to 3mm off from the grid. This is probably the main source of error. The important point is that we can use the extrapolated optical properties and predict the light fluence correctly. It is impossible to detect nonparallel or curved catheter placement from the data alone except in the most extreme cases. Therefore, an independent measurement of catheter position is required to address this uncertainty. Work is ongoing to make use of real-time or near-real-time ultrasound imaging to determine the position, angle, and curvature of the catheters placed in the prostate. Once these positions are determined, they can be incorporated into the algorithm described here with only trivial modification.
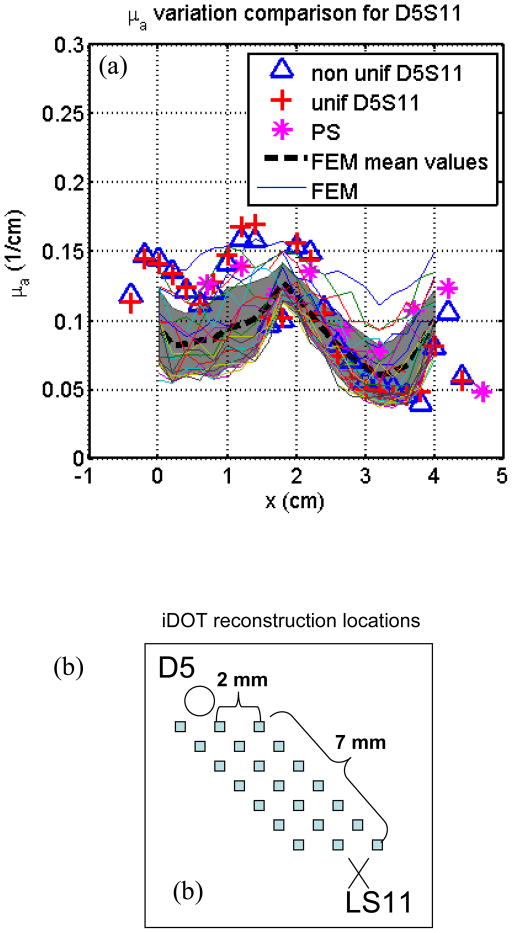
In Fig. 10, fitting results from detector 5 and S11 are compared with optical properties reconstructed by solving the inverse problem of the diffusion equation directly using CDF (Wang and Zhu, 2009) based on the finite element method (FEM) to solve Eq. 1. A modified version of the NIRFAST user code (Dehghani et al., 2008) was used to perform the reconstruction, in which forward calculations were performed to generate light fluence rate and Jacobian matrices were calculated to iteratively find the reconstructed optical properties. In this reconstruction, light fluence measurement results for all detectors adjacent to the CDFs are used (see Fig. 3a), and 2355 node points were modeled to generate the mesh. For each CDF, 21 data points were used for each detector, and a total number of 72 source-detector pairs were used in the reconstruction. As seen in Fig. 10(b), the FEM-reconstructed optical properties are plotted from 21 points in the region between detector 5 and S11, so that they can be compared with the fitting results, which also represent the optical properties in the whole region between the S11 and detector 5. In this region, there are at least 1×1×15 unknown nodes used in the reconstruction. As seen in Fig. 10(a), the FEM-reconstructed μa values have similar trend (represented by their mean values and standard deviations) along the z direction. However, in the FEM reconstruction method, the μs′ is not constrained to be homogeneous, which may cause some differences compared to the fitting results. The agreement in μa between that using CDF method vs. directly solving the inverse FEM gives us confidence in the proposed method to determine the tissue optical properties using CDF intended for interstitial treatment.
Figure 10.
Comparison with FEM reconstruction results from source 5 and detector 11. (a) FEM-reconstructed μa at different locations compared with the results by the fitting methods. Shadowing area represents mean μa values and their standard deviations along z direction. (b) The locations where the optical properties were reconstructed by FEM.
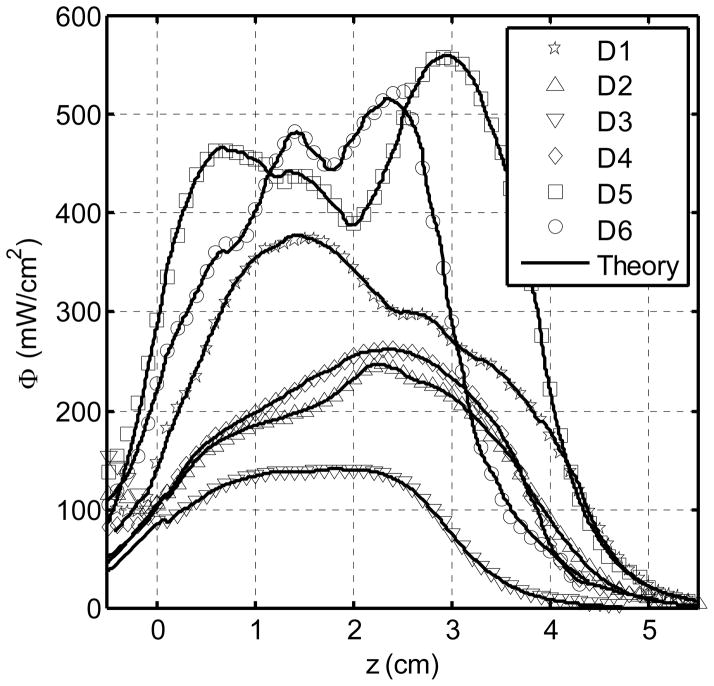
One of the major advantage of using the CDF intended for prostate PDT treatment directly to extrapolate optical properties is that the clinically relevant light fluence rate distribution in each detector channel is used to determine the optical properties. This fluence rate distribution can therefore be exactly reproduced, even if there are errors in positioning of the CDF, nonuniform source strength distributions of CDF, or approximations made in the computational model, as long as the forward calculation geometry and computational model are the same as those used to determine optical properties. Figure 11 shows excellent agreement between the measured and calculated light fluence rate profile for each detector location (D1 – D6) during PDT treatment. As a result, we expect a dramatic improvement in the accuracy of the forward calculation of the light fluence rate distribution during PDT, making it possible to reducing the errors of light fluence rate calculation to within ±5% in a heterogeneous prostate gland.
Figure 11.
Results of measured (symbols) and calculated (lines) light fluence rate at each detector locations (D1 – D6) according to Fig. 3 during PDT treatment. Each plot is the sum of the light fluence accumulated from the four adjacent channels. Each of the 12 CDFs has a uniform source strength of 100 mW/cm.
5. CONCLUSIONS
We showed that it is possible to accurately determine the absorption coefficient in homogeneous turbid media using CDFs with standard(maximum) deviations of 7% (23%) assuming uniform source strength distribution. This accuracy is not remarkable by the standards of optical dosimetry or optical tissue diagnosis. Nonetheless, it represents a significant advance for the particular case where interstitial optical property measurement is used as part of the dosimetry calculation for light-based therapy such as PDT. In these cases, the ability to determine optical properties and detect optical inhomogeneities using the sources used for treatment light delivery has several distinct advantages. First, the fact that the treatment delivery sources are used for optical property determination ensures that any calculations of treatment fluence rate based on these optical properties will be correct, at least in the region where the measurements were made, as this is the definition of a good fit. The result is that the uncertainty in the calculations based on these optical properties may actually be lower than the uncertainties in the optical properties themselves. Second, these measurements can be made immediately before the onset of treatment irradiation, without the need to reposition or replace optical fibers, and can easily be repeated during the treatment as a means of monitoring treatment-induced optical property changes. This reduces concern about differences in positioning between measurement and treatment, and reduces the time that optical property characterization adds to treatment. Finally, the use of a single set of sources and detectors for optical characterization, dosimetry, and treatment will allow the development of integrated, computer-controlled systems for PDT delivery. This is an important direction in the future development of clinical PDT, and has been an ongoing effort in our laboratory (Zhu and Finlay, 2006).
Acknowledgments
Work supported by NIH grants R01 CA109456 and P01 CA87971.
References
- Arnfield MR, Chapman JD, Tulip J, Fenning MC, McPhee MS. Optical properties of experimental prostate tumors in vivo. Photochem Photobiol. 1993;57:306–11. doi: 10.1111/j.1751-1097.1993.tb02292.x. [DOI] [PubMed] [Google Scholar]
- Baas P, Murrer L, Zoetmulder FAN. Photodynamic therapy as adjuvant therapy in surgically treated pleural malignancies. Br J Cancer. 1997;76:819–26. doi: 10.1038/bjc.1997.468. [DOI] [PMC free article] [PubMed] [Google Scholar]
- Bays R, Wagnieres G, Robert D, Theumann JF, Vitkin A, Savary JF, Monnier P, van den Bergh H. Three-dimensional optical phantom and its application in photodynamic therapy. Lasers Surg Med. 1997;21:227–34. doi: 10.1002/(sici)1096-9101(1997)21:3<227::aid-lsm2>3.0.co;2-s. [DOI] [PubMed] [Google Scholar]
- Beck GC, Akgün N, Rück A, Steiner R. Design and characterisation of a tissue phantom system for optical diagnostics. Laser Med Sci. 1998;13:160–71. [Google Scholar]
- Chen Q, Hetzel FW. Laser dosimetry studies in the prostate. J Clin Laser Med Surg. 1998;16:9–12. doi: 10.1089/clm.1998.16.9. [DOI] [PubMed] [Google Scholar]
- Chen Q, Wilson BC, Shetty SD, Patterson MS, Cerny JC, Hetzel FW. Changes in in vivo optical properties and light distributions in normal canine prostate during photodynamic therapy. Radiat Res. 1997;147:86–91. doi: 10.2307/3579447. [DOI] [PubMed] [Google Scholar]
- D’Amico AV, Coleman CN. Role of interstitial radiotherapy in the management of clinically organ-confined prostate cancer: the jury is still out. J Clin Oncol. 1996;14:304–15. doi: 10.1200/JCO.1996.14.1.304. [DOI] [PubMed] [Google Scholar]
- Dehghani H, Eames ME, Yalavarthy PK, Davis SC, Srinivasan S, Carpenter CM, Pogue BW, Paulsen KD. Near infrared optical tomography using NIRFAST: Algorithm for numerical model and image reconstruction. Commun Numer Meth Eng. 2008;25:711–32. doi: 10.1002/cnm.1162. [DOI] [PMC free article] [PubMed] [Google Scholar]
- Dimofte A, Finlay JC, Zhu TC. A method for determination of the absorption and scattering properties interstitially in turbid media. Phys Med Biol. 2005;50:2291–311. doi: 10.1088/0031-9155/50/10/008. [DOI] [PMC free article] [PubMed] [Google Scholar]
- Dougherty TJ, Gomer CJ, Henderson BW, Jori G, Kessel D, Korbelik M, Moan J, Peng Q. Photodynamic Therapy. J Natl Cancer Inst. 1998;90:889–905. doi: 10.1093/jnci/90.12.889. [DOI] [PMC free article] [PubMed] [Google Scholar]
- Essenpreis M. PhD Thesis. London: University College London; 1992. Thermally induced changes in optical properties of biological tissues. [Google Scholar]
- Jemal ABF, Center MM, Ferlay J, Ward E, Forman D. Global cancer statistics. CA Cancer J Clin. 2011;61:69–90. doi: 10.3322/caac.20107. [DOI] [PubMed] [Google Scholar]
- Lee LK, Whitehurst C, Chen Q, Pantelides ML, Hetzel FW, Moore JV. Interstitial photodynamic therapy in the canine prostate. Br J Urol. 1997;80:898–902. doi: 10.1046/j.1464-410x.1997.00460.x. [DOI] [PubMed] [Google Scholar]
- Lee LK, Whitehurst C, Pantelides ML, Moore JV. In situ comparison of 665 nm and 633 nm wavelength light penetration in the human prostate gland. Photochem Photobiol. 1995;62:882–6. doi: 10.1111/j.1751-1097.1995.tb09151.x. [DOI] [PubMed] [Google Scholar]
- Lee LK, Whitehurst C, Pantelides ML, Moore JV. An interstitial light assembly for photodynamic therapy in prostatic carcinoma. BJU Int. 1999;84:821–6. doi: 10.1046/j.1464-410x.1999.00314.x. [DOI] [PubMed] [Google Scholar]
- Li J, Zhu TC. Determination of in vivo light fluence distribution in a heterogeneous prostate during photodynamic therapy. Phys Med Biol. 2008;53:2103–14. doi: 10.1088/0031-9155/53/8/007. [DOI] [PMC free article] [PubMed] [Google Scholar]
- Madsen S. The use of India ink as an optical absorber in tissue-simulating phantoms. Phys Med Biol. 1992;37:985–93. doi: 10.1088/0031-9155/37/4/012. [DOI] [PubMed] [Google Scholar]
- Marijnissen JP, Star WM. Calibration of isotropic light dosimetry probes based on scattering bulbs in clear media. Phys Med Biol. 1996;41:1191–208. doi: 10.1088/0031-9155/41/7/008. [DOI] [PubMed] [Google Scholar]
- Nathan TR, Whitelaw DE, Chang SC, Lees WR, Ripley PM, Payne H, Jones L, Parkinson MC, Emberon M, Gillams AR, Mundy AR, Bown SG. Photodynamic therapy for prpstate cancer recurrence after radiotherapy: A phase I study. J Urol. 2002;168:1427–32. doi: 10.1016/S0022-5347(05)64466-7. [DOI] [PubMed] [Google Scholar]
- Pantelides ML, Whitehurst C, Moore JV, King TA, Blacklock NJ. Photodynamic therapy for localised prostatic cancer: light penetration in the human prostate gland. J Urol. 1990;143:398–401. doi: 10.1016/s0022-5347(17)39973-1. [DOI] [PubMed] [Google Scholar]
- Patel H, Mick R, Finlay J, Zhu TC, Rickter E, Cengel KA, Malkowicz SB, Hahn SM, Busch TM. Motexafin lutetium-photodynamic therapy of prostate cancer: short- and long-term effects on prostate-specific antigen. Clin Cancer Res. 2008;14:4869–76. doi: 10.1158/1078-0432.CCR-08-0317. [DOI] [PMC free article] [PubMed] [Google Scholar]
- Solonenko M, Zhu TC, Vulcan T. Commissioning of the isotropic light dosimetry system for photodynamic therapy. Med Phys. 1999;26:1124. [Google Scholar]
- Star WM. Light dosimetry in vivo. Phys Med Biol. 1997;42:763–87. doi: 10.1088/0031-9155/42/5/003. [DOI] [PubMed] [Google Scholar]
- Star WM, Marijnissen JP, Avan Gemert MJC. Light dosimetry in optical phantoms and in tissues: I. Multiple flux and transport theory. Phys Med Biol. 1988;33:437–54. doi: 10.1088/0031-9155/33/4/004. [DOI] [PubMed] [Google Scholar]
- Stripp D, Mick R, Zhu TC, Whittington R, Smith D, Dimofte A, Finlay JC, Miles J, Busch T, Shin DAK, Tochner Z, Malkowicz SB, Glatstein E, Hahn SM. Phase I trial of motexafin-lutetium-mediated interstitial photodynamic therapy in patients with locally reccurent prostate cancer. Proc SPIE. 2004;5315:88–99. doi: 10.1615/jenvironpatholtoxicoloncol.v25.i1-2.230. [DOI] [PubMed] [Google Scholar]
- Trachtenberg J, Bogaards A, Weersink RA, Haider MA, Evans A, McCluskey SA, Scherz A, Gertner MR, Yue C, Appu S, Aprikian A, Savard J, Wilson BC, Elhilali M. Vascular targetd photodynamic therapy with palladium-bacteriopheophorbide photosensitizer for recurrent prostate cancer following definitive radiation therapy: assessment of safety and treatment response. J Urol. 2007;178:1974–9. doi: 10.1016/j.juro.2007.07.036. [DOI] [PubMed] [Google Scholar]
- Trachtenberg J, Weersink RA, Davidson SR, Haider MA, Bogaards A, Gertner MR, Evans A, Scherz A, Savard J, Chin JL, Wilson BC, Elhilali M. Vascular-targeted photodynamic therapy (padoporfin, WST09) for recurrent prostate cancer after failure of external beam radiotherapy: a study of escalating light doses. BJU Int. 2008;102:556–62. doi: 10.1111/j.1464-410X.2008.07753.x. [DOI] [PubMed] [Google Scholar]
- Verigos K, Stripp DC, Mick R, Zhu TC, Whittington R, Smith D, Dimofte A, Finlay J, Busch TM, Tochner ZA, Malkowicz S, Glatstein E, Hahn SM. Updated results of a phase I trial of motexafin lutetium-mediated interstitial photodynamic therapy in patients with locally recurrent prostate cancer. J Environ Pathol Toxicol Oncol. 2006;25:373–88. doi: 10.1615/jenvironpatholtoxicoloncol.v25.i1-2.230. [DOI] [PubMed] [Google Scholar]
- Wang KK, Zhu TC. Reconstruction of in-vivo optical properties for human prostate using interstitial diffuse optical tomography. Opt Express. 2009;7:11665–72. doi: 10.1364/oe.17.011665. [DOI] [PMC free article] [PubMed] [Google Scholar]
- Weersink RA, Bogaards A, Gertner M, Davidson SR, Zhang K, Netchev G, Trachtenberg J, Wilson BC. Techniques for delivery and monitoring of TOOKAD (WST09)-mediated photodynamic therapy of the prostate: clinical experience and practicalities. J Photochem Photobiol B. 2005a;79:211–22. doi: 10.1016/j.jphotobiol.2005.01.008. [DOI] [PubMed] [Google Scholar]
- Weersink RA, Forbes J, Bisland S, Trachtenberg J, Elhilali M, Brun PH, Wilson BC. Assessment of cutaneous photosensitivity of TOOKAD (WST09) in preclinical animal models and in patients. Photochem Photobiol. 2005b;81:106–13. doi: 10.1562/2004-05-31-RA-182. [DOI] [PubMed] [Google Scholar]
- Whitehurst C, Pantelides ML, Moore JV, Brooman PJ, Blacklock NJ. In vivo laser light distribution in human prostatic carcinoma. J Urol. 1994;151:1411–5. doi: 10.1016/s0022-5347(17)35270-9. [DOI] [PubMed] [Google Scholar]
- Zaak D, Sroka R, Stocker S, Bise K, Lein M, Hoppner M, Frimberger D, Schneede P, Reich O, Kriegmair M, Knuchel R, Baumgartner R, Hofstetter A. Photodynamic therapy of prostate cancer by means of 5-aminolevulinic acid-induced protoporphyrin IX - in vivo experiments on the dunning rat tumor model. Urol Int. 2004;72:196–202. doi: 10.1159/000077114. [DOI] [PubMed] [Google Scholar]
- Zhu TC, Dimofte A, Finlay JC, Glatstein E, Hahn SM. Detector calibration factor for interstitial in vivo light dosimetry using isotropic detectors with scattering tip. Proc SPIE. 2005a;5689:174–85. doi: 10.1117/12.590330. [DOI] [PMC free article] [PubMed] [Google Scholar]
- Zhu TC, Dimofte A, Finlay JC, Stripp D, Busch T, Miles J, Whittington R, Malkowicz SB, Tochner Z, Glatstein E, Hahn SM. Optical properties of human prostate at 732 nm measured in vivo during Motexafin Lutetium mediated photodynamic therapy. Photochem Photobiol. 2005b;81:96–105. doi: 10.1562/2004-06-25-RA-216. [DOI] [PMC free article] [PubMed] [Google Scholar]
- Zhu TC, Finlay JC. Prostate PDT dosimetry. Photodiag photodyn ther. 2006;3:234–46. doi: 10.1016/j.pdpdt.2006.08.002. [DOI] [PMC free article] [PubMed] [Google Scholar]
- Zhu TC, Finlay JC, Hahn SM. Determination of the distribution of light, optical properties, drug concentration, and tissue oxygenation in-vivo in human prostate during motexafin lutetium-mediated photodynamic therapy. J Photochem Photobiol B. 2005c;79:231–41. doi: 10.1016/j.jphotobiol.2004.09.013. [DOI] [PMC free article] [PubMed] [Google Scholar]
- Zhu TC, Hahn SM, Kapatkin AS, Dimofte A, Rodriguez CE, Vulcan TG, Glatstein E, Hsi RA. In vivo optical properties of normal canine prostate at 732 nm using motexafin lutetium-mediated photodynamic therapy. Photochem Photobiol. 2003;77:81–8. doi: 10.1562/0031-8655(2003)077<0081:ivopon>2.0.co;2. [DOI] [PubMed] [Google Scholar]


