Abstract
The long-term performance of tissue-engineered bone grafts is determined by a dynamic balance between bone regeneration and resorption. We proposed using embedded cytokine slow-releasing hydrogels to tune this balance toward a desirable final bone density. In this study we established a systems biology model, and quantitatively explored the combinatorial effects of delivered cytokines from hydrogels on final bone density. We hypothesized that: 1) bone regeneration was driven by transcription factors Runx2 and Osterix, which responded to released cytokines, such as Wnt, BMP2, and TGFβ, drove the development of osteoblast lineage, and contributed to bone mass generation; and 2) the osteoclast lineage, on the other hand, governed the bone resorption, and communications between these two lineages determined the dynamics of bone remodeling. In our model, Intracellular signaling pathways were represented by ordinary differential equations, while the intercellular communications and cellular population dynamics were modeled by stochastic differential equations. Effects of synergistic cytokine combinations were evaluated by Loewe index and Bliss index. Simulation results revealed that the Wnt/BMP2 combinations released from hydrogels showed best control of bone regeneration and synergistic effects, and suggested optimal dose ratios of given cytokine combinations released from hydrogels to most efficiently control the long-term bone remodeling. We revealed the characteristics of cytokine combinations of Wnt/BMP2 which could be used to guide the design of in vivo bone scaffolds and the clinical treatment of some diseases such as osteoporosis.
Keywords: Bone tissue engineering, Bone remodeling, Cytokine combination therapy, Systems biology, Osteogenic differentiation, Signaling pathway
1. Introduction
Bone remodeling in tissue engineering is a long-term physiological process that dynamically balances osteogenesis and bone resorption and re-distributes bone mass to match the external mechanical changes [1-3]. This complex biological event involves intracellular signaling, stem cell driven lineage developing, and intercellular communications among various cellular phenotypes. A variety of systematic and local factors play important roles in such multi-scale signaling [4]. Bone remodeling is especially critical to the success of tissue-engineered bone grafts. Failure to accumulate bone mass according to the physiological needs of mechanical strength will cause post-implantation bone fractures and poor outcomes. Personalized tuning of bone remodeling process is another challenge. For example, osteoporosis patients are often victims of bone fractures, and in their bone scaffolds the osteogenesis should be enhanced to overcome the patient hormone and cytokine environments that promote bone resorption. A flexible and tunable infrastructure which allows fine tuning of the bone remodeling process is required to meet the clinical needs.
This challenge can be potentially addressed by cytokine combination therapy which encapsulates multiple cytokines (or growth factors) into polymer nanospheres, expected to produce a better effect than the single factor. Recently our group [5-8] and others [9-11] have shown the capabilities of accurately and independently controlling drug release rates of individual growth factors and cytokines from the delayed slow-release hydrogels embedded in artificial bone scaffolds. Hydrogels are highly absorbent natural (e.g. hyaluronic acid) or synthetic polymers (e.g. polyvinyl alcohol, sodium polyacrylate, and acrylate polymers) that may possess a degree of flexibility very similar to normal tissue because of their considerable water. When used as scaffolds for bone tissue regeneration, hydrogels often contain human primary cells (e.g. osteocytes and endothelial cells) and growth factors or cytokines to repair bone tissue. Cytokines (e.g. BMP2, TGFβ and Wnt ligands) play an important role in osteogenic differentiation of MSC and bone remolding. Ideally key cytokines can be programmatically released into the micro-environments of the bone graft and guide desired bone remodeling [12, 13]. This study addresses the effects of optimally-combined cytokines after released from hydrogels on bone regeneration.
Osteoblast and osteoclast lineages are responsible for two competing but coordinated processes, bone formation and resorption, respectively, and thus profile the dynamic of bone remodeling. These two processes occur in a structure called basic multi-cellular units (BMU) [14] at multiple sites in the skeleton as well as artificial scaffolds [1]. Bone marrow mesenchymal stem cells (MSC) differentiate to pre-osteoblast, then osteogenic lineages, which are responsible for bone formation; while hematopoietic stem cells (HSC) differentiate to the pre-osteoclasts, and then osteoclasts, which govern bone resorption.
A number of mathematical models have been developed to describe the bone remodeling in recent years. Komarova et al. [15] constructed a mathematical model to calculate cell population dynamics and changes in bone mass at a discrete site of bone remodeling, considering the autocrine and paracrine interactions among osteoblasts and osteoclasts. Lemaire et al. [16] proposed another cell population model to explain the interactions between osteoblasts and osteoclasts by estabishing the intercellular signaling pathway RANK-RANKL-OPG. Then Pivonka et al. [17] extended this pathway to study and theoretically explore the functional implications of particular RANK/OPG expression profiles on bone mass. Furthermore, Pivonka et al. [17, 18] used such models to investigate the possible therapeutic intervention to restore bone mass due to the imbalance of RANK-RANKL-OPG regulation [18].
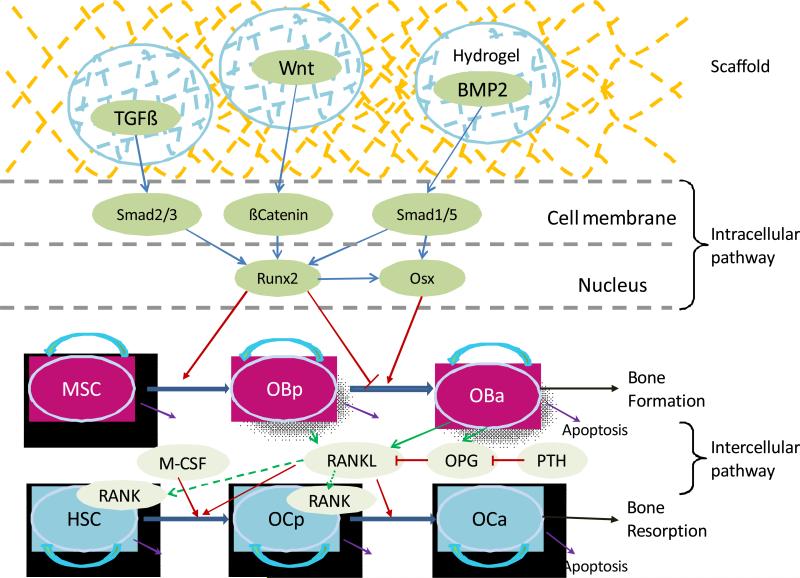
However, previous studies have often lacked an intracellular signaling and fell short on representing the intracellular molecular mechanism. Several molecular signals and mechanisms involved in the bone healing or remodeling have been revealed from in vitro and/or in vivo experiments. The osteoblast commitment, differentiation and functions are controlled by several transcription factors resulting in the expression of genes responsible for the osteoblastic lineage from MSC to pre-osteoblasts and then to active osteoblasts [19], as described in Fig. 1. Runt-related transcription factor 2 (Runx2) and Osterix (Osx) have been generally demonstrated to be two crucial transcription factors in osteogenic differentiation [19]. Various cytokines, such as BMP2, TGFβ and Wnt ligands, can stimulate the expression of Runx2 and Osx through a variety of pathways [19-22]. After the pathway is activated, Runx2 and Osx play different particular roles in different stages of osteoblastic lineage. Both Runx2 and Osx can promote the differentiation of MSC into pre-osteoblasts [19, 23], whereas Runx2 can inhibit the differentiation of pre-osteoblasts into active osteoclasts [19, 24].
Fig. 1. Schematic illustration of intracellular and intercellular signaling and cellular dynamics in bone healing and bone remodeling.
Bone regeneration or bone remodeling involves bone resorption by osteoclasts (OC) and the following bone formation by osteoblasts (OB) within basic multicellular units (BMU). Three cytokines were considered: TGFβ, Wnt and BMP2. Intracellular signaling pathway consists of Smad2/3, Smad 1/5, βCatenin, and Runx2 and Osx. Runx2 can promote the differentiation of mesenchymal stem cells (MSCs) into pre-osteoblasts (OBp) and can inhibit the differentiation of pre-osteoblasts into active osteoblasts (OBa). Osx also play a promoting role in the later stage of osteoblastic lineage which interacts with osteoclastic lineage through intercellular signaling pathway RANK-RANKL OPG.
Moreover, only a few mathematical models have been developed to investigate the effect of cytokine therapy, especially cytokine combination therapy, for bone healing. Particularly, we are concerned with the following questions in the bone healing therapy. First, are the effects of cytokine combination better than those of single cytokine? Second, how do we evaluate the synergism of the cytokine combination therapies? Third, what are the most efficient dose and ratio of specific cytokine combination to achieve expected bone remodeling goals? To answer these questions, numerous candidate conditions should be examined for this complex system of multiple cell type, various cytokine candidates, and multiple time scales. Traditional biological experiments are expensive and time-consuming. Therefore, a systems biological model is required to best utilize our current knowledge of the bone remodeling process to explore in silico candidate conditions, screen out critical factors and key cytokines of the system, and guide the biological experiments.
This work was designed to build up a computational systematic model to study the combination effects of cytokines released from hydrogels including Wnt, BMP2, and TGFβ for controlling the balance of bone formation and resorption of implanted bone scaffolds based on the intracellular signaling pathway. We firstly developed a systematic model composed of a system of ordinary differential equations (ODEs) to describe the intracellular signaling pathway to regulate osteogenic differentiation. And then, we combined the intracellular signaling pathway with intercellular signaling pathway to control osteoclast differentiation. Next, we integrated the intracellular and intercellular signaling pathways into the cellular population dynamics described by a set of stochastic differential equations (SDEs) to simulate bone healing and remodeling. The unknown coefficients in the intracellular signaling pathway were estimated by fitting them to the dynamic experimental data [21, 25, 26] using optimization algorithm. Finally, we investigated the response of cellular population dynamics to therapies of single or combined cytokines as well as quantitatively evaluated the combination effect of cytokines by Loewe and Bliss indexes.
2. Methods
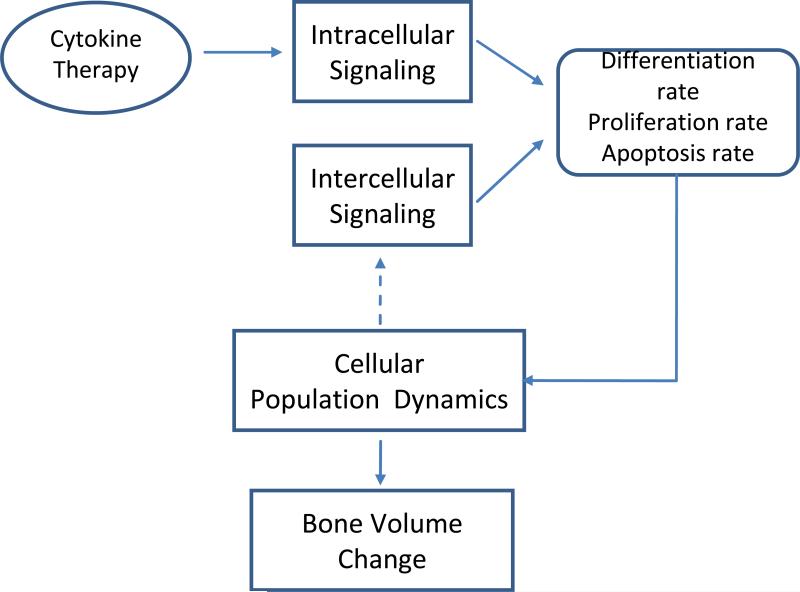
As shown in Fig. 2, our model encompasses four relevant biological scales: intracellular, intercellular, cellular and bone tissue scales. We are going to introduce the details of the four scales in the followings.
Fig. 2. Multi-scale model for bone regeneration or bone remodeling system.
Our systematic model encompasses four relevant biological scales: intracellular, intercellular, cellular and bone tissue scales. See details of the modeling in main text.
2.1. Intracellular signaling pathway construction
Runt-related transcription factor 2 (Runx2) and Osterix (Osx) have been found as two crucial transcription factors in osteoblast differentiation [19]. Wnt signaling directly regulates the expression of Runx2 through β-Catenin [19, 27]. BMP2 and TGFβ can activate or phosphorylate smad1/5 and Smad2/3 respectively [20, 21]. These Smads can interact with co-Smad (Smad4) or other transcription factors to stimulate the expression of Runx2 [19, 20]. Runx2, as well as Smad1/5 activated by BMP2, can stimulate the expression of downstream Osx [19, 22].
We used a system of ODEs to describe the time dynamics of concentration for each component in intracellular pathway (Fig. 1) by Michealis-Menten Law [28]. Hill function [28, 29] was employed to model the regulatory relationship between the proteins and/or transcription factors.
Smad1/5 can be phosphorylated by BMP2 [20]. The concentration change of phosphorylated Smad1/5 ([S1]) depends on the concentration of BMP2 ([BMP2]), unphosphorylated Smad1/5 ([TotalS1]-[S1]), and dephosphorylation of itself. Equation (1) describes the phosphorylation and dephosphorylation of Smad1/5.
| (1) |
Smad2/3 can be phosphorylated by TGFβ [26]. The change of the concentration of phosphorylated Smad2/3 ([S2]) depends on the concentration of TGFβ ([TGFβ]), unphosphorylated Smad2/3 ([TotalS2]-[S2]), and dephosphorylation of itself. Equation (2) describes the phosphorylation and dephosphorylation of Smad2/3.
| (2) |
β-Catenin is one of the key proteins in Wnt signaling pathway [23, 27], the change of the concentration of β-Catenin have been modeled by equation (3) [30, 31].
| (3) |
Runx2 has been found to be a crucial transcription factor in osteogenic differentiation [19, 23]. Its expression and activation can be promoted by BMP2 through Smad1/5, and also by TGFβ through Smad2/3, and by Wnt-ligands through β-Catenin and other proteins [27]. Equation (4) describes the expression and degradation of Runx2.
| (4) |
Osx is also a critical transcription factor in osteoblast differentiation, acting as downstream of Runx2 and Smad1/5. Equation (5) describes the expression and degradation of Osx.
| (5) |
2.2. Intercellular signaling pathway
The intercellular signaling pathway in bone remodeling, known as RANK-RANKL-OPG system, is important in cell-cell communication, which can explain how the osteoblast lineage regulates the osteoclast differentiation and activation [32]. Because RANK-RANKL-OPG pathway has been well investigated by previous studies [17, 18], here we just listed the detailed equations describing the intercellular pathway in the supplementary files (Text S2).
2.3. Integrating the intracellular and intercellular signaling pathways into cellular population dynamics
We assumed that the binding and/or dissociation reactions in intracellular signaling pathway are much faster than both cellular phenotypic switches and cellular population changes [17, 33], so we derived the quasi-steady state of intracellular signaling pathway (as listed in Text S1) and then we integrated it into cellular population dynamics. As described in Fig. 1, the differentiation of MSC into pre-osteoblasts is promoted by Runx2 and Osx [19, 23]. This regulation was described by equation (6).
| (6.1) |
| (6.2) |
| (6.3) |
where DMSC is the differentiation rate of mesenchymal stem cells; KD1,Runx2 and KD1,Osx are regulation coefficients regarding Runx and Osx; VD1,Runx2 and VD1,Osx are Hill regulatory factors.
The differentiation of pre-osteoblasts into active osteoblasts is inhibited by Runx2 and promoted by Osx [19, 24] as equation (7).
| (7.1) |
| (7.2) |
| (7.3) |
where DOBp is the differentiation rate of pre-osteoclasts; KD2,Runx2 and KD2,Osx are regulation coefficients regarding Runx2 and Osx; VD2,Osx are Hill regulatory factors.
Differentiation and activation of hematopoietic stem cells into pre-osteoclasts, as well as differentiation of pre-osteoclasts into active osteoblasts, requires the binding of RANKL released by osteoblasts to RANK on the surface of osteoclasts, which is inhibited by OPG that can bind to RANKL. The intercellular pathway can be incorporated into cellular population dynamics with equation (8) [17, 18].
| (8.1) |
| (8.2) |
| (8.3) |
where DHSC is the differentiation rate of hematopoietic stem cells; DOCp is the differentiation rate of pre-osteoclasts; KD3,RANKL is the regulation coefficient regarding RANKL; and are illustrated in Table S2.
2.4. Cellular population dynamics
As described in Fig. 1, our model considered 6 types of bone cells in 2 lineages. The osteoblastic lineage consists of MSC, pre-osteoblasts and active osteoblast. And osteoclastic lineage is comprised of HSC, pre-osteoclasts and active osteoclasts cell types. Since MSC and HSC outnumber other cell types [17], this model sets the numbers of these two cell types as constant (nMSC, nHSC).
We employed a set of stochastic differential equations (SDEs) [34] to model the cellular population dynamics during bone remodeling or bone healing as follows.
| (9) |
| (10) |
| (11) |
| (12) |
Where XOBp, XOBa, XOCp and XOCa are random variables representing the concentration of pre-osteoblasts, active osteoblasts, pre-osteoclasts and active osteoclasts, respectively. Wi(i = 1,2,3,4) is Wiener process or also called standard Brownian motion to simulate local diffusion of cell population, i.e. migration and/or immigration in a basic multi-cellular unit as well as the stochastic regulation of signaling pathway. σi(i = 1,2,3,4) represents diffusion coefficient. D̃MSC, D̃OBp, D̃HSC, and D̃OCp stand for differentiation rates of MSC, pre-osteoblasts, HSC, and pre-osteoclasts, respectively. POBp, POBa, POCp, and POCa are proliferation rates ( or self are renew rates) of corresponding cell types. dOBp, dOBa, dOCp, and dOCa are apoptosis rates of considered cell types, respectively.
Bone mass change is determined by bone formation due to osteoblasts and bone resorption due to osteoclasts. We assumed that bone deposition and bone resorption rate is proportional to the number of active osteoblasts and active osteoclasts respectively [17, 18], so the change rate of bone mass is proportional positively to the number of active osteolasts and negatively proportional to the number of active osteoclasts, which can be described by equation (13).
| (13) |
where M represents the bone mass normalized to the initial value. kform and krep are bone formation and resorption rates respectively. The bone mass change is chosen as an output in our systematic model.
Most of above parameters of cellular population dynamics were well studied by previous researches [17, 18], and listed in Table S2. The unknown parameters were computed and assumed to ensure the requirement of stability of the system in the normal steady state [18], please refer to Text S3.
The system of nonlinear ODEs was numerically solved using implicit Euler method [35], the stochastic differential equations were solved by Euler-Maruyama method [36]. The program was performed in MATLAB R2007b (MathWorks).
3. Results
This study developed a systematic model for bone regeneration and bone remodeling based on the intracellular signaling pathway of osteogenic differentiation. We firstly developed the intracellular signaling pathway and estimated its unknown coefficients. Secondly, we investigated the responses of cellular population to therapies of single cytokine or combined cytokines released from hydrogels. Finally, we quantitatively evaluated the combination effect of cytokines by applying Loewe and Bliss indexes [26, 27].
3.1. Intracellular pathway parameter estimation
After described the intracellular signaling pathway by a mathematical model, we have to estimate the unknown coefficients of the model. There are totally 18 unknown coefficients in equation (1), (2), (4) and (5). The coefficients of equation (3) has been validated by previous study [30]. Among these 18 unknown coefficients, V1, V2, V4, V5, V6, V7 and V8 are maximum activation velocities of corresponding reactions; K1, K2, K4, K5, K6, K7 and K8 are Michealis-Menten constants; d1, d2, d4 and d5 are degradation rates of Smad1/5, Smad2/3, Runx2 and Osx, respectively.
We did parameter fitting regarding the dynamic experimental data [21, 25, 26] by genetic algorithm [37]. Our experimental data [21, 25, 26] consist of 4 sets of data with 24 different time points, which are listed in Fig. S1. Equation (14) was employed for parameter estimation by minimizing the fitness error between the experimental and simulated data,
| (14) |
where ytisim(θ) and ytiexp(θ) represent the simulated and experimental data with time point t and θ, respectively. Θ stands for the parameter space, in which the search space for each parameter was preset in a range according to previous studies [21, 25, 26] along with Michealis-Menten kinetics. Genetic algorithm [37] was adopted to minimize the cost function in equation (14).
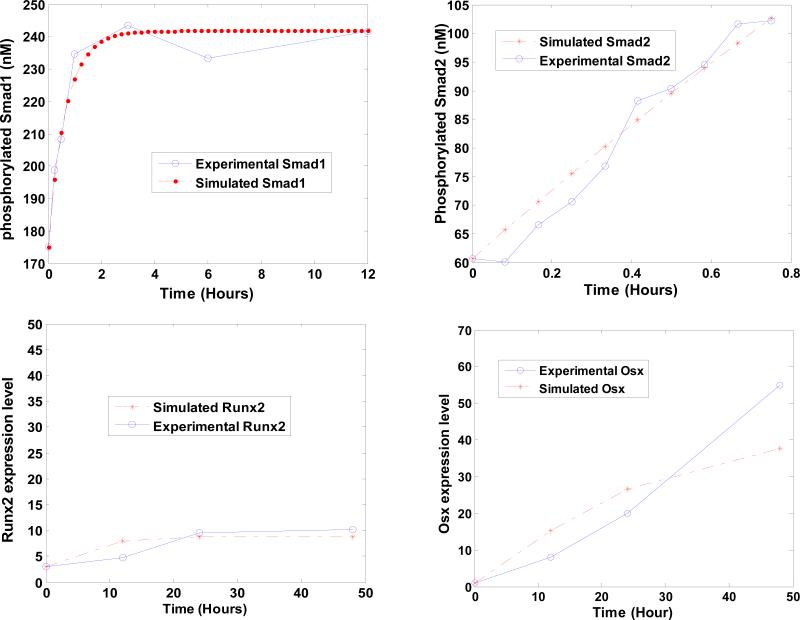
Fig. 3 shows that simulated dynamic data fit well to the dynamic experimental data as previously reported [21, 25, 26]. The mean squared error between the simulated data and experimental data is 0.2553. The speed of the whole estimation algorithm is comparably fast and the total programming running time in the parameter estimation is 16.95 minutes.
Fig. 3. Fitness results between the simulated dynamic data and the experimental data.
X axis represents time. Y axis represents the concentrations of (a) phosphorylated Smad1/5, (b) phosphorylated Smad2/3, and the expression levels of (c) Runx2 and (d) Osx, respectively.
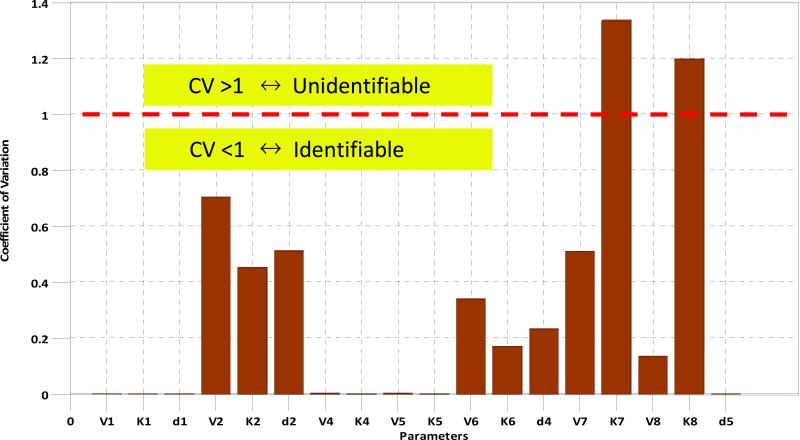
The coefficient of variation is used to determine if the parameter is identifiable or not. Coefficient of variation is defined as the ratio of the standard deviation to the mean of the estimated values. For a given parameter, if its coefficient of variation is greater than 1, then it is unidentifiable; otherwise it is identifiable. To compute the coefficient of variation for each unknown parameters, we applied bootstrap strategy [38] to re-sample 24 experimental time-point data 24 times by “leave one out” technique [39]. After that, we can have 24 sets of experimental data and calculate the coefficient of variation for each parameter. Fig. 4 shows that only the coefficients of variation of V7 and K7 are greater than 1, indicating that only 11.11% of parameters are unidentifiable whereas 88.89% of parameters are identifiable.
Fig. 4. Coefficient of variation of parameters.
Only the coefficients of variation of V7 and K7 are larger than 1, indicating that only 11.11% of parameters are unidentifiable and other 88.89% of parameters are identifiable.
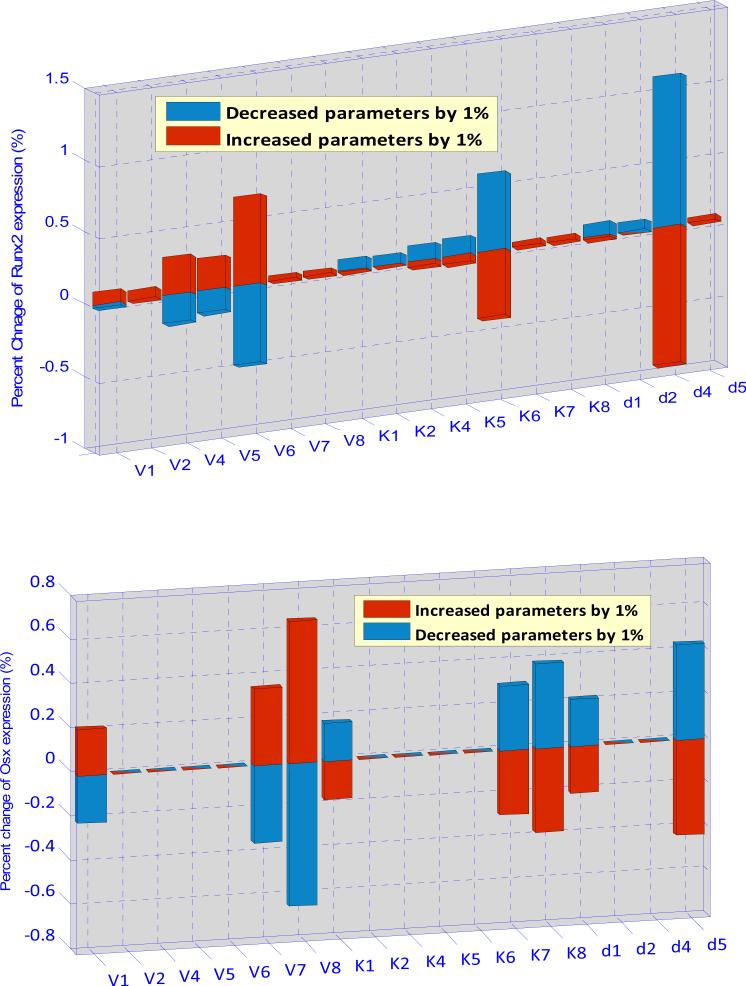
Parameter sensitivity analysis is a tool to examine whether the system is preserved to the modest parameter changes and quantitatively explore the sensitive parameters. In this work, local parameter sensitivity analysis was employed to study the relationship between the expression of Runx2 (and Osx) and the variations for each parameter value. The sensitivity coefficient (S) was calculated according to the following formula:
| (15) |
where Pi is one of the 18 estimated parameters and ΔPi is a small change of the corresponding parameter. Each parameter was increased (or decreased) by 1% from its estimated value, and then we can obtain the percentage changes of the concentrations of Runx2 and Osx, respectively. Fig. 5 shows that the expression of Runx2 is sensitive to V6, K6 and d4 and the expression of Osx is sensitive to V1, V7, V8, K1, K7, K8, d1 and d8. However, the maximum sensitivity of parameter for the expression of Runx2 and Osx is 1.2% and 0.7%, respectively. Our sensitive analysis (Fig. 5) turns out that our intracellular pathway system is rather robust.
Fig. 5. Parameter sensitivity analysis of the intracellular pathway model.
Above subfigure shows that the expression of Runx2 is more sensitivity to V6, K6 and d4. Below subfigure shows that the expression of Osx is more sensitivity to V8, K8 and d8, as well as to V1, K1, d1 and V7, K7. These results show us which kinetic parameters and molecules are more important in the system and also demonstrate that the developed intracellular pathway system is robust.
3.2. The response of Cellular population dynamics to the cytokine therapies
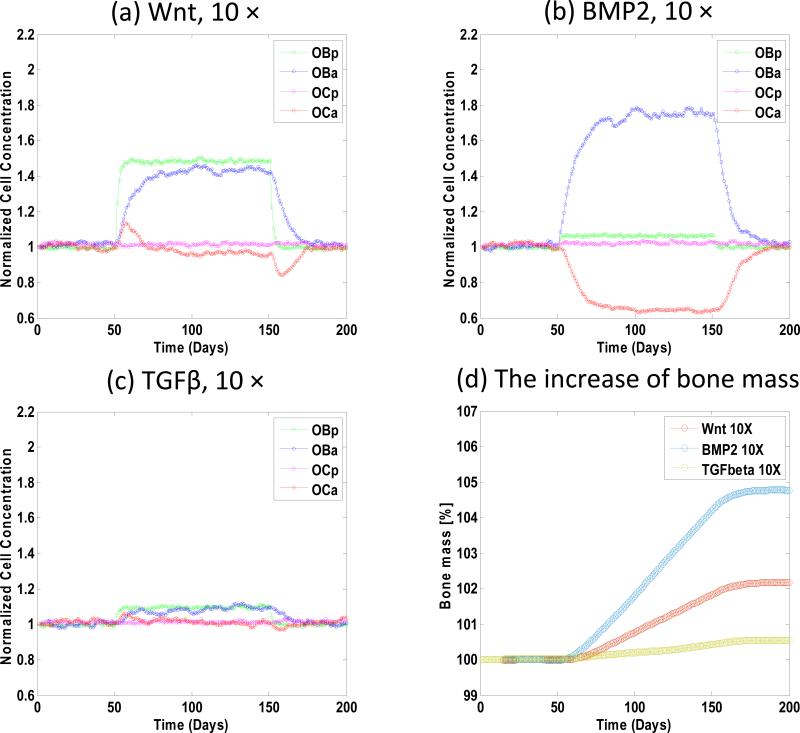
Fig. 6 shows the cellular population and bone mass response to the concentration change of each of three cytokines including BMP2, TGFβ and Wnt. We increased the concentration of Wnt, BMP2 and TGFβ 10 folds to their normal or initial in vivo concentration during the period from the 50th days to the 150th days and the results were evaluated on the 200th days. (1) Fig. 6a shows if the concentration of Wnt was increased, both concentrations of pre-osteoblasts and active osteoblasts increased rapidly; whereas the concentration of active osteoclasts increased firstly, then decreased at the end of the treatment and finally converged to its steady state; the concentration of pre-osteoclasts was almost invariant. (2) If the concentration of BMP2 was increased, Fig. 6b shows that the concentration of active osteoblasts increased significantly and the concentration of osteoclasts decreased greatly whereas both concentrations of pre-osteoblasts and pre-osteoclasts were almost invariant. (3) When we increased the concentration of TGFβ (Fig. 6c) a much lower response was observed. (4) Fig. 6d shows that the increase of bone mass induced by BMP2 was the greatest, whereas the increase of bone mass induced by TGFβ was the least.
Fig. 6. The responses of cell population and bone mass to the change of single cytokine concentration.
(a) increased Wnt, (b) increased BMP2 and (c) increased TGFβ by 10 folds respectively from the 50th days to the 150th days. (a) When the concentration of Wnt was increased, both concentrations of pre-osteoblasts and active osteoblasts increased rapidly; whereas the concentration of pre-osteoclasts was almost invariant. (b) When the concentration of BMP2 was increased, the concentration of active osteoblasts increased significantly and the concentration of osteoclasts decreased greatly whereas both concentrations of pre-osteoblasts and pre-osteoclasts were almost invariant. (c) When the concentration of TGF-β was increased a much lower response was observed. (d) The bone mass increased most when the concentration of BMP2 was increased.
Then we examined how combined cytokines influence the cellular population and bone mass. We checked all of the combinations of cytokines, i.e. Wnt/BMP2, BMP2/TGFβ, Wnt/TGFβ, and Wnt/BMP2/TGFβ. The responses of cellular population dynamics are demonstrated in the Supplementary Fig. S2. Table 1 lists the percentage increases of bone mass under different cytokine therapies. We increased the concentration of Wnt/BMP2 as a combination 5*Wnt+5*BMP2 simultaneously during the period from the 50th days to the 150th days, and the results were evaluated on the 200th days. The percentages increase of bone mass showed that combined effect was greater than both of the effects of single Wnt and BMP2. Additionally, Table 1 shows insignificant improvement of the combined effect of BMP2/TGFβ compared to the effect of single BMP2. Other combination effects can also be seen from Table 1.
Table 1.
Responses of bone mass to different cytokine therapies.
| Cytokine Therapy | Bone Mass (%) | |
|---|---|---|
| 150 days | 200 days | |
| BMP | 103.6 | 104.6 |
| Wnt | 102.4 | 102.7 |
| TGFβ | 100.4 | 100.8 |
| BMP2/Wnt | 104.7 | 105.8 |
| BMP2/TGFβ | 103.5 | 104.3 |
| Wnt/TGFβ | 101.7 | 101.9 |
| BMP2/Wnt/TGFβ | 103.8 | 104.5 |
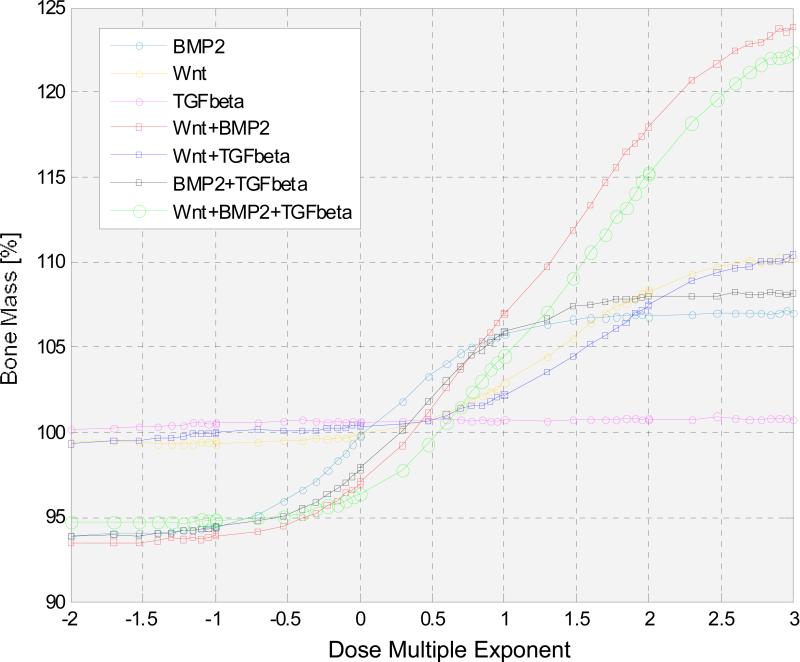
We then changed the concentration of single cytokine or combined cytokines in a large range from 10-2 to 103 with respect to their initial values to investigate the response of bone mass. Fig. 7 indicates that the combination of Wnt and BMP2 always affected the change of bone mass more than other single or combined cytokines, especially when the dose multiple exponent of the combined Wnt/BMP2 was higher than 1. However, when the dose multiple exponent of combined Wnt and BMP2 was less than 0.3, the combined Wnt/BMP2 resulted in the decrease of the bone mass compared to its steady state.
Fig. 7. The responses of bone mass to the change of concentration of cytokines in a large range from 10-2 to 103 with respect to their initial values.
X axis represents the dose multiple exponent in different therapies, Y axis represents the corresponding bone mass percentages. The combination of Wnt and BMP2 can influence the change of bone mass more than other single or combined cytokines. We also note that when the dose multiple exponent of combined Wnt and BMP2 was less than 0.3, the combined Wnt and BMP2 resulted in the decrease of the bone mass compared to its initial state.
3.3. Cytokine combination therapy evaluations
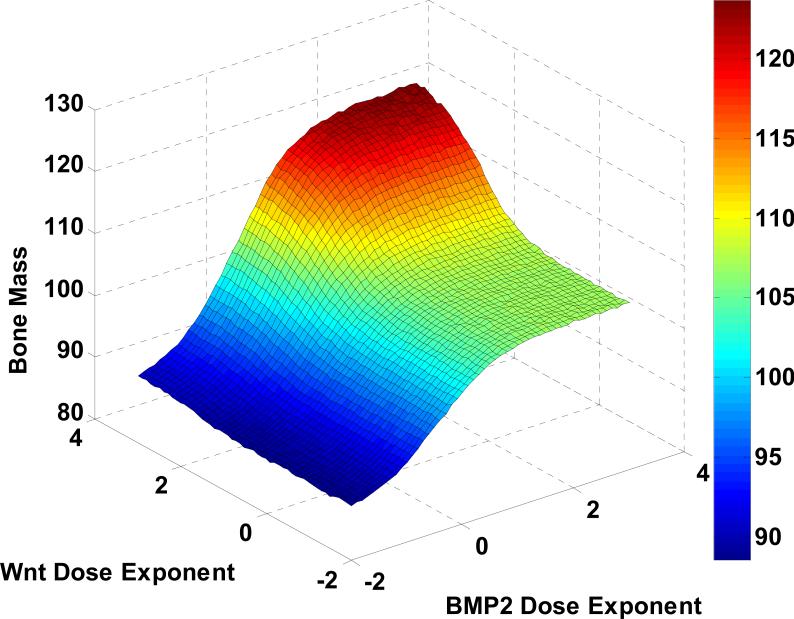
Fig. 7 reveals that the combination of Wnt and BMP2 greatest affected the change of bone mass than others. Fig. 8 shows that the flexible tuning of the bone mass percentage was controlled by Wnt and BMP2 combination. And then, we adopted the Loewe additivity [40, 41] and Bliss independence [41-43] to evaluate and examine whether the combination effect of Wnt and BMP2 is synergy or not.
Fig. 8. Prediction of bone mass production by Wnt and BMP2 combination.
The flexible tuning of the bone mass percentage was controlled by Wnt and BMP2 combination.
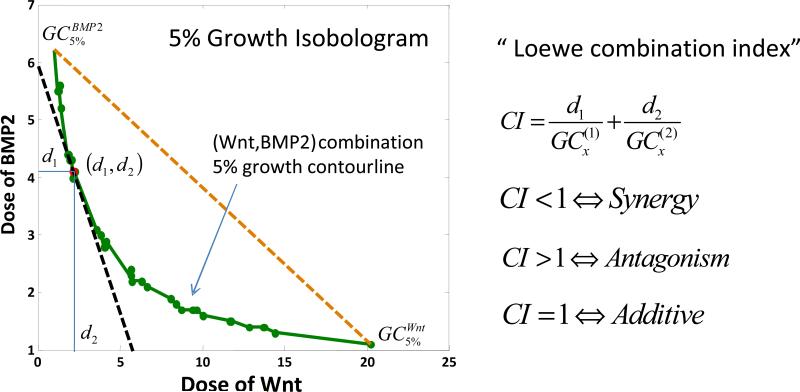
The combination index of Loewe synergy is defined as a ratio of total effective cytokine dose (combination versus single cytokines) required to achieve a given effect as follows:
| (16) |
where d1 (Wnt) and d2 (BMP2) are the cytokine combination dose located in the combination isobologram with respect to the bone mass increasing x percentage. or represents the concentration of single cytokine Wnt or BMP2 with respect to the bone mass increasing by x percentage, respectively. CILoewe<1, CILoewe>1and CILoewe=1 indicate Loewe synergy, antagonism and additivity, respectively.
Fig. 9 shows that 5% isobologram of Wnt and BMP2 (green curve) bows inward indicating CILoewe<1 in this case. Therefore the combination of Wnt and BMP2 is synergistic regarding the 5% bone growth isobologram. Also the optimal combination to achieve 5% bone growth was marked on the isobologram as a red dot, at which point the isobologram was tangent to the equivalent total dose line (the black dashed line).
Fig. 9. Synergy prediction on Wnt and BMP2 combination based on Loewe combination index.
5% isobologram of Wnt and BMP2 (green curve) bows inward indicating CI<1, therefore the combination of Wnt and BMP2 is synergy. The optimal combination of Wnt and BMP2 in terms of the minimum total dose to achieve 5% bone mass growth was marked in red at (d1, d2).
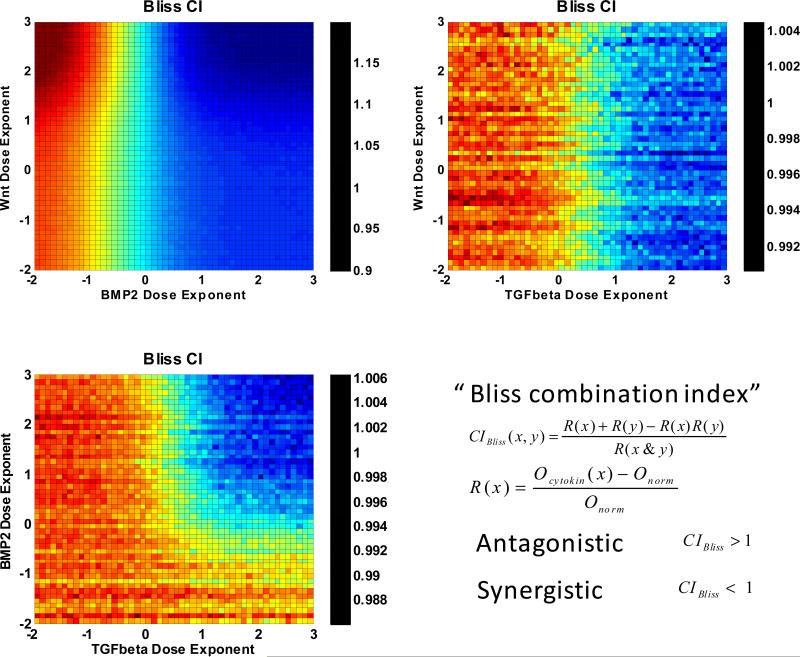
Another famous synergy quantification method for combination therapy is Bliss independence [41-43], which is defined as
| (17.1) |
where Ri(x) is response level defined as follows
| (17.2) |
Oinitial and Ocytokine are the initial bone mass and the bone mass under treatment of corresponding cytokine, respectively. R1(x) + R2(y) – R1(x)R2(y) in equation (17.1) is the expected response effect, and R12(x, y) is the actual combination effect. Hence, if CIBliss<1, Bliss index considers the combination of the cytokines has synergistic effect; if CIBliss >1, Bliss index considers the combination of the drugs has antagonistic effect; otherwise, Bliss index considers the combination of the drugs has additive effect.
We then employed Bliss index to explore more information and characteristics of the combination effect of Wnt and BMP2. As visualized in Fig. 10, our results exhibited that BMP2 levels governed the synergism. When the BMP2 level was higher than 0, the two drugs were synergic, otherwise antagonistic. We also found that Wnt at high levels showed opposite effects in terms of synergism at different BMP2 levels. When BMP2 level was high, increasing Wnt level promoted the synergistic effects of the two drugs. In contrast, when BMP2 level was low, the more the Wnt was introduced, the stronger the antagonistic effect was.
Fig. 10. Synergy prediction on dual combinations of Wnt, BMP2, and TGFβ based on Bliss combination index.
Wnt and BMP2 perform dose-dependent synergism. (a) BMP2 levels governed the synergism. When the BMP2 level was higher than 0, the two drugs were synergic, otherwise antagonistic. We also found that Wnt at high levels showed opposite effects in terms of synergism at different BMP2 levels. When BMP2 level was high, increasing Wnt level promoted the synergistic effects of the two drugs. In contrast, when BMP2 level was low, the more the Wnt was introduced, the stronger the antagonistic effect was. (b) Wnt/TGFβ and (c) BMP2/TGFβ combinations also showed dose-dependent synergism but much lower responses.
Additionally, Fig. 10 demonstrates that the combinations of Wnt/TGFβ and BMP2/TGFβ also produced dose-dependent synergisms yet much lower responses.
4. Discussion
Our quantitative study evaluated the combinatorial effects of cytokines including Wnt, BMP2, and TGFβ released from hydrogels during bone regeneration and bone remodeling based on the latest knowledge of intra- and inter- cellular signaling during bone regeneration and remodeling. We established a multi-scale systematic model by integrating the intracellular signaling pathways of interests for each cell phenotypes along with intercellular communications into the stochastic cellular population dynamics. Parameters of the intracellular signaling pathways were estimated by fitting the model to the dynamic experimental data [21, 25, 26] using genetic algorithm [37]. We then explored in silico dose effects and synergism of various cytokine combinations, which provided insights into the critical control mechanisms of the dynamic bone remodeling process. Synergisms were evaluated using Loewe index [40, 41] and Bliss index [41-43].
Our modeling strategy successfully captured key kinetic features of the underlying intra- and inter- cellular signaling pathways, given that less critical molecular details were lumped into Hill functions ([44, 45]). The simulation results (Fig. 3) were consistent with experimental data (Fig. S1), which suggested the fundamental signaling networks used in this work were reliable. The estimation of parameters was confident as most parameters were well covered by experimental data, with only 2 out of 18 parameters were unidentifiable (Fig. 4). Parameter sensitivity test (Fig. 5) proved that the model was robust against the inaccuracy of parameter estimation, which is crucial to the simulation of complex bio-systems.
The simulations of dose effects revealed that the sensitivities and dynamics of different types of bone cells to the doses of each cytokine were significantly different. Though all three cytokines promoted the populations of active osteoblasts and pre-osteoblasts (Fig. 6 a to c), BMP2 promoted the population of active osteoblasts greatest and also significantly suppressed that of active osteoclasts (Fig. 6 b). Other groups also observed similar effects of BMP2 [46, 47]. This finding may be useful for the clinical treatment of osteoporosis, that is, growth factors, such as BMP2, can be potentially used to not only promote the bone formation but also inhibit the bone resorption for osteoporosis patients. It was also interesting to observe that TGFβ, one of the most abundant cytokines in bone tissues, showed few effects on bone remodeling, which was consistent with results from peers [48] that the major role of TGFβ during bone remodeling is to promote migration of bone MSC instead of directly regulating the balance between bone formation and resorption.
The in silico exploring of drug (cytokine) combinations cast new light on the design strategies of engineered bone scaffolds, such as hydrogels carrying cytokines or growth factors and cells. Regarding the cytokines encapsulated in the hydrogels, the combinations of Wnt and BMP2 surpassed all the other choices with dramatic enhance merit of both total bone mass production (Fig. 7) and the most significant synergistic effects (Fig. 10 a). This results are consistent with published works [49, 50] but, in addition, we demonstrate here that the effects of Wnt were BMP2-dependent. When the BMP2 level was low, Wnt along could not initiate significant bone mass production, and also showed antagonistic effects. TGFβ showed similar trends. As for prevention of over-generation of bone mass and the consequential hyperostosis, reduction of any single cytokines of TGFβ or Wnt could not suppress bone over-generation, while any of their combinations as well as single or combined BMP2 performed equally well.
Optimal doses of cytokine combinations released from the hydrogels for most efficiently tuning bone remodeling could be achieved from the growth isobolograms of specific goals of tuning.
For example, as shows in Fig. 9, if the overall bone regeneration in the artificial scaffolds should be boosted by 5% to meet the clinical need of a bone fracture patient who also suffers from osteoporosis, the most efficient cytokine delivery doses should be around BMP2 of 4.1 and Wnt of 2.2. Such results will provide very useful guidelines for the designs of the cytokine releasing devices.
The major purpose of this work was to explore the possible strategies of long-term delivering of cytokines to guide the bone remodeling of the engineered bone grafts and promote the prognosis, therefore we did not explicitly simulate those processes that were also crucial for bone tissue engineering but not for bone remodeling, which including initial vascularization, inflammatory effects. mechanical cues that are sensed and processed by osteocytes in the regulation of bone formation and resorption [51] are also important but beyond the scope of this work. Actual intraand inter- cellular signaling mechanisms involved in bone remodeling and healing are extensively complicated [19, 52]. As the first attempt, we focused on several well known major mechanisms [19-24, 27, 50] and combined the detailed reactions of the signaling pathways (i.e. ligand-receptor reaction, protein binding and disassociation) using Hill functions. The parameter estimation was based on the current available in vitro dynamic experimental data [21, 25, 26], as the reliable in vivo dynamic data are not yet available. Other growth factors and cytokines, such as IGF1, FGF2, VEGF and etc. released from hydrogels, along with mechanosensor cells, osteocytes, will be examined in a follow up study. Intensive in vivo studies guided by this work will provide necessary data for further extending our current model to a quantitative, personalized simulation system to develop proper treatment plan for each patient.
5. Conclusions
This study showed the dominating role of BMP2 in bone regeneration and remodeling, predicted that the combination of Wnt and BMP2 can achieve best control of bone remodeling and best bone mass regeneration among tested combinations, and suggested optimal dose ratios of given cytokine combinations released from hydrogels to most efficiently control the long-term bone remodeling. The analysis of simulation results brings insights into the underlying molecular and cellular mechanisms for the combination effects of cytokines. This model as well as the quantitative synergism evaluation of cytokine combinations in terms of bone formation has significantly narrowed the candidates of cytokine delivery conditions for the designs of biological experiments, and will guide the design of in vivo bone scaffolds and the clinical treatment of some diseases such as osteoporosis.
Supplementary Material
Acknowledgements
We would like to acknowledge the members of Translational Biosystems Lab in Cornell Medical School and Dr. Huiming Peng for the valuable discussions. This work was supported by Funding: NIH R01LM010185-03 (Zhou), NIH U01HL111560-01 (Zhou), NIH 1R01DE022676-01 (Zhou), Uo1 CA166886-01 (Zhou) and DOD-W81XWH-11-2-0168-P4 (Zhou).
Abbreviations
- BMP2
bone morphogenetic protein 2
- TGFβ
transforming growth factor β
- Osx
Osterix
- Runx2
Runt-related transcription factor 2
- BMU
basic multicellular unit
- MSC
mesenchymal stem cell
- OBp
pre-osteoblasts
- OBa
active osteoblasts
- HSC
hematopoietic stem cells
- OCp
pre-osteoclasts
- OCa
active osteoclasts
- ODEs
ordinary differential equations
- SDEs
stochastic differential equations
- OPG
Osteoprotegerin
Footnotes
Publisher's Disclaimer: This is a PDF file of an unedited manuscript that has been accepted for publication. As a service to our customers we are providing this early version of the manuscript. The manuscript will undergo copyediting, typesetting, and review of the resulting proof before it is published in its final citable form. Please note that during the production process errors may be discovered which could affect the content, and all legal disclaimers that apply to the journal pertain.
References
- 1.Chang YS, Oka M, Kobayashi M, Gu HO, Li ZL, Kitsugi T, et al. Bone formation and remodeling around implanted materials under load-bearing conditions. Clin Mater. 1994;17:181–7. doi: 10.1016/0267-6605(94)90034-5. [DOI] [PubMed] [Google Scholar]
- 2.O'Keefe RJ, Mao J. Bone tissue engineering and regeneration: from discovery to the clinic--an overview. Tissue Eng Part B Rev. 2011;17:389–92. doi: 10.1089/ten.teb.2011.0475. [DOI] [PMC free article] [PubMed] [Google Scholar]
- 3.Schindeler A, McDonald MM, Bokko P, Little DG. Bone remodeling during fracture repair: The cellular picture. Semin Cell Dev Biol. 2008;19:459–66. doi: 10.1016/j.semcdb.2008.07.004. [DOI] [PubMed] [Google Scholar]
- 4.Kalfas IH. Principles of bone healing. Neurosurg focus. 2001;10:1–4. doi: 10.3171/foc.2001.10.4.2. [DOI] [PubMed] [Google Scholar]
- 5.Sadr N, Zhu M, Osaki T, Kakegawa T, Yang Y, Moretti M, et al. SAM-based cell transfer to photopatterned hydrogels for microengineering vascular-like structures. Biomaterials. 2011;32:7479–90. doi: 10.1016/j.biomaterials.2011.06.034. [DOI] [PMC free article] [PubMed] [Google Scholar]
- 6.Kim S, Nishimoto SK, Bumgardner JD, Haggard WO, Gaber MW, Yang Y. A chitosan/[beta]-glycerophosphate thermo-sensitive gel for the delivery of ellagic acid for the treatment of brain cancer. Biomaterials. 2010;31:4157–66. doi: 10.1016/j.biomaterials.2010.01.139. [DOI] [PubMed] [Google Scholar]
- 7.Kang Y, Kim S, Khademhosseini A, Yang Y. Creation of bony microenvironment with CaP and cell-derived ECM to enhance human bone-marrow MSC behavior and delivery of BMP-2. Biomaterials. 2011;32:6119–30. doi: 10.1016/j.biomaterials.2011.05.015. [DOI] [PMC free article] [PubMed] [Google Scholar]
- 8.Kim S, Kang Y, Krueger CA, Sen M, Holcomb JB, Chen D, et al. Sequential delivery of BMP-2 and IGF-1 using a chitosan gel with gelatin microspheres enhances early osteoblastic differentiation. Acta Biomater. 2012;8:1768–77. doi: 10.1016/j.actbio.2012.01.009. [DOI] [PMC free article] [PubMed] [Google Scholar]
- 9.Koutsopoulos S, Zhang S. Two-layered injectable self-assembling peptide self hydrogels for long-term sustained release of human antibodies. J Control Release. 2012;160:451–8. doi: 10.1016/j.jconrel.2012.03.014. [DOI] [PubMed] [Google Scholar]
- 10.Yang J- A, Kim H, Park K, Hahn SK. Molecular design of hyaluronic acid hydrogel networks for long-term controlled delivery of human growth hormone. Soft Matter. 2011;7:868–70. [Google Scholar]
- 11.Wei L, Cai C, Lin J, Chen T. Dual-drug delivery system based on hydrogel/micelle composites. Biomaterials. 2009;30:2606–13. doi: 10.1016/j.biomaterials.2009.01.006. [DOI] [PubMed] [Google Scholar]
- 12.Dimitriou R, Tsiridis E, Giannoudis PV. Current concepts of molecular aspects of bone healing. Injury. 2005;36:1392–404. doi: 10.1016/j.injury.2005.07.019. [DOI] [PubMed] [Google Scholar]
- 13.Ai-Aql Z, Alagl A, Graves D, Gerstenfeld L, Einhorn T. Molecular mechanisms controlling bone formation during fracture healing and distraction osteogenesis. J Dent Res. 2008;87:107–18. doi: 10.1177/154405910808700215. [DOI] [PMC free article] [PubMed] [Google Scholar]
- 14.Jilka RL. Biology of the basic multicellular unit and the pathophysiology of osteoporosis. Med Pediatr Oncol. 2003;41:182–5. doi: 10.1002/mpo.10334. [DOI] [PubMed] [Google Scholar]
- 15.Komarova SV, Smith RJ, Dixon SJ, Sims SM, Wahl LM. Mathematical model predicts a critical role for osteoclast autocrine regulation in the control of bone remodeling. Bone. 2003;33:206–15. doi: 10.1016/s8756-3282(03)00157-1. [DOI] [PubMed] [Google Scholar]
- 16.Lemaire V, Tobin FL, Greller LD, Cho CR, Suva LJ. Modeling the interactions between osteoblast and osteoclast activities in bone remodeling. J Theor Biol. 2004;229:293–309. doi: 10.1016/j.jtbi.2004.03.023. [DOI] [PubMed] [Google Scholar]
- 17.Pivonka P, Zimak J, Smith DW, Gardiner BS, Dunstan CR, Sims NA, et al. Model structure and control of bone remodeling: a theoretical study. Bone. 2008;43:249–63. doi: 10.1016/j.bone.2008.03.025. [DOI] [PubMed] [Google Scholar]
- 18.Pivonka P, Zimak J, Smith DW, Gardiner BS, Dunstan CR, Sims NA, et al. Theoretical investigation of the role of the RANK-RANKL-OPG system in bone remodeling. J Theor Biol. 2010;262:306–16. doi: 10.1016/j.jtbi.2009.09.021. [DOI] [PubMed] [Google Scholar]
- 19.Gordeladze JO, Reseland JE, Duroux-Richard I, Apparailly F, Jorgensen C. From stem cells to bone: phenotype acquisition, stabilization, and tissue engineering in animal models. ILAR J. 2009;51:42–61. doi: 10.1093/ilar.51.1.42. [DOI] [PubMed] [Google Scholar]
- 20.Afzal F, Pratap J, Ito K, Ito Y, Stein JL, Van Wijnen AJ, et al. Smad function and intranuclear targeting share a Runx2 motif required for osteogenic lineage induction and BMP2 responsive transcription. J Cell Physiol. 2005;204:63–72. doi: 10.1002/jcp.20258. [DOI] [PubMed] [Google Scholar]
- 21.Miyoshi K, Nagata H, Horiguchi T, Abe K, Arie Wahyudi I, Baba Y, et al. BMP2-induced gene profiling in dental epithelial cell line. J Med Invest. 2008;55:216–26. doi: 10.2152/jmi.55.216. [DOI] [PubMed] [Google Scholar]
- 22.Ryoo HM, Lee MH, Kim YJ. Critical molecular switches involved in BMP-2-induced osteogenic differentiation of mesenchymal cells. Gene. 2006;366:51–7. doi: 10.1016/j.gene.2005.10.011. [DOI] [PubMed] [Google Scholar]
- 23.Crockett JC, Rogers MJ, Coxon FP, Hocking LJ, Helfrich MH. Bone remodelling at a glance. J Cell Sci. 2011;124:991–8. doi: 10.1242/jcs.063032. [DOI] [PubMed] [Google Scholar]
- 24.Komori T. Regulation of bone development and maintenance by Runx2. Front Biosci. 2008;13:898–903. doi: 10.2741/2730. [DOI] [PubMed] [Google Scholar]
- 25.Tohmonda T, Miyauchi Y, Ghosh R, Yoda M, Uchikawa S, Takito J, et al. The IRE1[alpha]-XBP1 pathway is essential for osteoblast differentiation through promoting transcription of Osterix. EMBO Rep. 2011;12:451–7. doi: 10.1038/embor.2011.34. [DOI] [PMC free article] [PubMed] [Google Scholar]
- 26.Schmierer B, Tournier AL, Bates PA, Hill CS. Mathematical modeling identifies Smad nucleocytoplasmic shuttling as a dynamic signal-interpreting system. Proc Natl Acad Sci U S A. 2008;105:6608–13. doi: 10.1073/pnas.0710134105. [DOI] [PMC free article] [PubMed] [Google Scholar]
- 27.Yavropoulou MP, Yovos JG. The role of the Wnt signaling pathway in osteoblast commitment and differentiation. Hormones. 2007;6:279–94. doi: 10.14310/horm.2002.1111024. [DOI] [PubMed] [Google Scholar]
- 28.Klipp E, Liebermeister W, Wierling C, Kowald A, Lehrach H, Herwig R. Systems biology: a textbook. Wiley-VCH; Weinheim: 2009. pp. 13–27. [Google Scholar]
- 29.Chou TC. Derivation and properties of Michaelis-Menten type and Hill type equations for reference ligands. J Theor Biol. 1976;59:253–76. doi: 10.1016/0022-5193(76)90169-7. [DOI] [PubMed] [Google Scholar]
- 30.Lee E, Salic A, Krüger R, Heinrich R, Kirschner MW. The roles of APC and Axin derived from experimental and theoretical analysis of the Wnt pathway. PLoS Biol. 2003;1:e10. doi: 10.1371/journal.pbio.0000010. [DOI] [PMC free article] [PubMed] [Google Scholar]
- 31.Murray PJ, Kang JW, Mirams GR, Shin SY, Byrne HM, Maini PK, et al. Modelling spatially regulated [beta]-catenin dynamics and invasion in intestinal crypts. Biophys J. 2010;99:716–25. doi: 10.1016/j.bpj.2010.05.016. [DOI] [PMC free article] [PubMed] [Google Scholar]
- 32.Boyce BF, Xing L. Functions of RANKL/RANK/OPG in bone modeling and remodeling. Arch Biochem Biophys. 2008;473:139–46. doi: 10.1016/j.abb.2008.03.018. [DOI] [PMC free article] [PubMed] [Google Scholar]
- 33.Lee JM, Gianchandani EP, Eddy JA, Papin JA. Dynamic analysis of integrated signaling, metabolic, and regulatory networks. PLoS Comput Biol. 2008;4:e1000086. doi: 10.1371/journal.pcbi.1000086. [DOI] [PMC free article] [PubMed] [Google Scholar]
- 34.Øksendal BK. Stochastic differential equations: an introduction with applications. 5th ed. Springer Verlag; New York: 2003. pp. 61–72. [Google Scholar]
- 35.Holmes MH. Introduction to numerical methods in differential equations. Springer Verlag; New York: 2007. pp. 5–23. [Google Scholar]
- 36.Higham DJ. An algorithmic introduction to numerical simulation of stochastic differential equations. SIAM review. 2001:525–46. [Google Scholar]
- 37.Katare S, Bhan A, Caruthers JM, Delgass WN, Venkatasubramanian V. A hybrid genetic algorithm for efficient parameter estimation of large kinetic models. Comput Chem Eng. 2004;28:2569–81. [Google Scholar]
- 38.Davison AC, Hinkley DV. Bootstrap methods and their application. Cambridge Univ Pr; New York: 1997. pp. 11–22. [Google Scholar]
- 39.Lee JM, Zhang J, Su AI, Walker JR, Wiltshire T, Kang K, et al. A novel approach to investigate tissue-specific trinucleotide repeat instability. BMC Syst Biol. 2010;4:29. doi: 10.1186/1752-0509-4-29. [DOI] [PMC free article] [PubMed] [Google Scholar]
- 40.Straetemans R, O'Brien T, Wouters L, Van Dun J, Janicot M, Bijnens L, et al. Design and analysis of drug combination experiments. Biometrical J. 2005;47:299–308. doi: 10.1002/bimj.200410124. [DOI] [PubMed] [Google Scholar]
- 41.Fitzgerald JB, Schoeberl B, Nielsen UB, Sorger PK. Systems biology and combination therapy in the quest for clinical efficacy. Nat Chem Biol. 2006;2:458–66. doi: 10.1038/nchembio817. [DOI] [PubMed] [Google Scholar]
- 42.Peng H, Wen J, Li H, Chang J, Zhou X. Drug inhibition profile prediction for NFkB pathway in multiple myeloma. PLoS ONE. 2011;6:e14750. doi: 10.1371/journal.pone.0014750. [DOI] [PMC free article] [PubMed] [Google Scholar]
- 43.Bliss C. The toxicity of posons applied jointly. Ann Appl Biol. 1939;26:585–615. [Google Scholar]
- 44.Novak B, Tyson JJ. Design principles of biochemical oscillators. Nat Rev Mol Cell Biol. 2008;9:981–91. doi: 10.1038/nrm2530. [DOI] [PMC free article] [PubMed] [Google Scholar]
- 45.Mather W, Bennett MR, Hasty J, Tsimring LS. Delay-Induced Degrade-and-Fire Oscillations in Small Genetic Circuits. Phys Rev Lett. 2009;102:068105. doi: 10.1103/PhysRevLett.102.068105. [DOI] [PMC free article] [PubMed] [Google Scholar]
- 46.Yilgor P, Tuzlakoglu K, Reis RL, Hasirci N, Hasirci V. Incorporation of a sequential BMP-2/BMP-7 delivery system into chitosan-based scaffolds for bone tissue engineering. Biomaterials. 2009;30:3551–9. doi: 10.1016/j.biomaterials.2009.03.024. [DOI] [PubMed] [Google Scholar]
- 47.Kempen DHR, Lu L, Hefferan TE, Creemers LB, Maran A, Classic KL, et al. Retention of in vitro and in vivo BMP-2 bioactivities in sustained delivery vehicles for bone tissue engineering. Biomaterials. 2008;29:3245–52. doi: 10.1016/j.biomaterials.2008.04.031. [DOI] [PMC free article] [PubMed] [Google Scholar]
- 48.Tang Y, Wu X, Lei W, Pang L, Wan C, Shi Z, et al. TGF-[beta]1-induced migration of bone mesenchymal stem cells couples bone resorption with formation. Nat Med. 2009;15:757–65. doi: 10.1038/nm.1979. [DOI] [PMC free article] [PubMed] [Google Scholar]
- 49.Sato MM, Nakashima A, Nashimoto M, Yawaka Y, Tamura M. Bone morphogenetic protein-2 enhances Wnt/beta-catenin signaling-induced osteoprotegerin expression. Genes Cells. 2009;14:141–53. doi: 10.1111/j.1365-2443.2008.01258.x. [DOI] [PubMed] [Google Scholar]
- 50.Nakashima A, Katagiri T, Tamura M. Cross-talk between Wnt and bone morphogenetic protein 2 (BMP-2) signaling in differentiation pathway of C2C12 myoblasts. J Biol Chem. 2005;280:37660–8. doi: 10.1074/jbc.M504612200. [DOI] [PubMed] [Google Scholar]
- 51.Jacobs CR, Temiyasathit S, Castillo AB. Osteocyte mechanobiology and pericellular mechanics. Annu Rev Biomed Eng. 2010;12:369–400. doi: 10.1146/annurev-bioeng-070909-105302. [DOI] [PubMed] [Google Scholar]
- 52.Hughes FJ, Turner W, Belibasakis G, Martuscelli G. Effects of growth factors and cytokines on osteoblast differentiation. Periodontol 2000. 2006;41:48–72. doi: 10.1111/j.1600-0757.2006.00161.x. [DOI] [PubMed] [Google Scholar]
Associated Data
This section collects any data citations, data availability statements, or supplementary materials included in this article.


