Abstract
Calorie restriction (CR; ~60% of ad libitum, AL, consumption) improves insulin-stimulated glucose uptake in skeletal muscle. The precise cellular mechanism for this healthful outcome is unknown, but it is accompanied by enhanced insulin-stimulated activation of Akt. Previous research using Akt2-null mice demonstrated that Akt2 is essential for the full CR-effect on insulin-stimulated glucose uptake by muscle. However, because Akt2-null mice were completely deficient in Akt2 in every cell throughout life, it would be valuable to assess the efficacy of transient, muscle-specific Akt inhibition for attenuation of CR-effects on glucose uptake. Accordingly, we used a selective Akt inhibitor (MK-2206) to eliminate the CR-induced elevation in insulin-stimulated Akt2 phosphorylation and determined the effects on Akt substrates and glucose uptake. We incubated isolated epitrochlearis muscles from 9-month-old AL and CR (~60–65% of AL intake for 6 months) rats with or without MK-2206 and measured insulin-stimulated (1.2 nM) glucose uptake and phosphorylation of the insulin receptor (Tyr1162/1163), pan-Akt (Thr308 and Ser473), Akt2 (Thr308 and Ser473), AS160/TBC1D4 (Thr642), and Filamin C (Ser2213). Incubation of isolated skeletal muscles with a dose of a selective Akt inhibitor that eliminated the CR-induced increases in Akt2 phosphorylation prevented CR’s effects on insulin-stimulated glucose uptake, pAS160Thr642 and pFilamin CSer2213 without altering pIRTyr1162/1163. These data provide compelling new evidence linking the CR-induced increase in insulin-stimulated Akt2 phosphorylation to CR’s effects on insulin-mediated phosphorylation of Akt substrates and glucose uptake in skeletal muscle.
1. Introduction
Calorie restriction without malnutrition (~60% of ad libitum, AL, consumption) has been demonstrated to produce numerous health benefits in various species including mice, rats, non-human primates, and humans [1–9]. A hallmark of CR is improved insulin sensitivity, and this benefit is attributable, in large part, to improved insulin-stimulated glucose uptake in skeletal muscle [3, 10–13]. The cellular mechanism for enhanced insulin-stimulated glucose uptake by skeletal muscle remains to be fully elucidated, but it has been demonstrated to occur concomitant with greater insulin-induced activation of Akt [10, 11].
Akt2 has been identified as the Akt isoform that is crucial for insulin-stimulated glucose uptake [10, 14–17]. Previous studies have demonstrated that CR leads to increased insulin-stimulated activation of Akt2 in skeletal muscle [10, 11, 18]. Akt substrate of 160 kDa (AS160; also known as TBC1D4) is a Rab GTPase activating protein (Rab-GAP) and Akt substrate that is a major mediator of insulin’s activation of glucose transport [19]. AS160 has also been identified to be a specific substrate of Akt2 [20, 21], and CR leads to increased insulin-stimulated phosphorylation of both Akt2 and AS160 concomitant with elevated insulin-stimulated glucose transport in rat epitrochlearis muscle [11].
Using Akt2-null mice, McCurdy et al. [10] demonstrated that Akt2 is essential for the full CR-effect on insulin-stimulated glucose uptake by skeletal muscle. However, because Akt2 expression was completely absent from all cells throughout the life of these mice, it would be valuable to use a different experimental approach to more precisely elucidate Akt2’s role in CR-mediated benefits on muscle insulin sensitivity. Accordingly, we incubated isolated rat epitrochlearis muscles with MK-2206, a potent and selective Akt inhibitor [22–25] and measured insulin signaling and glucose uptake. Our goal was to identify a dose of MK-2206 that eliminated the CR-induced elevation in insulin-stimulated Akt2 phosphorylation (i.e., to reduce the Akt2 phosphorylation of insulin-treated muscles from CR rats to levels similar to those found in insulin-treated muscles from AL rats) and determine the functional effects on the AS160 and glucose uptake. We hypothesized that acutely inhibiting the CR-induced increase in insulin-stimulated Akt2 phosphorylation would reduce the effects of CR on insulin-stimulated AS160 phosphorylation and glucose uptake.
2. Materials and methods
2.1. Materials
Unless otherwise noted, all chemicals were purchased from Fisher Scientific (Hanover Park, IL) or Sigma Chemical (St. Louis, MO). Reagents and apparatus for SDS-PAGE and immunoblotting were from Bio-Rad Laboratories (Hercules, CA). Anti-phospho AS160 Thr642 (pAS160Thr642; #3028-P1) was from B-Bridge International (Cupertino, CA). Anti-phospho Akt Thr308 (pAktThr308; #9275), anti-phospho Akt Ser473 (pAktSer473; #9272), and anti-rabbit IgG horseradish peroxidase conjugate (#7074) were from Cell Signaling Technology (Danvers, MA). Anti-phospho IR Tyr1162/1163 (pIRTyr1162/1163; #44-504G) and anti-IR (#AHR0271) were from Invitrogen (Camarillo, CA). Anti-AS160 (#07-741), anti-GLUT4 (#CBL243) and anti-sheep IgG horseradish peroxidase conjugate (#12-342) were from Millipore (Billerica, MA). Anti-Akt2 (#AF23151) was from R&D Biosystems (Minneapolis, MN). Anti-Filamin C (#sc-48496), anti-goat IgG horseradish peroxidase conjugate (#sc-2020), and anti-mouse IgG horseradish peroxidase conjugate (#sc-2060) were from Santa Cruz Biotechnology (Santa Cruz, CA). Anti-phospho Filamin-C (pFilCSer2213; PB-131) was from Kinasource (Dundee, Scotland, UK). Akt inhibitor MK-2206 (#S1078) was from Selleck Chemicals (Houston, TX). 2-Deoxy-D-[3H]glucose ([3H]2-DG) and [14C]mannitol were from Perkin Elmer (Boston, MA).
2.2. Animal care
Procedures for animal care were approved by the University of Michigan Committee on Use and Care of Animals. Male Fisher 344 x Brown Norway rats, both CR rats and their AL controls were obtained at 8 months of age from National Institute of Aging (NIA) Calorie Restricted Rodent Colony. Calorie restriction was initiated at 14 weeks of age in the CR group by the NIA. Rats were housed at the University of Michigan for approximately one month prior to experimentation. During this time the rats were housed individually in shoebox cages and maintained on a 12–12 h light-dark cycle (lights out at 17:00 h) in specific pathogen-free conditions. Rats were provided chow (AL: NIH31 chow; CR: NIH31/NIA Fortified chow) and maintained on their respective feeding protocol (AL: free access to chow; CR: ~60–65% of AL consumption). Rats were sacrificed after ~one month at the University of Michigan facility, when they were ~9 months of age.
2.3. Muscle dissection and incubation
Muscle dissection was performed as previously described [11]. Muscles strips were subsequently placed in vials containing the appropriate media, shaken at 45 rpm, continuously gassed (95% O2/5% CO2), and heated (35°C) in a water bath. Muscles were incubated in vials containing 2 ml KHB supplemented with 0.1% bovine serum albumin (BSA), 2 mM sodium pyruvate, 6 mM mannitol, and either DMSO or MK-2206 (0.25 μM or 0.5 μM) for 30 min. Muscles were then transferred to a second vial containing the identical solution as the previous step, with or without a physiological concentration (1.2 nM) of insulin for 30 min. Muscles were then transferred to a third vial containing 2 ml KHB/BSA, the same concentration of MK-2206 and insulin as the previous step, 1 mM 2-DG; including a final specific activity of 2.25 mCi/mmol [3H]-2-DG), and 9 mM mannitol (including a final specific activity of 0.022 mCi/mmol [14C]-mannitol) for 20 min. After this step, muscles were blotted on filter paper moistened with ice-cold KHB, trimmed, freeze-clamped using aluminum tongs cooled in liquid nitrogen, and stored at −80°C for later processing and analysis.
2.4. Muscle lysate preparation
Frozen muscles were weighed, homogenized in ice-cold lysis buffer (1 ml/muscle strip) using a TissueLyser II homogenizer (Qiagen, Valencia, CA). The lysis buffer contained T-PER Tissue Protein Extraction Reagent (#PI-78510; Thermo Scientific, Rockford, IL), 1 mM EDTA, 1 mM EGTA, 2.5 mM sodium pyrophosphate, 1 mM sodium vanadate, 1 mM β-glycerophosphate, 1 μg/ml leupeptin, and 1 mM phenylmethylsulfonyl fluoride. Homogenates were transferred to microfuge tubes, rotated for 1 h at 4°C, and then centrifuged at 15,000 g for 15 min at 4°C to remove insoluble material. Protein concentration was measured using the BCA protein assay kit (#23227; Thermo Scientific).
2.5 Immunoprecipitation
Evaluation of Akt2 phosphorylation at either the Thr308 or Ser473 residue has been previously described [11].
2.6 Immunoblotting
Western blotting procedures have been previously described [11]. An equal amount of protein of each sample was mixed with 6x Laemmli buffer, boiled for 5 min and separated using SDS-PAGE (7% resolving gel), before being transferred to polyvinylidene fluoride membranes (PVDF; Millipore). Membranes were blocked in 5% BSA in TBST (Tris-buffered saline, pH 7.5 plus 0.1% Tween-20) for 1 h at room temperature and transferred to 5% BSA-TBST with the appropriate primary antibody overnight at 4°C. Membranes were washed 3 times for 5 min in TBST and incubated with secondary antibody for 1 h at room temperature. Blots were washed 3 times for 5 min in TBST then washed 2 times for 5 min in TBS and then subjected to enhanced chemiluminescence (Luminata Forte Western HRP Substrate; #WBLUF0100; Millipore) to visualize protein bands. Immunoreactive proteins were quantified by densitometry (AlphaEase FC; Alpha Innotech, San Leandro, CA). Values are expressed relative to the normalized average of the insulin-stimulated samples without inhibitor on each blot.
2.7. 2-Deoxy-D-glucose uptake
The calculation of [3H]-2-Deoxy-D-glucose (2-DG) uptake from skeletal muscle lysates has been previously described [26, 27].
2.8. Statistical analysis
Student’s t-test was used for comparisons between two groups. One-way analysis of variance (ANOVA) was used to determine statistical significance for comparison of more than two groups. (SigmaPlot version 11.0; Systat Software, San Jose, CA). Data presented as mean ± SEM. A P value ≤ 0.05 was accepted as statistically significant.
3. Results
3.1. Total protein abundance
There was no significant difference in total protein abundance between any of the treatment groups for Akt2, AS160, Filamin C, IR, or GLUT4 (data not shown).
3.2. Akt phosphorylation
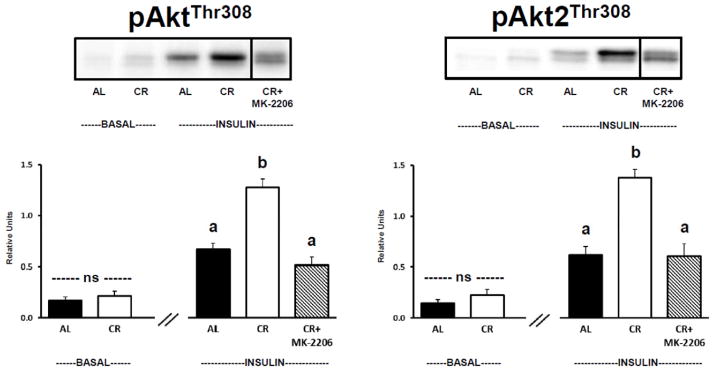
There was no significant difference between AL and CR groups for muscles incubated in the absence of insulin and without MK-2206 for either pan-Akt phosphorylation (Fig. 1, Left Panel) or Akt2 phosphorylation (Fig. 1, Right Panel) at the Thr308 site. For insulin-stimulated muscles incubated without MK-2206, the phosphorylation of both AktThr308 (Fig. 1, Left Panel) and Akt2Thr308 (Fig. 1, Right Panel) were significantly (P ≤ 0.05) greater for CR versus AL rats. Incubation of insulin-stimulated CR muscles with MK-2206 (0.5 μM) significantly (P ≤ 0.05) reduced phosphorylation of both pan-AktThr308 and Akt2Thr308 compared to insulin-stimulated CR muscles incubated without MK-2206 (Fig. 1). Neither pan-AktThr308 nor Akt2Thr308 phosphorylation was significantly different in insulin-stimulated AL muscles versus insulin-stimulated CR muscles incubated with MK-2206.
Figure 1.
Left: pan-Akt Thr308 phosphorylation (pAktThr308). Right: Akt2 Thr308 phosphorylation (pAkt2Thr308), muscles lysate was immunoprecipitated with Akt2 antibody prior to immunoblotting with phospho-AktThr308 antibody. “ns” indicates no statistical difference between AL and CR groups in the absence of insulin. Insulin-stimulated groups with matching letters are not statistically different, and groups with differing letters are statistically (P ≤ 0.05) different from each other. Values are means ± SE, n = 6–10 per treatment group. The representative blots for Figures 1–4 and 6 include a vertical line between the final 2 lanes (labeled as CR and CR+MK-2206). The vertical line indicates that 3 lanes (that were located between the lanes labeled as CR and CR+MK-2206) are not included in the representative blots of Figures 1–4 and 6. For each of the representative blots, another image including the 3 absent lanes is provided in Supplementary Figures S1–S5.
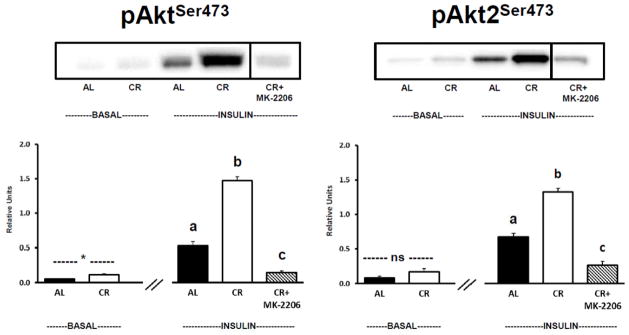
There was significantly (P ≤ 0.05) greater pan-AktSer473 phosphorylation for CR versus AL muscles in the absence of insulin and without MK-2206 (Fig. 2, Left Panel). There was no significant difference between AL and CR groups in the absence of insulin and without MK-2206 for Akt2Ser473 phosphorylation (Fig. 2, Right Panel). For insulin-stimulated muscles incubated without MK-2206, the phosphorylation of both AktSer473 (Fig. 2, Left Panel) and Akt2Ser473 (Fig. 2, Right Panel) was significantly (P ≤ 0.05) greater for CR versus AL rats. Incubation of insulin-stimulated CR muscles with MK-2206 (0.5 μM) significantly (P ≤ 0.05) reduced phosphorylation of both pan-AktSer473 and Akt2Ser473 compared to insulin-stimulated CR muscles incubated without MK-2206 (Fig. 2). Both pan-AktSer473 and Akt2Ser473 phosphorylation were significantly (P ≤ 0.05) reduced in insulin-stimulated AL muscles versus insulin-stimulated CR muscles incubated with MK-2206.
Figure 2.
Left: pan-Akt Ser473 phosphorylation (pAktSer473). Right: Akt2 Ser473 phosphorylation (pAkt2Ser473), muscles lysate was immunoprecipitated with Akt2 antibody prior to immunoblotting with phospho-AktSer473 antibody. See Fig. 1 legend for representative blot explanation. *Indicates a statistical (P ≤ 0.05) difference between AL and CR groups in the absence of insulin. “ns” indicates no statistical difference between AL and CR groups in the absence of insulin. Insulin-stimulated groups with matching letters are not statistically different, and groups with differing letters are statistically (P ≤ 0.05) different from each other. Values are means ± SE, n = 6–11 per treatment group.
3.3. AS160/TBC1D4 phosphorylation
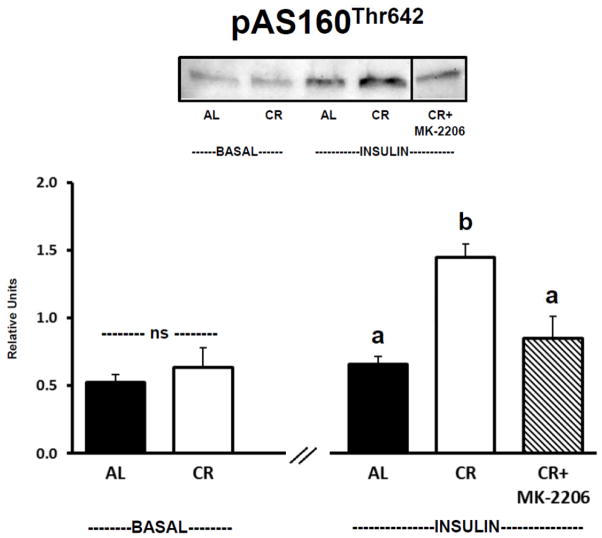
There was no significant difference between AL and CR groups for muscles incubated in the absence of insulin and without MK-2206 for AS160Thr642 phosphorylation (Fig. 3). For insulin-stimulated muscles incubated without MK-2206, AS160Thr642 phosphorylation of was significantly (P ≤ 0.05) greater for CR versus AL rats. Incubation of insulin-stimulated CR muscles with MK-2206 (0.5 μM) significantly (P ≤ 0.05) reduced AS160Thr642 phosphorylation compared to insulin-stimulated CR muscles incubated without MK-2206. AS160Thr642 phosphorylation was not significantly different in insulin-stimulated AL muscles versus insulin-stimulated CR muscles incubated with MK-2206.
Figure 3.
AS160/TBC1D4 Thr642 phosphorylation (pAS160Thr642). See Fig. 1 legend for representative blot explanation. “ns” indicates no statistical difference between AL and CR groups in the absence of insulin. Insulin-stimulated groups with matching letters are not statistically different, and groups with differing letters are statistically (P ≤ 0.05) different from each other. Values are means ± SE, n = 6–10 per treatment group.
3.4. Filamin C phosphorylation
There was no significant difference between AL and CR groups for muscles incubated in the absence of insulin and without MK-2206 for Filamin CSer2213 phosphorylation (Fig. 4). For insulin-stimulated muscles incubated without MK-2206, Filamin CSer2213 phosphorylation of was significantly (P ≤ 0.05) greater for CR versus AL rats. Incubation of insulin-stimulated CR muscles with MK-2206 (0.5 μM) significantly (P ≤ 0.05) reduced Filamin CSer2213 phosphorylation compared to insulin-stimulated CR muscles incubated without MK-2206. Filamin CSer2213 phosphorylation was not significantly different in insulin-stimulated AL muscles versus insulin-stimulated CR muscles incubated with MK-2206.
Figure 4.
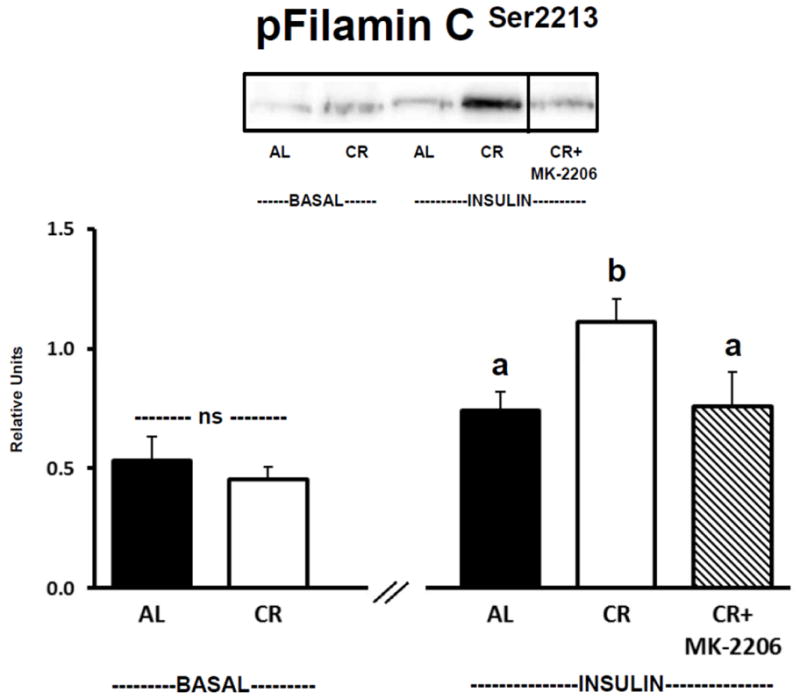
Filamin C Ser2213 phosphorylation (pFilamin CSer2213). See Fig. 1 legend for representative blot explanation. “ns” indicates no statistical difference between AL and CR groups in the absence of insulin. Insulin-stimulated groups with matching letters are not statistically different, and groups with differing letters are statistically (P ≤ 0.05) different from each other. Values are means ± SE, n = 6–11 per treatment group.
3.5. 2-Deoxy-D-glucose uptake
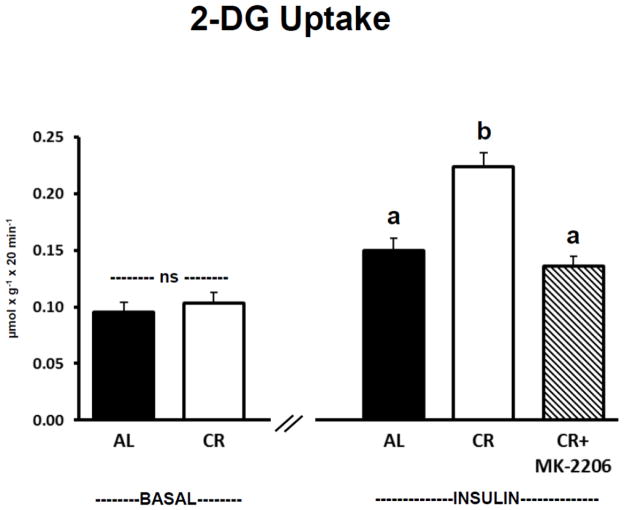
There was no significant difference between AL and CR groups for muscles incubated in the absence of insulin and without MK-2206 for 2-DG uptake (Fig. 5). For insulin-stimulated muscles incubated without MK-2206, 2-DG uptake was significantly (P ≤ 0.05) greater for CR versus AL rats. Incubation of insulin-stimulated CR muscles with MK-2206 (0.5 μM) significantly (P ≤ 0.05) reduced 2-DG uptake compared to insulin-stimulated CR muscles incubated without MK-2206. 2-DG uptake was not significantly different in insulin-stimulated AL muscles versus insulin-stimulated CR muscles incubated with MK-2206.
Figure 5.
2-Deoxy-D-glucose (2-DG) uptake. “ns” indicates no statistical difference between AL and CR groups in the absence of insulin. Insulin-stimulated groups with matching letters are not statistically different, and groups with differing letters are statistically (P ≤ 0.05) different from each other. Values are means ± SE, n = 9–15 per treatment group.
3.6. Insulin receptor phosphorylation
There was no significant difference between AL and CR groups for muscles incubated in the absence of insulin and without MK-2206 for IRTyr1162/1163 phosphorylation (Fig. 6). For insulin-stimulated muscles incubated without MK-2206, IRTyr1162/1163 phosphorylation was significantly (P ≤ 0.05) greater for CR versus AL rats. Insulin-stimulated CR muscles incubated with MK-2206 (0.5 μM) were not statistically different from insulin-stimulated CR muscles incubated without MK-2206, but were significantly (P ≤ 0.05) greater than insulin-stimulated AL muscles incubated without MK-2206.
Figure 6.
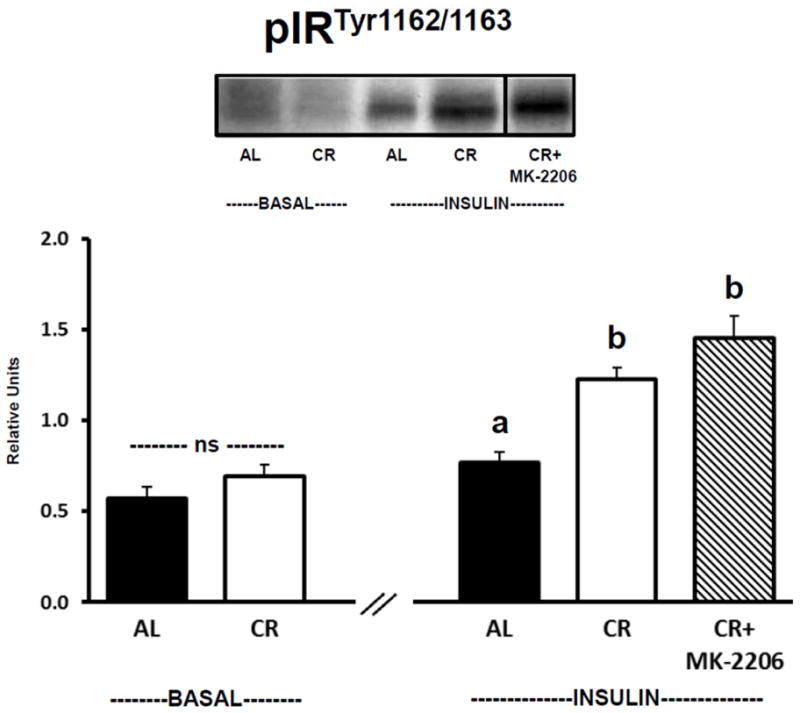
Insulin receptor Tyr1162/1163 phosphorylation (pIRTyr1162/1163). See Fig. 1 legend for representative blot explanation. “ns” indicates no statistical difference between AL and CR groups in the absence of insulin. Insulin-stimulated groups with matching letters are not statistically different, and groups with differing letters are statistically (P ≤ 0.05) different from each other. Values are means ± SE, n = 6–11 per treatment group.
3.7. Muscles incubated with 0.25 μM MK-2206
Muscles were evaluated using two MK-2206 doses (0.25 and 0.5 μM) to identify a dose that eliminated CR-effects on Akt2 phosphorylation, and the results revealed that 0.5 μM MK-2206 was effective for this purpose. Accordingly, the data with 0.5 μM MK-2206 were used for the statistical analyses, and only these data were shown in the representative blots of Fig. 1 to 4 and 6 (i.e., several lanes were removed from the images). However, supplementary figures without any lanes eliminated from the blots (Fig. S1–S5) are also available to demonstrate that no other modification was made to the images used in the representative blots. Examination of the supplementary figures reveals that the lower dose of MK-2206 (0.25 μM) did not appear to completely eliminate CR-induced increments for phosphorylation of Akt2Thr308 (Fig. S1), AS160Thr642 (Fig. S2) and Filamin CSer2213 (Fig. S3) or to completely eliminate the CR-induced increase in insulin-stimulated 2-DG uptake (Fig. S6). The CR-induced increase in Akt2Ser473 phosphorylation appeared to be eliminated with either MK-2206 dose (Fig. S4), and as expected, neither MK-2206 dose appeared to alter IRTyr1162/1163 phosphorylation (Fig. S5).
4. Discussion
CR’s effects on insulin sensitivity have been linked to Akt2 because CR increases insulin-stimulated phosphorylation of muscle Akt2 [10, 11, 18], and mice null for Akt2 have little or no CR-effects on muscle glucose uptake [10]. In this context, we previously hypothesized that the CR-induced elevation in insulin-stimulated pAkt2 is crucial for the CR-related improvement in muscle glucose uptake [10]. Akt2-null mice are completely lacking in this protein in all cells throughout life, and physiologic insulin doses have little or no ability to stimulate glucose uptake in muscles from Akt2-null mice. Accordingly, the results of transient inhibition of muscle Akt in the current study provide unique and valuable insights with regard to the mechanisms for CR effects on insulin-stimulated glucose uptake. The most significant new information from the current study was that incubation of isolated skeletal muscles with the dose (0.5 μM) of a potent and selective allosteric Akt inhibitor MK-2206 [22–25, 28–32], that eliminated the CR-induced increase in pAkt2Thr308 led to concomitant prevention of CR’s effects on both glucose uptake and Thr642 phosphorylation of AS160/TBC1D4 without altering pIRTyr1162/1163. The strikingly similar patterns for pAkt2Thr308, pAS160Thr642, and glucose uptake support the idea that CR’s effect on pAkt2Thr308 is instrumental for greater pAS160Thr642, which in turn, is crucial for increased glucose uptake.
We specifically assessed Akt2 phosphorylation because this isoform is crucial for insulin-mediated glucose uptake [14–17], but we also evaluated pan-Akt phosphorylation. Consistent with previous research, insulin-stimulated muscles from CR versus AL animals had greater pan-pAktThr308 and pan-pAktSer473 [11]. MK-2206 was similarly effective for reducing pAkt2Thr308 versus pan-pAktThr308 and for pAkt2Ser473 versus pan-pAktSer473. However, the relative magnitude of the inhibition by MK-2206 was somewhat greater for phosphorylation of Ser473 (80% for pAkt2 and 90% for pan-pAkt) compared to Thr308 (54% for pAkt2 and 60% for pan-pAkt). Akt is phosphorylated on Thr308 by 3-phosphoinositide-dependent protein kinase-1 (PDK1) and on Ser473 by mammalian target of rapamycin-2 (mTORC2) [33], but it is uncertain if the current results are related to the distinct kinases that are responsible for the two phosphorylation sites. Using MK-2206 with insulin-stimulated (100 nM) 3T3-L1 cells, Tan et al. [22] previously reported that the relative extent of inhibition was similar for pan-pAktSer473 versus pan-pAktThr308. It is unclear if the apparently different results of these two experiments are related to differences in the models studied (rat skeletal muscle versus 3T3-L1 cells), differences in insulin concentrations used (1.2 nM versus 100 nM) or something else. Regardless, it is notable that the inhibition of pAkt in both skeletal muscle and 3T3-L1 cells was accompanied by inhibition of insulin-stimulated glucose uptake.
Filamin C is an actin-binding protein that is highly expressed in skeletal muscle and believed to be involved with stabilizing and maintaining the structure of actin filament networks with cell membranes and/or act as a scaffolding protein [34, 35]. Insulin-regulated remodeling of actin filaments has been implicated in the control of both the spatial localization of insulin signaling proteins and translocation of GLUT4 glucose transporter vesicles [36]. Filamin C was previously identified as an Akt substrate that in C2C12 myocytes incubated with insulin becomes phosphorylated on Ser2213 [34]. Although the functional significance of the observed insulin-mediated and Akt-dependent phosphorylation of Filamin C on Ser2213 in skeletal muscle is uncertain, the current results for AS160 and Filamin C demonstrate that the CR-related increase in activation of Akt can be accompanied by greater phosphorylation of multiple Akt substrates.
Phosphorylation of the insulin receptor on Tyr1162/1163 is important for insulin-mediated glucose uptake. Replacement of insulin receptor tyrosine residues 1162 and 1163 compromises insulin-stimulated kinase activity and glucose uptake [37]. In the current study, insulin-stimulated muscles from CR versus AL rats were characterized by greater IRTyr1162/1163 phosphorylation. Most [11, 38–40], but not all [41] of the published studies that have evaluated CR effects on muscle IR function at submaximally effective insulin levels have not reported diet-related differences. The observation that MK-2206 eliminated the CR-induced increase in insulin-stimulated glucose uptake without attenuating IRTyr1162/1163 phosphorylation in the current study provides evidence that the CR effect on the IR was not sufficient for increasing glucose uptake.
5. Conclusions
This study provides compelling new evidence that the CR-induced increase in Akt2 phosphorylation is essential for CR’s effect on insulin-stimulated glucose uptake in skeletal muscle. The current results implicate the CR-induced increase in Akt2 phosphorylation as a key mediator of improved insulin sensitivity, a major health benefit of CR. It will be important for future studies to identify the mechanisms that account for enhanced insulin-stimulated phosphorylation of Akt2 in response to CR. Although the current results implicate AS160Thr642 as a likely contributor to the CR effect on glucose uptake, the functional consequences of greater Akt2-mediated phosphorylation of other Akt substrates (including Filamin C) will require further scrutiny.
Supplementary Material
Highlights.
Greater insulin sensitivity leads to improved health with calorie restriction (CR)
Enhanced insulin effects on Akt2 and glucose uptake in muscle are hallmarks of CR
Akt inhibitor MK-2206 eliminated these CR effects in isolated rat skeletal muscle
MK-2206 also eliminated CR effects on Akt2 substrates in insulin-stimulated muscle
CR effect on Akt2 in insulin-activated muscle is likely a key for health benefits
Acknowledgments
This research was supported by National Institute on Aging Grants AG-010026 and AG-013283. Naveen Sharma and Edward Arias contributed equally to this study.
Footnotes
Publisher's Disclaimer: This is a PDF file of an unedited manuscript that has been accepted for publication. As a service to our customers we are providing this early version of the manuscript. The manuscript will undergo copyediting, typesetting, and review of the resulting proof before it is published in its final citable form. Please note that during the production process errors may be discovered which could affect the content, and all legal disclaimers that apply to the journal pertain.
References
- 1.Omodei D, Fontana L. Calorie restriction and prevention of age-associated chronic disease. FEBS Lett. 2011;585:1537–1542. doi: 10.1016/j.febslet.2011.03.015. [DOI] [PMC free article] [PubMed] [Google Scholar]
- 2.Dolinsky VW, Dyck JR. Calorie restriction and resveratrol in cardiovascular health and disease. Biochim Biophys Acta. 2011;1812:1477–1489. doi: 10.1016/j.bbadis.2011.06.010. [DOI] [PubMed] [Google Scholar]
- 3.Gazdag AC, Dumke CL, Kahn CR, Cartee GD. Calorie restriction increases insulin-stimulated glucose transport in skeletal muscle from IRS-1 knockout mice. Diabetes. 1999;48:1930–1936. doi: 10.2337/diabetes.48.10.1930. [DOI] [PubMed] [Google Scholar]
- 4.Masoro EJ. Caloric restriction-induced life extension of rats and mice: a critique of proposed mechanisms. Biochim Biophys Acta. 2009;1790:1040–1048. doi: 10.1016/j.bbagen.2009.02.011. [DOI] [PubMed] [Google Scholar]
- 5.Gupta G, She L, Ma XH, Yang XM, Hu M, Cases JA, Vuguin P, Rossetti L, Barzilai N. Aging does not contribute to the decline in insulin action on storage of muscle glycogen in rats. Am J Physiol Regul Integr Comp Physiol. 2000;278:R111–117. doi: 10.1152/ajpregu.2000.278.1.R111. [DOI] [PubMed] [Google Scholar]
- 6.Kemnitz JW, Roecker EB, Weindruch R, Elson DF, Baum ST, Bergman RN. Dietary restriction increases insulin sensitivity and lowers blood glucose in rhesus monkeys. Am J Physiol. 1994;266:E540–547. doi: 10.1152/ajpendo.1994.266.4.E540. [DOI] [PubMed] [Google Scholar]
- 7.Kemnitz JW. Calorie restriction and aging in nonhuman primates. ILAR J. 2011;52:66–77. doi: 10.1093/ilar.52.1.66. [DOI] [PMC free article] [PubMed] [Google Scholar]
- 8.Fontana L, Partridge L, Longo VD. Extending healthy life span--from yeast to humans. Science. 2010;328:321–326. doi: 10.1126/science.1172539. [DOI] [PMC free article] [PubMed] [Google Scholar]
- 9.Anderson RM, Weindruch R. The caloric restriction paradigm: implications for healthy human aging. Am J Hum Biol. 2012;24:101–106. doi: 10.1002/ajhb.22243. [DOI] [PMC free article] [PubMed] [Google Scholar]
- 10.McCurdy CE, Cartee GD. Akt2 is essential for the full effect of calorie restriction on insulin-stimulated glucose uptake in skeletal muscle. Diabetes. 2005;54:1349–1356. doi: 10.2337/diabetes.54.5.1349. [DOI] [PubMed] [Google Scholar]
- 11.Sharma N, Arias EB, Bhat AD, Sequea DA, Ho S, Croff KK, Sajan MP, Farese RV, Cartee GD. Mechanisms for increased insulin-stimulated Akt phosphorylation and glucose uptake in fast- and slow-twitch skeletal muscles of calorie-restricted rats. Am J Physiol Endocrinol Metab. 2011;300:E966–978. doi: 10.1152/ajpendo.00659.2010. [DOI] [PMC free article] [PubMed] [Google Scholar]
- 12.Wetter TJ, Gazdag AC, Dean DJ, Cartee GD. Effect of calorie restriction on in vivo glucose metabolism by individual tissues in rats. Am J Physiol. 1999;276:E728–738. doi: 10.1152/ajpendo.1999.276.4.E728. [DOI] [PubMed] [Google Scholar]
- 13.Petersen KF, Dufour S, Morino K, Yoo PS, Cline GW, Shulman GI. Reversal of muscle insulin resistance by weight reduction in young, lean, insulin-resistant offspring of parents with type 2 diabetes. Proc Natl Acad Sci U S A. 2012 doi: 10.1073/pnas.1205675109. [DOI] [PMC free article] [PubMed] [Google Scholar]
- 14.Bae SS, Cho H, Mu J, Birnbaum MJ. Isoform-specific regulation of insulin-dependent glucose uptake by Akt/protein kinase B. J Biol Chem. 2003;278:49530–49536. doi: 10.1074/jbc.M306782200. [DOI] [PubMed] [Google Scholar]
- 15.Hill MM, Clark SF, Tucker DF, Birnbaum MJ, James DE, Macaulay SL. A role for protein kinase Bbeta/Akt2 in insulin-stimulated GLUT4 translocation in adipocytes. Mol Cell Biol. 1999;19:7771–7781. doi: 10.1128/mcb.19.11.7771. [DOI] [PMC free article] [PubMed] [Google Scholar]
- 16.Katome T, Obata T, Matsushima R, Masuyama N, Cantley LC, Gotoh Y, Kishi K, Shiota H, Ebina Y. Use of RNA interference-mediated gene silencing and adenoviral overexpression to elucidate the roles of AKT/protein kinase B isoforms in insulin actions. J Biol Chem. 2003;278:28312–28323. doi: 10.1074/jbc.M302094200. [DOI] [PubMed] [Google Scholar]
- 17.Ng Y, Ramm G, Lopez JA, James DE. Rapid activation of Akt2 is sufficient to stimulate GLUT4 translocation in 3T3-L1 adipocytes. Cell Metab. 2008;7:348–356. doi: 10.1016/j.cmet.2008.02.008. [DOI] [PubMed] [Google Scholar]
- 18.McCurdy CE, Davidson RT, Cartee GD. Brief calorie restriction increases Akt2 phosphorylation in insulin-stimulated rat skeletal muscle. Am J Physiol Endocrinol Metab. 2003;285:E693–700. doi: 10.1152/ajpendo.00224.2003. [DOI] [PMC free article] [PubMed] [Google Scholar]
- 19.Kane S, Sano H, Liu SC, Asara JM, Lane WS, Garner CC, Lienhard GE. A method to identify serine kinase substrates. Akt phosphorylates a novel adipocyte protein with a Rab GTPase-activating protein (GAP) domain. J Biol Chem. 2002;277:22115–22118. doi: 10.1074/jbc.C200198200. [DOI] [PubMed] [Google Scholar]
- 20.Gonzalez E, McGraw TE. Insulin signaling diverges into Akt-dependent and -independent signals to regulate the recruitment/docking and the fusion of GLUT4 vesicles to the plasma membrane. Mol Biol Cell. 2006;17:4484–4493. doi: 10.1091/mbc.E06-07-0585. [DOI] [PMC free article] [PubMed] [Google Scholar]
- 21.Kramer HF, Witczak CA, Fujii N, Jessen N, Taylor EB, Arnolds DE, Sakamoto K, Hirshman MF, Goodyear LJ. Distinct signals regulate AS160 phosphorylation in response to insulin, AICAR, and contraction in mouse skeletal muscle. Diabetes. 2006;55:2067–2076. doi: 10.2337/db06-0150. [DOI] [PubMed] [Google Scholar]
- 22.Tan S, Ng Y, James DE. Next-generation Akt inhibitors provide greater specificity: effects on glucose metabolism in adipocytes. Biochem J. 2011;435:539–544. doi: 10.1042/BJ20110040. [DOI] [PubMed] [Google Scholar]
- 23.Cherrin C, Haskell K, Howell B, Jones R, Leander K, Robinson R, Watkins A, Bilodeau M, Hoffman J, Sanderson P, Hartman G, Mahan E, Prueksaritanont T, Jiang G, She QB, Rosen N, Sepp-Lorenzino L, Defeo-Jones D, Huber HE. An allosteric Akt inhibitor effectively blocks Akt signaling and tumor growth with only transient effects on glucose and insulin levels in vivo. Cancer Biol Ther. 2010;9:493–503. doi: 10.4161/cbt.9.7.11100. [DOI] [PMC free article] [PubMed] [Google Scholar]
- 24.Hirai H, Sootome H, Nakatsuru Y, Miyama K, Taguchi S, Tsujioka K, Ueno Y, Hatch H, Majumder PK, Pan BS, Kotani H. MK-2206, an allosteric Akt inhibitor, enhances antitumor efficacy by standard chemotherapeutic agents or molecular targeted drugs in vitro and in vivo. Mol Cancer Ther. 2010;9:1956–1967. doi: 10.1158/1535-7163.MCT-09-1012. [DOI] [PubMed] [Google Scholar]
- 25.Yan L. MK-2206: a potent oral allosteric AKT inhibitor. AACR Annual Meeting; 2009. p. Abstract Number: DDT01–01. [Google Scholar]
- 26.Cartee GD, Bohn EE. Growth hormone reduces glucose transport but not GLUT-1 or GLUT-4 in adult and old rats. Am J Physiol. 1995;268:E902–909. doi: 10.1152/ajpendo.1995.268.5.E902. [DOI] [PubMed] [Google Scholar]
- 27.Hansen PA, Gulve EA, Holloszy JO. Suitability of 2-deoxyglucose for in vitro measurement of glucose transport activity in skeletal muscle. J Appl Physiol. 1994;76:979–985. doi: 10.1152/jappl.1994.76.2.979. [DOI] [PubMed] [Google Scholar]
- 28.Pal SK, Reckamp K, Yu H, Figlin RA. Akt inhibitors in clinical development for the treatment of cancer. Expert Opin Investig Drugs. 2010;19:1355–1366. doi: 10.1517/13543784.2010.520701. [DOI] [PMC free article] [PubMed] [Google Scholar]
- 29.Yap TA, Yan L, Patnaik A, Fearen I, Olmos D, Papadopoulos K, Baird RD, Delgado L, Taylor A, Lupinacci L, Riisnaes R, Pope LL, Heaton SP, Thomas G, Garrett MD, Sullivan DM, de Bono JS, Tolcher AW. First-in-man clinical trial of the oral pan-AKT inhibitor MK-2206 in patients with advanced solid tumors. J Clin Oncol. 2011;29:4688–4695. doi: 10.1200/JCO.2011.35.5263. [DOI] [PubMed] [Google Scholar]
- 30.Bilodeau MT, Balitza AE, Hoffman JM, Manley PJ, Barnett SF, Defeo-Jones D, Haskell K, Jones RE, Leander K, Robinson RG, Smith AM, Huber HE, Hartman GD. Allosteric inhibitors of Akt1 and Akt2: a naphthyridinone with efficacy in an A2780 tumor xenograft model. Bioorg Med Chem Lett. 2008;18:3178–3182. doi: 10.1016/j.bmcl.2008.04.074. [DOI] [PubMed] [Google Scholar]
- 31.Kettle JG, Brown S, Crafter C, Davies BR, Dudley P, Fairley G, Faulder P, Fillery S, Greenwood H, Hawkins J, James M, Johnson K, Lane CD, Pass M, Pink JH, Plant H, Cosulich SC. Diverse heterocyclic scaffolds as allosteric inhibitors of AKT. J Med Chem. 2012;55:1261–1273. doi: 10.1021/jm201394e. [DOI] [PubMed] [Google Scholar]
- 32.Cheng Y, Zhang Y, Zhang L, Ren X, Huber-Keener KJ, Liu X, Zhou L, Liao J, Keihack H, Yan L, Rubin E, Yang JM. MK-2206, a novel allosteric inhibitor of Akt, synergizes with gefitinib against malignant glioma via modulating both autophagy and apoptosis. Mol Cancer Ther. 2012;11:154–164. doi: 10.1158/1535-7163.MCT-11-0606. [DOI] [PMC free article] [PubMed] [Google Scholar]
- 33.Gonzalez E, McGraw TE. The Akt kinases: isoform specificity in metabolism and cancer. Cell Cycle. 2009;8:2502–2508. doi: 10.4161/cc.8.16.9335. [DOI] [PMC free article] [PubMed] [Google Scholar]
- 34.Murray JT, Campbell DG, Peggie M, Mora A, Cohen P. Identification of filamin C as a new physiological substrate of PKBalpha using KESTREL. Biochem J. 2004;384:489–494. doi: 10.1042/BJ20041058. [DOI] [PMC free article] [PubMed] [Google Scholar]
- 35.Fujita M, Mitsuhashi H, Isogai S, Nakata T, Kawakami A, Nonaka I, Noguchi S, Hayashi YK, Nishino I, Kudo A. Filamin C plays an essential role in the maintenance of the structural integrity of cardiac and skeletal muscles, revealed by the medaka mutant zacro. Dev Biol. 2012;361:79–89. doi: 10.1016/j.ydbio.2011.10.008. [DOI] [PubMed] [Google Scholar]
- 36.Zaid H, Antonescu CN, Randhawa VK, Klip A. Insulin action on glucose transporters through molecular switches, tracks and tethers. Biochem J. 2008;413:201–215. doi: 10.1042/BJ20080723. [DOI] [PubMed] [Google Scholar]
- 37.Ellis L, Clauser E, Morgan DO, Edery M, Roth RA, Rutter WJ. Replacement of insulin receptor tyrosine residues 1162 and 1163 compromises insulin-stimulated kinase activity and uptake of 2-deoxyglucose. Cell. 1986;45:721–732. doi: 10.1016/0092-8674(86)90786-5. [DOI] [PubMed] [Google Scholar]
- 38.Bak JF, Moller N, Schmitz O, Saaek A, Pedersen O. In vivo insulin action and muscle glycogen synthase activity in type 2 (non-insulin-dependent) diabetes mellitus: effects of diet treatment. Diabetologia. 1992;35:777–784. doi: 10.1007/BF00429100. [DOI] [PubMed] [Google Scholar]
- 39.Balage M, Grizard J, Manin M. Effect of calorie restriction on skeletal muscle and liver insulin binding in growing rat. Horm Metab Res. 1990;22:207–214. doi: 10.1055/s-2007-1004886. [DOI] [PubMed] [Google Scholar]
- 40.Cecchin F, Ittoop O, Sinha MK, Caro JF. Insulin resistance in uremia: insulin receptor kinase activity in liver and muscle from chronic uremic rats. Am J Physiol. 1988;254:E394–401. doi: 10.1152/ajpendo.1988.254.4.E394. [DOI] [PubMed] [Google Scholar]
- 41.Wang ZQ, Bell-Farrow AD, Sonntag W, Cefalu WT. Effect of age and caloric restriction on insulin receptor binding and glucose transporter levels in aging rats. Exp Gerontol. 1997;32:671–684. doi: 10.1016/s0531-5565(97)00054-5. [DOI] [PubMed] [Google Scholar]
Associated Data
This section collects any data citations, data availability statements, or supplementary materials included in this article.


