

Abstract
The hepatotoxicity of thioacetamide (TA) has been known since 1948. In rats, single doses cause centrilobular necrosis accompanied by increases in plasma transaminases and bilirubin. To elicit these effects TA requires oxidative bioactivation leading first to its S-oxide (TASO) and then to its chemically reactive S,S-dioxide (TASO2) which ultimately modifies amine-lipids and proteins. To generate a suite of liver proteins adducted by TA metabolites for proteomic analysis, and to reduce the need for both animals and labeled compounds, we treated isolated hepatocytes directly with TA. Surprisingly, TA was not toxic at concentrations up to 50 mM for 40 hr. On the other hand, TASO was highly toxic to isolated hepatocytes as indicated by LDH release, cellular morphology and vital staining with Hoechst 33342/propidium iodide. TASO toxicity was partially blocked by the CYP2E1 inhibitors diallyl sulfide and 4-methylpyrazole, and was strongly inhibited by TA. Significantly, we found that hepatocytes produce TA from TASO relatively efficiently by back-reduction. The covalent binding of [14C]-TASO is inhibited by unlabeled TA which acts as a “cold-trap” for [14C]-TA and prevents its re-oxidation to [14C]-TASO. This in turn increases the net consumption of [14C]-TASO despite the fact that its oxidation to TASO2 is inhibited. The potent inhibition of TASO oxidation by TA, coupled with the back-reduction of TASO and its futile redox cycling with TA may help explain phenomena previously interpreted as “saturation toxicokinetics” in the in vivo metabolism and toxicity of TA and TASO. The improved understanding of the metabolism and covalent binding of TA and TASO facilitates the use of hepatocytes to prepare protein adducts for target protein identification.
Introduction
Despite considerable study aimed at avoidance and mechanistic understanding, liver injury by drugs and chemicals remains a signficant challenge in medicine and the pharmaceutical industry. A number of compounds have been used as model hepatotoxicants to facilitate investigation of various aspects of the overall problem. Examples include acetaminophen, bromobenzene, chloroform, diclofenac, thiobenzamide and many others. The experimental hepatotoxicity of thioacetamide (TA) in rodents was first studied in 1948 in response to its detection in orange juice following its use as a fungicide in orange groves.1 Single doses of TA in the range of 1–2 mmol/kg cause classical centilobular necrosis accompanied by rises in serum transaminases and bilirubin. Chronic administration of TA in the diet causes liver cancer in male rats including hepatocellular carcinoma, cholangiocarcinoma and papillary adenocarcinoma.2, 3 More recently, the in vivo use of TA in rodents as a model hepatotoxin produced highly selective liver damage including cirrhosis,4 fibrosis5 as well as hepatic necrosis/apoptosis.6
TA requires metabolic activation to elicit its toxicity.7, 8 As shown in Scheme 1, activation of TA occurs via two oxidations, leading first to its S-oxide (TASO, 2) and then to its chemically reactive S,S-dioxide (TASO2). The latter, which can potentially exist in two tautomeric forms (3 and 4), then reacts with proteins by modifying lysine side chains. This presumably leads to impairment of function and cytotoxicity. The oxidation of TA and TASO can be carried out by both hepatic cytochrome P450 enzymes and by the FAD-containing monooxygenase (FMO), but the relative contributions of these enzymes vary under different conditions in vivo (see Discussion section).
Scheme 1.

Formation and reactivity of TA metabolites. In rat hepatocytes, thioacetamide (1) undergoes reversible S-oxidation to TASO (2). Further oxidation generates the highly reactive species TASO2 (represented by tautomers 3 and 4). TASO2 can directly imidoylate amine groups (R-NH2) on cellular proteins or PE phospholipids (7). It can also react with water to form the stable metabolite acetamide (6), or the reactive derivative acetyl sulfinic acid (5) which reacts with protein amine groups to form amide derivatives (8). The latter do not form via hydrolysis of the stable amidine adducts (7). For further details see ref. 22.
Our main interest in thioacetamide metabolism and toxicity was initially to identify the proteins adducted by its reactive metabolites and compare them to those adducted by its congener thiobenzamide9, 10 and other chemically reactive metabolites.11 To reduce the need for both animals and labeled compounds we planned to use isolated rat hepatocytes to generate protein adducts, but the literature contained only two reports on the effect of TA on hepatocytes, one indicating that TA was not toxic to rat hepatocytes12 and one indicating that it was.13 Therefore we first re-examined this issue. Our initial results confirmed that TA, at concentrations up to 50 mM for 40 hr, is indeed almost non-toxic to isolated hepatocytes. This obviously stands in strong contrast to the well-known toxicity of thioacetamide in vivo and calls for explanation. We therefore extended our investigation into the metabolism and toxicity of TA and TASO in isolated hepatocytes. Our results indicate that although hepatocytes oxidize TA to TASO very efficiently, negligible covalent binding or toxicity occur under these conditions. Hepatocytes also reduce TASO back to TA in a futile metabolic cycle. Importantly, we find that TA is a very potent inhibitor of the further oxidation of TASO to its reactive metabolite TASO2. This may explain why TA only slowly leads to toxicity in vivo, and why both TA and TASO appear to show saturation toxicokinetics in vivo.14, 15
Experimental Procedures
Materials
4-Methylpyrazole, diallyl sulfide, thioacetamide, collagenase type IV and Percoll were purchased from Sigma-Aldrich (St. Louis, MO). TASO and [14C]-TASO were synthesized according to a literature procedure.16 HPLC grade solvents and analytical grade inorganic salts as well as Tween-20 and bromophenol blue were obtained from Fisher (www.fisher.com). Dulbecco’s Modified Eagle Medium (DMEM) was purchased from Cellgro (www.cellgro.com). Williams’ Medium E (WME), Hoechst 33342 and propidium iodide (H/PI) were purchased from Gibco-Invitrogen (www.invitrogen.com), and LDH assay kits were purchased from Takara-Bio (www.clontech.com/takara). Tris, SDS, glycine, acrylamide, N,N-methylene-bis-acrylamide, TEMED, ammonium persulfate, PVDF membrane for protein blotting (0.2 micron pore size), and Quick-start Bradford protein assay kit were obtained from Bio-Rad (www.bio-rad.com). Polyclonal antibody reactive toward rat, mouse and human CYP2E1 was obtained from Millipore (www.millipore.com). The anti-β-actin antibody was obtained from NeoMarkers (www.labvision.com). The goat anti-rabbit IgG-HRP-conjugated antibody was obtained from Santa Cruz biotechnology (www.scbt.com). Protease Inhibitor Cocktail and ECL western blotting kit were obtained from Thermo-Scientific (www.piercenet.com). Silica gel TLC plates, type LK5DF with a pre-adsorbent loading zone, were obtained from Whatman (www.whatman.com). Deionized water (resistivity 18.2 MΩ/cm) was used for preparation of all solutions and buffers.
Animals
Male Sprague-Dawley rats from Charles River Laboratories (www.criver.com) were housed in a temperature and humidity controlled room with a 12 h light/dark cycle and ad libitum access to food and water. All animal husbandry protocols were in accordance with the NIH Guide for the Care and Use of Laboratory Animals.17 Experimental procedures were approved by the Institutional Animal Care and Use Committee of the University of Kansas.
Preparation and Incubation of Isolated Hepatocytes
Hepatocytes from non-induced male Sprague-Dawley rats (175–275 g) were isolated using a previously described protocol.18 Initial cell viability (85–95%) was assessed using trypan blue exclusion. For toxicity studies cells were plated on collagen-coated 6-well plates at 7 × 10⁵ live cells/well in 2.0 mL of medium A (DMEM supplemented with 5% FBS, 100 nM dexamethasone, 4 mg of human recombinant insulin/L, 2 mM L-glutamine, and 1% Pen-Strep; all from Gibco-Invitrogen, (www.invitrogen.com). After incubating for 3 h at 37° in an atmosphere of 5% CO2 in air to allow attachment, the cells were washed twice with warm phosphate buffered saline (PBS, pH 7.4). After attachment cell viability was >98% according to H/PI staining. Incubations were started by adding pre-warmed WME supplemented with 1% ITS, 1% Pen-Strep, 2 mM L-glutamine, and 100 nM dexamethasone (3.0 mL/well) and returning the plates to the incubator. When used, test compounds were included in the medium added after the PBS wash.
Cytotoxicity Monitoring
At appropriate times aliquots of culture medium (100 μL) were removed for analysis of LDH according to the assay kit manufacturer’s instructions except that all volumes were reduced by half. For measurement of total LDH content, 0.1 vol of Triton X-100 solution (10% w/v in water) was added directly to wells containing untreated cells in WME immediately after the attachment period. LDH asssays were conducted in duplicate and values agreed within ± 5% or less. In many cases, cells in 12-well plates were also observed and photographed using an epi-fluorescence microscope (Olympus IX-81) with a computer-controlled mechanical stage, automated shutter and filters (Sutter Instrument), temperature, humidity, and CO2 control. Images were collected every 10 minutes for 18 hr using a 20× objective with a numerical aperture of 0.45 (Olympus), an EMCCD camera (Hamamatsu Photonics) and the Slidebook image acquisition and processing package (www.intelligent-imaging.com). At the end of the exposure period cells were stained with H/PI and rephotographed to count live/dead cells.
Metabolism and Covalent Binding Studies
Incubations (1.0 mL) were conducted in 50 mL screw-cap round bottom culture tubes in medium A. The cell density was 7–8 × 10⁶ live cells/mL medium A. Before adding cells to the tube the required amounts of [14C]-TA or [14C]-TASO were deposited by evaporation in vacuo from a small volume of methanol (50–100 μL). Other compounds were dissolved in the incubation medium. Incubation tubes were then gassed with 5% CO2 in oxygen, capped, and incubated at 37 °C with shaking at 100 Hz. At indicated times 100 μL aliquots were removed, quenched with 11 μL of Triton X-100 solution (10% w/v in water), and either analyzed immediately or frozen at −80 °C for later analysis.
Soluble and covalently bound metabolites were separated by thin-layer chromatography on Whatman LK5DF plates (www.whatman.com) which have an inert loading zone suitable for adding aqueous solutions. Duplicate 10–20 μL aliquots of quenched incubation mixtures along with standards of TA, TASO and acetamide were applied in the loading zone of the TLC plate. After air drying for 15 min, the plate was developed using a solvent system of 8% MeOH in ethyl acetate. The loading zone and individual bands of silica corresponding to standards were scraped into scintillation vials for counting. Covalent binding was determined as 14C retained in the loading zone.
To minimize the effect of differences between individual preparations of hepatocytes in metabolism studies, each experiment was performed using cells from a single preparation. Each experiment illustrated here is typical based on results of two to four preliminary range-finding experiments performed to optimize the selection of times and concentrations. In the experiments illustrated a smooth monotonic progression of the observed (dependent) variable was judged to be more telling than a statistical analysis of repeated measurements of a single endpoint.
Western Blot Analysis for CYP2E1
Attached cells from 2 wells (1.3 × 10⁶ cells) were harvested by scraping, pelleted and stored at −80°C. The cell pellet was removed from −80 °C and thawed on ice. The pellets were resuspended in 1 mL homogenization buffer (50 mM Tris-HCl, pH 7.4; 150 mM KCl; 2 mM EDTA) containing protease inhibitors. A Dounce homogenizer was used to disrupt the cells using 30 strokes on ice. Microsomes were isolated using the 3-step centrifugation method. Briefly, cell lysates were subjected to centrifugation at 500 × g for 15 min at 4 °C. The supernatant was transferred to a new microcentrifuge tube and was subjected to a second centrifugation at 13,000 × g for 15 min at 4°C. The resulting supernatant was subjected to a third centrifugation at 108,000 × g for 1 h at 4 °C. Resulting microsomal pellets were resuspended in 15 μL of 250 mM sucrose.
Protein concentrations in the microsome samples were determined using the Bio-Rad Bradford kit using standard methods. Aliquots (17 μg/group) were solubilized in SDS-PAGE gel loading buffer containing 100 mM Tris-HCl (pH 6.8), 4% (w/v) SDS, 0.02% (w/v) bromophenol blue, 20% (v/v) glycerol, and 50 mM DTT. Samples were heated to 98 °C for 5 min followed by centrifugation for 4 min at 20,000 × g and placed on ice. Samples were subjected to 10% SDS-polyacrylamide gel electrophoresis. Gels were transferred to PVDF membrane. Immunoblot analysis was performed to detect relative CYP2E1 expression levels using anti-CYP2E1 and anti-β-actin antibodies. Following transfer, membranes were blocked for 1 h at room temperature in blocking buffer (13 mM Tris-HCl, 150 mM NaCl, 0.05% Tween-20, 2% nonfat dry milk, pH 7.8), and subsequently incubated with an anti-CYP2E1-peptide antibody diluted 1: 2,000 or anti-β-actin antibody diluted 1: 10,000 in blocking buffer at 4 °C overnight. The membranes were washed using wash buffer (13 mM Tris-HCl, 150 mM NaCl, 0.05% Tween-20, pH7.8), incubated with goat anti-rabbit IgG-HRP-conjugated antibody for 1 h at room temperature and washed again using wash buffer. The immunoreactive protein was detected using a chemiluminescence substrate for horseradish peroxidase. Band densities were integrated using Doc-IT LS image analysis software from UVP (www.uvp.com) and are reported as relative expression levels.
Results
Cytotoxicity of TA and TASO
The hepatotoxicity of thioacetamide has been very well characterized in vivo but it has not been much studied in isolated hepatocytes.12, 13 Since our objective was to use isolated hepatocytes to elucidate the reactive metabolite target proteome of TA, we sought first to define exposure conditions that would be toxicologically relevant for generating adducted proteins. We were thus surprised to find that treating hepatocytes with up to 50 mM TA for 40 hr did not elicit toxicity as assessed by measurement of cytosolic LDH release (Figure 1). To confirm this effect phenotypically, we also used microscopy (including time-lapse movies); these results will be described below.
Figure 1.

Cytotoxicity of TA toward isolated hepatocytes shown as the time dependence of cytosolic LDH release in response to the indicated concentrations of TA. Cells only refers to untreated (control) cells.
Because thioamides require two steps of oxidation to generate reactive metabolites (Scheme 1), we synthesized and evaluated TASO in isolated hepatocytes. When synthesizing TASO for these studies we used sub-stoichiometric amounts of hydrogen peroxide to avoid over-oxidation. Preliminary experiments suggested that the toxicity of the product varied inversely with the amount of residual TA. When TA was removed by column chromatography TASO was found to be a highly potent and reproducible cytotoxin, dramatically more toxic than TA itself, as shown by its time- and concentration-dependent effects on LDH release (Figure 2, top). This was confirmed by H/PI staining to count live/dead cell numbers (Figure 2, bottom). In addition, microscopy showed that TASO also induces dramatic changes in the appearance and activity of hepatocytes in a time- and concentration dependent manner (see below).
Figure 2.

Cytotoxicity of TASO to isolated hepatocytes. The top panel shows the time dependence of cytosolic LDH release in response to the indicated concentrations of TASO. The bottom panel shows the effect of TASO on cell viability as indicated by H/PI staining.
Effect of Metabolic Inhibitors on TASO Toxicity
CYP2E1 plays a significant role in the bioactivation and subsequent toxicity of TA and TASO in vivo (see Discussion section). Figure 3 shows that both diallyl sulfide, which blocks the toxicity of TASO in vivo,19 and 4-methylpyrazole, another CYP2E1 inhibitor, also block the cytotoxicity of TASO in rat hepatocytes. Since preiminary studies suggested that residual TA diminished the toxicity of chemically synthesized TASO, we confirmed this directly by adding TA back to purified TASO. As shown by the LDH release data in the top panel of Figure 4, as little as 2.5 mM TA completely blocks the toxicity of 1 mM TASO over a 40 hr time course as. The protective effect of TA against the cytotoxicity of TASO is also reflected in live/dead cell counts (Figure 4, bottom panel) and by phenotypic microscopy (see microscopy section below).
Figure 3.

Protective effect of diallyl sulfide (DAS, top panel) and 4-methylpyrazole (4MP, bottom panel) against TASO cytotoxicity.
Figure 4.
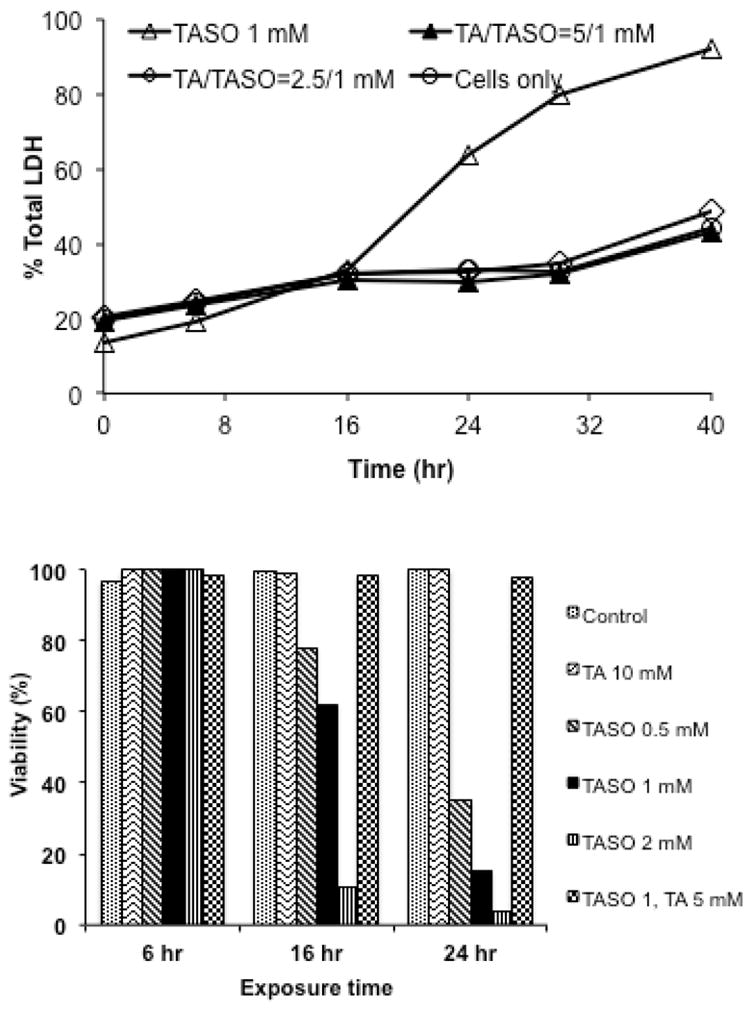
Protective effect of TA against TASO cytotoxicity as reflected in inhibition of cytosolic LDH release (top panel) and maintenance of cell viability by H/PI staining (bottom panel).
Effect of TA on CYP2E1 in Isolated Hepatocytes
When freshly isolated hepatocytes are cultured, cytochrome P450 enzyme levels decline markedly in just 48 hr.20, 21 Many substrates and inhibitors of CYP2E1 such as ethanol, isoniazid or pyridine that bind at its active site stabilize the protein and prevent or minimize the rate of its decline in cell culture. Since TA has a pronounced effect in inhibiting TASO toxicity (and metabolism, see below), we tested TA for its ability to maintain CYP2E1 in cultured hepatocytes. Figure 5 illustrates the loss of CYP2E1, as measured by Western blotting, over time as hepatocytes are maintained in culture. It also shows that 5 mM TA significantly reduces this loss, approximately as well as 0.5 mM isoniazid, but not quite as well as 20 mM ethanol, a substrate and classical “inducer” of CYP2E1.
Figure 5.
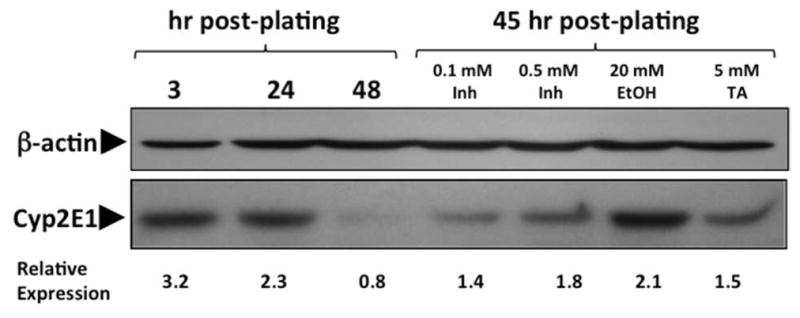
Quantitation of CYP2E1 in Rat Hepatocytes. Rat hepatocytes were isolated, cultured and treated as indicated on the figure. Equal amounts of microsomal protein were resolved using 10% SDS-PAGE.
Metabolism and Covalent Binding of TA and TASO in Isolated Hepatocytes
Because of the high polarity and water solubility of TA, TASO and acetamide, we used thin layer chromatography to separate and quantitate metabolites of [14C]-TASO. This system had several advantages: 1) incubations could be quenched by adding cold standards in a strong detergent solution to lyse cells and stop enzymatic activity under chemically mild conditions; 2) an aliquot of the entire solubilized mixture including proteins could be transferred to the loading zone of the TLC plate; and 3) after chromatographic development the loading zone could be scraped and counted to determine protein covalent binding. In our initial attempt we incubated a high concentration of [14C]-TA (100 mM) with a high density of hepatocytes (7.5 × 10⁶ cells/mL) in complete medium for 4.5 hr under an atmosphere of Carbox (O2/CO2, 95:5). TLC analysis showed ca. 6% conversion of TA to TASO along with very low amounts of acetamide (AA) and covalent binding (CVB) (Figure 6, top). Since the substrate concentration was initially 100 mM, the 6% conversion of TA to TASO corresponds to an oxidation rate of 178 nmol/hr/million cells, or approximately 3 nmol/min/mg total cellular protein. The high yield of TASO formed shows that TA is a very good substrate for hepatocellular oxygenases. Importantly, it also shows that the [14C]-TASO produced is quite stable in solution under standard incubation conditions. It is also worth noting that in the absence of a large excess of TA, the final concentration of TASO produced (i.e., 6 mM) would have been sufficient to kill all the cells within a few hours. A subsequent experiment in which hepatocytes were incubated with [14C]-TASO showed that TASO consumption, acetamide formation and covalent binding were all linear over time for at least 6 hr (Figure 6, bottom). The occurrence of acetamide formation and covalent binding in this experiment with TASO, but not in the experiment with a high concentration of TA alone, is very significant in relationship to the lack of cytotoxicity with TA alone. As we found earlier with thiobenzamide,9, 10 the covalent binding from TASO was found to involve the modification of both PE lipids22 and proteins, and the efficiency of modification following TASO treatment is relatively high (ca. 67 nmol-equiv./mg cellular lipid and ca. 20 nmol-equiv./mg protein).
Figure 6.
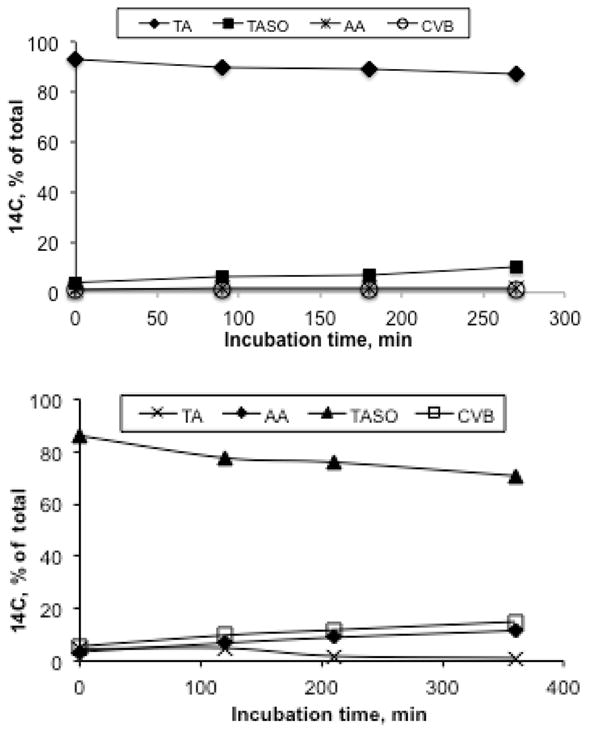
Biotransformation of [14C]-TA (100 mM, top panel) and [14C]-TASO (10 mM, bottom panel) by isolated rat hepatocytes. Incubations were conducted using 7.5 × 10⁶ cells suspended in 1 mL medium containing the indicated initial substrate concentration. At the indicated times aliquots (0.1 mL) were withdrawn and quenched with strong detergent prior to analysis by TLC. The 6% conversion of TA to TASO (top panel) results in a TASO concentration of 6 mM, corresponding to an average oxidation rate of 178 nmol/hr/mg total cellular protein.
Effect of TA on Metabolism of TASO in Isolated Hepatocytes
In earlier experiments is was observed that the presence of residual TA appeared to inhibit the metabolism (as well as the toxicity) of TASO. We therefore conducted an experiment in which we deliberately added an equimolar amount of non-radioactive TA to a sample of purified [14C]-TASO and used the mixture to follow the metabolism of [14C]-TASO. In this experiment it is important to realize that while the nonradioactive TA is active chemically and biochemically, it is not apparent in the radiometric analysis of metabolites. Figures 7A and 7B show the effect of 10 mM TA on the formation of acetamide (AA) and covalently bound residues (CVB) arising from the metabolism of 10 mM [14C]-TASO. As expected, an inhibitory effect is clearly seen (dark bars) across the entire incubation. In these incubations, it was observed that a small amount of TASO is also reduced back to [14C]-TA (Figure 7C, open bars). Although the reduction of TASO has not been previously reported, related reductions of sulfoxides and thioamide S-oxides are well known reactions in xenobiotic metabolism.23 Finally, Figure 7D shows that TA, a supposed inhibitor of TASO oxidation, actually stimulates the metabolic consumption of TASO in hepatocytes. While this result may at first seem counter-intuitive, it does have a reasonable and logical explanation (see Discussion).
Figure 7.

Effect of unlabeled TA (10 mM) on metabolism and covalent binding of [14C]-TASO (10 mM) by isolated hepatocytes (7.5 × 10⁶ cells/mL).
Observations of TASO Toxicity to Hepatocytes by Microscopy
Cells were allowed to attach in standard culture medium for 3 hr prior to the start of a 18 hr exposure period. They were photographed at 10 min intervals throughout the exposure period to allow the compilation of time-lapse movies of their response to different treatments. Freshly isolated hepatocytes are more-or-less spherical in suspension but when they settle they readily attach to collagen coated plates and grow well for several days in maintenance medium. During the first 2–3 hours of attachment the cells become progressively flatter as they spread out on the collagen and make cell-cell contacts, and there is considerable intracellular as well as intercellular motion. After three hours of attachment and a further 18 hr of culture in control medium untreated cells appear as shown in panel A01 of Figure 8. Panels A02 and A03 show cells after 18 hr exposure to 1.5 mM TASO or 4.5 mM TASO, respectively. At this time all the cells are dead, but the time-lapse movies clearly show a faster onset of toxicity at the higher exposure concentration. The movies also show the formation and apparent bursting of large cytoplasmic protrusions or blebs just before the cells become motionless. Panel B01 shows that the presence of TA (20 mM) has no observable effect on the attachment of cells or their progression in culture. Furthermore, in the presence of 20 mM TA, the toxic effects of 1.5 mM TASO are completely prevented (Figure 8, panel B02) while the toxic effects of 4.5 mM TASO are substantially prevented (Figure 8, panel B03). Time-lapse movies of the cells throughout the entire process of responding to these treatments are available as Supporting Information.
Figure 8.

Cytotoxicity of TASO and protective effects of TA on hepatocytes in culture. Cells were allowed to attach in standard culture medium for 3 hr prior to the start of a 18 hr exposure period, and they were photographed at 10 min intervals throughout the exposure period. The six photos shown are the last frame of each of the six time-lapse movies that document the behavior of the cells throughout the exposure period. The complete movies are available as Supporting Information. Panel A01 shows untreated control cells; they are normal in appearance. Panels A02 and A03 show cells after 18 hr exposure to 1.5 mM TASO or 4.5 mM TASO, respectively; these cells have all died. Panel B01 shows cells exposed to 20 mM TA in medium; no toxic effects are apparent. Panels B02 and B03 show the protective effects of 20 mM TA against the cytotoxicity of 1.5 or 4.5 mM TASO, respectively.
Discussion
A common theme among many small-molecule organotropic toxicants is the generation of chemically reactive metabolites that subsequently modify cellular proteins via covalent binding. Our laboratory has been interested in identifying the proteins targeted by reactive metabolites of several prototypical hepatotoxins, in part to determine if there might be some common subset of proteins involved in triggering downstream toxic responses. For example, our previous investigations identified a total of 45 targets of bromobenzene metabolites and 62 targets of thiobenzamide metabolites, but only 25 of these proteins were common targets of both agents. The modest degree of overlap is perhaps not surprising in view of the substantial differences in chemical reactivity of the respective reactive metabolites. To delve deeper into this question we turned to another hepatotoxic thioamide, namely, thioacetamide. To reduce the need for both animals and labeled compounds we planned to use isolated rat hepatocytes for protein adduct generation.
Story et al.12 exposed hepatocytes from Sprague Dawley rats to TA at concentrations up to 10 mM for 2 or 5 hr and observed no significant toxicity as measured by enzyme release (GOT and LDH) or inhibition of urea synthesis. Later Yeom et al.13 exposed immortalized WB-F344 cells (a diploid cell line derived from F344 rat liver) to TA at concentrations of 1 and 10 mM for 24 hr and observed 20% and 50% cell death, respectively, using the MTT (mitochondrial function) assay. These conflicting results may be due to the differences in the times of observation or to differences in the type of cell used (i.e. freshly isolated vs. immortalized cell line). Since it would be vital for our proteomics work to generate proteins adducted by TA metabolites under toxicologically relevant conditions, we reinvestigated the cytotoxicity of TA. However, we found no evidence of toxicity, as indicated by LDH release and by light microscopy, even after incubating freshly isolated hepatocytes with TA for up to 40 hr at concentrations up to 50 mM. Furthermore, despite the observation that a large amount of the TA was consumed during the incubation, and a large amount of TASO was formed, no significant accumulation of CVB was observed. This suggested that we were unlikely to obtain adducted proteins for proteomic analysis by exposing hepatocytes to TA.
TA is known to require oxidation to TASO and then to TASO2 as the ultimate toxic metabolite responsible for the protein covalent binding that leads to toxicity, but the enzymology and overall kinetics of this pathway is fairly complex. Early observations that fasting and drug-induced diabetes potentiate the hepatotoxicity of TA first suggested a role for CYP2E1 in its bioactivation.24, 25 Studies with CYP2E1 inducers including acetone,26 pyridine and isoniazid,19 with inhibitors including diallyl sulfide19 and N,N-diethyldithiocarbamate,27 and with cyp2e1 knockout mice28, 29 have since made a convincing case for CYP2E1 as a major contributor to TA and TASO bioactivation and toxicity.
The contribution of CYP2B1/2 to TA induced liver injury had been largely discounted on the basis of early reports that pretreatment of rats with phenobarbital does not potentiate either the hepatotoxicity of TA24, 28 or its covalent binding to liver.28 Nevertheless, expressed CYP2B1/2 has been shown to be capable of oxidizing both TA and TASO approximately as well as expressed CYP2E1,28 and while SKF525-A does not block the hepatotoxicity of TA in untreated rats,24 it does block TA hepatotoxicity in phenobarbital-pretreated rats.8 On the other hand Zaragoza et al.30 reported that in Wistar rats, phenobarbital pretreatment of rats does potentiate TA hepatoxicity as assessed histologically and by plasma enzymes and bilirubin, and that the potentiation was correlated with substantial increases in the measured activity of both CYP2B1/2 and FMO.
Although FMO is not generally regarded as easily inducible by drugs in the fashion of some P450 enzymes, its role in the bioactivation of TA is supported by the observation that the FMO inhibitor methimazole is known to block the toxicity of TA,31 and by studies with rat liver microsomes in vitro.7 Treatment of rats with indole-3-carbinol (I3C) for several weeks decreased FMO expression and activity as expected, but toxicity due to TA actually increased,25 probably because I3C also induces P450 enzymes.32, 33
The situation regarding TA bioactivation is further complicated by the fact that repeated dosing with TA or TASO can also modulate microsomal drug oxidizing activities,8, 30 and the fact that the oxidation of both TA and TASO appear to be saturable under in vivo dosing conditions.14, 15, 28 From all of these metabolic studies, however, one thing that comes through clearly is that TA must be activated to its reactive metabolite TASO2 in order to elicit cytotoxicity.
When we exposed isolated hepatocytes to TASO we found it to be a remarkably potent cytotoxin. Concentrations as low as 0.5 mM reproducibly elicited increases in LDH release that began after 16 hr and increased over time. Striking phenotypic changes could be observed by microscopy starting at somewhat earlier times. Higher exposure concentrations also produced stronger responses starting at successively earlier times. In addition, these toxic effects could be blocked by two well-known inhibitors of CYP2E1, namely DAS and 4MP. The time- and concentration dependent cytotoxicity of TASO, its much greater potency relative to TA, and the inhibition of its toxicity by CYP2E1 inhibitors are all in agreement with the relative effects of TA and TASO in vivo. On the other hand, there was nothing in the literature to indicate that TA would be a strong inhibitor of TASO toxicity. The kinetics of a two-step bioactivation pathway in which both steps are catalyzed by same combination of enzymes imply that as the concentration of the initial substrate (TA) increases, it will compete with the intermediate metabolite (TASO) for the second oxidation and thereby inhibit formation of the ultimate reactive metabolite TASO2. This effect will be magnified if V/K for the first substrate (TA) happens to be significantly higher than V/K for the intermediate metabolite (TASO). While the kinetic constants for TA and TASO in this scheme are not known, it is reasonable to propose that TASO, being much more polar than TA, might well have a lower V/K than that of TA for the relevant mixed-function oxidase enzyme(s). Under this scenario TA would be an effective inhibitor of TASO oxidation, which is what we observe.
We tested the hypothesis that TA is a good ligand for CYP2E1 indirectly by evaluating its ability to preserve the CYP2E1 content of hepatocytes in culture. When freshly isolated hepatocytes are maintained in culture their content of P450 enzymes declines over time. In the case of CYP2E1, the decline is prevented by including ligands such as ethanol or isoniazid in the incubation medium. The fact that TA also preserves the CYP2E1 content of cultured hepatocytes argues for it having a functionally significant affinity for this enzyme.
Another unexpected finding was that TASO is reduced back to TA by rat hepatocytes. Chilakapati et al.14 dosed rats with TASO and analyzed urine and plasma for TA but detected none. Figure 9A summarizes the results of incubating purified [14C]-TASO with hepatocytes for 6 hr in the absence of added TA. TASO is oxidized to its reactive metabolite TASO2 which then hydrolyzes to acetamide or covalently binds to proteins. Some TASO is also reduced to TA, but because TA is an excellent substrate for microsomal oxidases, relatively little accumulates (as suggested by the relative sizes of the arrows in the figure). However, the inclusion of non-radioactive TA in incubations of [14C]-TASO with hepatocytes provides a cold-trap for metabolically produced [14C]-TA, thereby making its back-oxidation less probable and its accumulation more likely and more easily detected, as suggested by the relative sizes of the arrows in Figure 9B. With the back oxidation of [14C]-TA prevented by isotope dilution, the net consumption of [14C]-TASO actually increases as shown in Figure 7D, even though oxidation to TASO2 is decreased.
Figure 9.

Metabolic pathway diagrams showing the effect of unlabeled TA on the metabolism of [14C]-TASO in isolated hepatocytes. The numerical values are from Figure 7. In both A and B, the initial concentration of TASO was 10 mM; in B only the initial concentration of TA was 10 mM.
Futile redox cycling of divalent vs. tetravalent organosulfur functional groups is well precedented in the literature. For example kidney enzymes rapidly interconvert the sulfoxide prodrug sulindac and its bio-active sulfide metabolite.34, 35 Ethionamide (2-ethylisothionicotinamide) and its S-oxide metabolite are likewise readily interconvertible in man, rats, mice and dogs.36 The back reduction of TASO may have important consequences for the biology of liver injury by TA and TASO. Chilakapati et al.15, 28 administered [14C]-TASO to rats and observed that a 12-fold increase in dose caused only a 2.5-fold increase in covalent binding to liver proteins. From this they concluded that TASO exhibited saturation toxicokinetics. However, another interpretation is that the higher dose of TASO might have lead to a greater amount of TA being formed, which in turn would have decreased the rate of oxidation of TASO to TASO2, thereby preventing a fully-proportional increase in covalent binding.
In view of the multiple enzyme systems and pathways for metabolism of TA and TASO, including their futile redox interconversion, a more detailed understanding of their toxicokinetics in vivo will obviously require more information than is currently available. In the meantime, having characterized the metabolism and toxicity of TA and TASO in hepatocytes will facilitate their use to generate a collection of proteins adducted by TA metabolites under toxicologically relevant conditions. The results of our proteomic analysis will be reported separately.
Supplementary Material
Acknowledgments
Funding
This research was supported in part by NIH grant GM-21784 (to R.P.H.)
We thank Ms. Heather Shinogle for expert assistance with microscopy and photomicrography.
Abbreviations
- 4MP
4-methylpyrazole
- AA
acetamide
- CVB
covalent binding
- Cyp2E1
cytochrome P450 2E1
- DAS
diallyl sulfide
- DMEM
Dulbecco’s Modified Eagle Medium
- FBS
fetal bovine serum
- FMO
FAD-containing monooxygenase
- H/PI
Hoechst 33342 and propidium iodide
- LDH
lactate dehydrogenase
- PBS
phosphate-buffered isotonic saline (pH 7.4)
- PVDF
poly(vinylidene difluoride)
- SDS
sodium dodecylsulfate
- TA
thioacetamide
- TASO
thioacetamide S-oxide
- TASO2
thioacetamide S,S-dioxide
- TEMED
tetramethylethylenediamine
- TLC
thin layer chromatography
- WME
Williams’ Medium E
Footnotes
Six time-lapse movies of cells exposed to TA and/or TASO in the medium. This material is available free of charge via the Internet at http://pubs.acs.org.
References
- 1.Fitzhugh OG, Nelson AA. Liver tumors in rats fed thiourea or thioacetamide. Science. 1948;108:626–628. doi: 10.1126/science.108.2814.626. [DOI] [PubMed] [Google Scholar]
- 2.Kuroda K, Terao K, Akao M. Inhibitory effect of fumaric acid on hepatocarcinogenesis by thioacetamide in rats. J Natl Cancer Inst. 1987;79:1047–1051. [PubMed] [Google Scholar]
- 3.Yeh C-N, Maitra A, Lee K-F, Jan Y-Y, Chen M-F. Thioacetamide-induced intestinal-type cholangiocarcinoma in rat: An animal model recapitulating the multi-stage progression of human cholangiocarcinoma. Carcinogenesis. 2004;25:631–636. doi: 10.1093/carcin/bgh037. [DOI] [PubMed] [Google Scholar]
- 4.Li X, Benjamin IS, Alexander B. Reproducible production of thioacetamide-induced macronodular cirrhosis in the rat with no mortality. J Hepatol. 2002;36:488–493. doi: 10.1016/s0168-8278(02)00011-9. [DOI] [PubMed] [Google Scholar]
- 5.Okuyama H, Makamura H, Shimahara Y, Uyama N, Kwon YW, Yamaoka N, Yodoi J. Overexprssison of thioredoxin prevents thioacetamide-induced hepatic fibrosis in mice. J Hepatol. 2002;42:117–123. doi: 10.1016/j.jhep.2004.09.020. [DOI] [PubMed] [Google Scholar]
- 6.Ledda-Collumbano GM, Coni P, Curto M, Giacomini L, Faa G, Oliverio S, Piacentini M, Columbano A. Induction of two different modes of cell death, apoptosis and necrosis, in rat liver after a single dose of thioacetamide. Am J Pathol. 1991;139:1099–1109. [PMC free article] [PubMed] [Google Scholar]
- 7.Dyroff MC, Neal RA. Studies of the mechanism of metabolism of thioacetamide S-oxide by rat liver microsomes. Mol Pharmacol. 1983;233:219–227. [PubMed] [Google Scholar]
- 8.Hunter AL, Holscher MA, Neal RA. Thioacetamide-induced hepatic necrosis. I. Involvement of the mixed-function oxidase enzyme system. J Pharmacol Exp Therap. 1977;200:439–448. [PubMed] [Google Scholar]
- 9.Ikehata K, Duzhak TG, Galeva NA, Ji T, Koen YM, Hanzlik RP. Protein targets of reactive metabolites of thiobenzamide in rat liver in vivo. Chem Res Toxicol. 2008;21:1432–1442. doi: 10.1021/tx800093k. [DOI] [PMC free article] [PubMed] [Google Scholar]
- 10.Ji T, Ikehata K, Koen YM, Esch SW, Williams TD, Hanzlik RP. Covalent modification of microsomal lipids by thiobenzamide metabolites in vivo. Chem Res Toxicol. 2007;20:701–708. doi: 10.1021/tx600362h. [DOI] [PMC free article] [PubMed] [Google Scholar]
- 11.(http://tpdb.medchem.ku.edu:8080/protein_database/)
- 12.Story DL, Gee SJ, Tyson CA, Gould DH. Response of isolated hepatocytes to organic and inorganic cytotoxins. J Toxicol Environ Health. 1983;11:483–501. doi: 10.1080/15287398309530362. [DOI] [PubMed] [Google Scholar]
- 13.Yeom H-J, Park J-S, Oh M-J, Paul S, Kim JK, Kim SJ, Lee Y-S, Kang K-S, Hwang SY. Expression analysis of early response-related genes in rat liver epithelial cells exposed to thioacetamide in vitro. J Vet Med Sci. 2009;71:719–727. doi: 10.1292/jvms.71.719. [DOI] [PubMed] [Google Scholar]
- 14.Chilakapati J, Korrapati MC, Hill RA, Warbritton A, Latendresse JR, Mehendale HM. Toxicokinetics and toxicity of thioacetamide sulfoxide: A metabolite of thioacetamide. Toxicology. 2007;230:105–116. doi: 10.1016/j.tox.2006.11.050. [DOI] [PubMed] [Google Scholar]
- 15.Chilakapati J, Shankar K, Korrapati MC, Hill RA, Mehendale HM. Saturation toxicokinetics of thioacetamide: Role in initiation of liver injury. Drug Metab Dispos. 2005;33:1877–1885. doi: 10.1124/dmd.105.005520. [DOI] [PubMed] [Google Scholar]
- 16.Sarma D, Hanzlik RP. Synthesis of carbon-14, carbon-13 and deuterium labeled forms of thioacetamide and thioacetamide S-oxide. J Label Compd Radiopharm. 2011;54:795–798. doi: 10.1002/jlcr.1933. [DOI] [PMC free article] [PubMed] [Google Scholar]
- 17.(http://grants1.nih.gov/grants/guide/notice-files/not96-208.html))
- 18.Mudra DR, Parkinson A. Preparation of hepatocytes. Current Protocols in Toxicology. 2001;14.2:1–13. doi: 10.1002/0471140856.tx1402s08. [DOI] [PubMed] [Google Scholar]
- 19.Ramaiah SK, Apte U, Mehendale H. Cytochrome P450 induction increases thioacetamide liver injury in diet-restricted rats. Drug Metab Dispos. 2001;29:1088–1095. [PubMed] [Google Scholar]
- 20.Steward AR, Dannan GA, Guzelian PS, Guengerich FP. Changes in the concentration of seven forms of cytochrome P450 in primary cultures of adult rat hepatocytes. Mol Pharmacol. 1985;27:125–132. [PubMed] [Google Scholar]
- 21.Wortelboer HM, DeKruif CA, van Iersel AA, Falke HE, Noordhoek J, Blaauboer BJ. The isozyme pattern of cytochrome P450 in rat hepatocytes in primary culture, comparing different enzyme activities in microsomal incubations and intact monolayers. Biochem Pharmacol. 1990;40:2525–2534. doi: 10.1016/0006-2952(90)90095-3. [DOI] [PubMed] [Google Scholar]
- 22.Sarma D, Hajovsky H, Koen YM, Galeva NA, Williams TD, Staudinger JL, Hanzlik RP. Covalent modification of lipids and proteins in rat hepatocytes, and in vitro, by thioacetamide metabolites. Chem Res Toxicol. 2012 doi: 10.1021/tx3001658. (in press) [DOI] [PMC free article] [PubMed] [Google Scholar]
- 23.Hanzlik RP. Prediction of metabolic pathways - sulfur functional groups. In: Caldwell J, Paulson GD, editors. Foreign compound metabolism. 1984. pp. 65–78. [Google Scholar]
- 24.El-Hawari AM, Plaa GL. Potentiation of thioacetamide-induced hepatotoxicity in alloxan- and streptozotocin-diabetic rats. Tox Let. 1983;17:292–300. doi: 10.1016/0378-4274(83)90241-2. [DOI] [PubMed] [Google Scholar]
- 25.Wang T, Shankar K, Ronis MJJ, Mehendale HM. Potentiation of thioacetamide liver injury in diabetic rats is due to CYP2E1. J Pharmacol Exp Therap. 2000;294:473–479. [PubMed] [Google Scholar]
- 26.Chieli E, Saviozzi M, Puccini P, Longo V, Gervasi PG. Possible role of the acetone-inducible cytochrome P-450IIE1 in the metabolism and hepatotoxicity of thiobenzamide. Arch Toxicol. 1990;64:122–127. doi: 10.1007/BF01974397. [DOI] [PubMed] [Google Scholar]
- 27.Masuda Y, Nakayama N. Protective effect of diethyldithiocarbamate and carbon disulfide against liver injury induced by various hepatotoxic agents. Biochem Pharmacol. 1982;31:2713–2725. doi: 10.1016/0006-2952(82)90124-1. [DOI] [PubMed] [Google Scholar]
- 28.Chilakapati J, Korrapati MC, HShankar K, Hill RA, Warbritton A, Latendresse JR, Mehendale H. Role of CYP2E1 and saturation kinetics in the bioactivation of thioacetamide: Effects of diet restriction and phenobarbital. Toxicol Appl Pharmacol. 2007;219:72–84. doi: 10.1016/j.taap.2006.11.036. [DOI] [PubMed] [Google Scholar]
- 29.Kang JS, Wanibuchi H, Morimura K, Wongpoomchai R, Chusiri Y, Gonzalez FJ, Fukushima S. Role of CYP2E1 in thioacetamide-induced mouse hepatotoxicity. Toxicol Appl Pharmacol. 2008;228:295–300. doi: 10.1016/j.taap.2007.11.010. [DOI] [PubMed] [Google Scholar]
- 30.Zaragoza A, Andres D, Sarrion D, Cascales M. Potentiation of thioacetamide hepatotoxicity by phenobarbital pretreatment in rats. Inducibility of FAD monooxygenase system and age effect. Chem-Biol Interactions. 2000;124:87–101. doi: 10.1016/s0009-2797(99)00147-7. [DOI] [PubMed] [Google Scholar]
- 31.Chieli E, Malvaldi G. Role of the microsomal FAD-containing monooxygenase in the liver toxicity of thioacetamide-S-oxide. Toxicology. 1984;31:41–52. doi: 10.1016/0300-483x(84)90154-9. [DOI] [PubMed] [Google Scholar]
- 32.Larsen-Su S, Williams DE. Dietary indole-3-carbinol inhibits fmo activity and the expression of flavin-containing monooxygenase form 1 in rat liver and intestine. Drug Metab Dispos. 1996;24:927–931. [PubMed] [Google Scholar]
- 33.Renwick AB, Mistry H, Barton PT, Mallet F, Price RJ, Beamand JA, Lake BG. Effect of some indole derivatives on xenobiotic metabolism and xenobiotic-induced toxicity in cultured rat liver slices. Food Chem Toxicol. 1999;37:69–618. doi: 10.1016/s0278-6915(99)00026-5. [DOI] [PubMed] [Google Scholar]
- 34.Miller MJS, Bednar MM, McGif JC. Renal metabolism of sulindac: Functional implications. J Pharmacol Exp Therap. 1984;231:449–456. [PubMed] [Google Scholar]
- 35.Brunell D, Sagher D, Kesaraju S, Brot N, Weissbach H. Studies on the metabolism and biological activity of the epimers of sulindac. Drug Metab Dispos. 2011;39:1014–1021. doi: 10.1124/dmd.110.037663. [DOI] [PMC free article] [PubMed] [Google Scholar]
- 36.Johnston JP, Kane PO, Kibby MR. The metabolism of ethionamide and its sulphoxide. J Pharm Pharmacol. 1966;19:1–9. doi: 10.1111/j.2042-7158.1967.tb07986.x. [DOI] [PubMed] [Google Scholar]
Associated Data
This section collects any data citations, data availability statements, or supplementary materials included in this article.