

Abstract
Objective
To determine the frequency, causes, predictors, and consequences of 30-day readmission after abdominal aortic aneurysm (AAA) repair.
Summary Background Data
CMS will soon reduce total Medicare reimbursements for hospitals with higher-than-predicted 30-day readmission rates after vascular surgical procedures including AAA repair. However, causes and factors leading to readmission in this population have never before been systematically analyzed.
Methods
We analyzed elective AAA repairs over a two-year period from the CMS Chronic Conditions Warehouse, a 5% national sample of Medicare beneficiaries.
Results
2481 patients underwent AAA repair – 1502 endovascular (EVAR) and 979 open. 30-day readmission rates were equivalent for EVAR (13.3%) and open repair (12.8%). While wound complication was the most common reason for readmission after both procedures, the relative frequency of other causes differed – e.g., bowel obstruction was common following open repair and graft complication after EVAR. In multivariate analyses, preoperative comorbidities had a modest effect on readmission; however, postoperative factors including serious complications leading to prolonged length of stay and discharge destination other than home had a profound influence on the probability of readmission. The one-year mortality in readmitted patients was 23.4% versus 4.5% in those not readmitted (p<0.001).
Conclusions
Early readmission is common after AAA repair. Adjusting for comorbidities, postoperative events predict readmission, suggesting that proactively preventing, detecting, and managing postoperative complications may provide an approach to decreasing readmissions, with the potential to reduce cost and possibly enhance long-term survival.
INTRODUCTION
Hospital readmissions are common and costly, and have emerged as a major target in health care reform as part of the 2010 Patient Protection and Affordable Care Act. Almost one in five hospitalized Medicare beneficiaries are readmitted within 30 days of discharge at a cost of over $17.4 billion per year.1 In the Medicare population, the readmission rate after vascular surgical procedures is nearly 24%, significantly higher than the average of 15.6% for all surgical interventions.1 The Medicare Payment Advisory Commission (MedPAC) identified vascular procedures as one of seven categories that account for more than 30% of potentially preventable readmissions. Moreover, vascular readmissions were the most costly on a per-patient basis.2
Currently the Centers for Medicare and Medicaid Services (CMS) tracks hospital risk-adjusted 30-day readmission rates for several medical conditions, and this information is available to the public on the Hospital Compare website (http://www.hospitalcompare.hhs.gov). Beginning in 2012–13, CMS will reduce total Medicare reimbursements to hospitals with higher-than-predicted readmission rates for these tracked diagnoses and vascular procedures will soon be added to the targeted list. Hospitals that fail to control vascular readmissions will suffer substantial financial penalties, with potentially dire consequences for hospital-based vascular surgery programs and surgeons.
To date, the majority of research on readmissions has been performed in patients with medical conditions. Early readmission after vascular surgical procedures has not been systematically studied and no vascular surgery-specific readmissions-reduction interventions have been implemented. In this study we describe the frequency, causes, predictors, and consequences of 30-day readmission after abdominal aortic aneurysm (AAA) repair in the Medicare population. Our goal is to provide data to inform the policy debate, and ultimately to inform the development of a targeted intervention to decrease early readmissions and improve vascular surgical patient outcomes.
METHODS
Data Source and Patients
After obtaining institutional review board approval, a 5% random sample of Medicare beneficiaries was obtained from CMS through the Chronic Condition Data Warehouse (http://www.ccwdata.org) for the years 2004, 2005, and 2006. We obtained demographic and enrollment data as well as institution, physician, and supplier claims. Each record contained demographics, physician and hospital identifiers, and diagnosis and procedure codes as classified by the International Classification of Diseases, 9th Clinical Modification (ICD-9-CM). Data were extracted for all patients who underwent surgical treatment of non-ruptured AAA (diagnosis codes 441.4 and 441.9). Procedure codes (38.34, 38.44, 38.64, 39.52, 39.71, and 39.78) were used to define EVAR and open AAA repair. We required complete enrollment in Medicare Part A and Part B for 365 continuous days prior to AAA repair to allow characterization of comorbidities, and at least 31 days after discharge for measurement of readmission and other outcomes. Ruptured aneurysms (441.3) were excluded, as were AAA diagnoses without an associated treatment code. We excluded individuals younger than age 65 at the date of procedure and those with potentially incomplete data due to Medicare health maintenance organization (HMO) enrollment or railroad benefits.
Preoperative Variables
Patient sociodemographics included age, sex, race, reason for Medicare entitlement, and Medicaid eligibility during the study period. Patient residence was determined using Rural-Urban Commuting Area (RUCA) codes3 and categorized as being in urban, suburban, large town, small town, or rural areas. Comorbidity was quantified with the Charlson comorbidity index,4 and individual conditions were defined using the Elixhauser method.5 Treatment variables included endovascular vs. open procedure type and annual hospital AAA repair volume. Hospital procedure volume for Medicare beneficiaries was estimated by averaging the annual number of procedures from 2004–2006 and multiplying by 20 to correct for the 5% sample, and was categorized into low volume (<50 cases per year) or high volume (≥50 cases per year).6
Postoperative Variables
We analyzed three main postoperative variables: complications, length of stay, and discharge destination. We created a list of relevant postoperative complications after a review of the literature on early outcomes after open and endovascular AAA repair, and defined each complication with the ICD-9-CM diagnosis and procedure codes and CPT procedure codes cited in these prior studies.7–10 In order to decrease the likelihood of erroneously capturing preoperative comorbidities with our postoperative complication variables we only included ICD-9-CM diagnosis codes with the “99X” prefix, explicitly corresponding to complications, or with the adjectives “acute” or “initial” in the formal description of the diagnosis – an approach which has been used by other investigators in the field.8 For example, we considered ICD-9-CM diagnosis code 428.31 (acute diastolic heart failure) a postoperative complication, but excluded 428.32 (chronic diastolic heart failure). The codes used to define each complication are listed in Supplemental Table 1. We also used an alternative definition of postoperative complications whereby we included only those complications that resulted in reoperation or other reintervention during the index surgical stay, as we have described previously.6,11
We analyzed the distribution of index length of stay (LOS) and defined prolonged LOS as exceeding the 75th percentile. Thus, prolonged LOS was defined as >7 days for all patients, >4 days for the EVAR group, and >11 days for the open repair group. Discharge destination was recoded from the CMS discharge status variable, and grouped into the following categories: discharge to home, discharged to home with nursing care, discharged to skilled nursing facility, and discharge to other facility (e.g., rehabilitation hospital).
The primary outcome variable was 30-day readmission, which we defined as readmission to an acute-care short-stay hospital within 30 days of discharge after AAA repair. Direct transfers from one short-stay hospital to another were not considered readmissions. Readmissions to special facilities such as psychiatric and rehabilitation hospitals were also not included in this outcome measure, which we and others have used previously.1, 11 For each readmission, we determined whether the readmission was to the index hospital (where the AAA repair was performed), or to a different facility. Readmission primary diagnosis codes were grouped using Agency for Healthcare Research and Quality (AHRQ) Clinical Classifications Software (CCS) 11–13. Patients who died during the initial surgical hospital stay were excluded from the denominator in readmission and mortality calculations.
Statistical Analysis
We determined the overall frequency of 30-day readmission after AAA repair. We compared the frequency of patient-related and treatment-related variables in patients who were and were not readmitted using Chi-square tests. A pair-wise correlation matrix was created to quantify the degree of correlation among the variables. We used logistic regression to determine adjusted odds ratios (ORs) and 95% confidence intervals (CIs) of 30-day hospital readmission for different predictors, controlling for potential confounders. To account for clustering, robust estimates of the variance were used in the models. We used logistic regression analysis, Kaplan-Meier survival curves, and log-rank tests to measure the association between 30-day readmission and one-year mortality. Analyses were performed using SAS 9.2 software (SAS Institute, Cary, North Carolina) and Stata 11 software (StataCorp, College Station, Texas). All tests of significance were at the p < 0.05 level, and p-values were 2-tailed.
RESULTS
Patient Characteristics
A total of 2541 patients underwent elective AAA repair – 1516 EVAR and 1025 open. Patients who died during the index hospital stay – 12 (0.8%) after EVAR and 45 (4.4%) after open – were excluded from the analysis of 30-day readmission. After this and other exclusion criteria were applied, 2481 patients were included in the study for further analysis. Characteristics of the patients who underwent EVAR (n = 1502) and open repair (n = 979) are shown in Table 1. Compared to the open group, patients who had EVAR were older (76.6±6.0 vs. 75.5±5.6, p<0.001), more likely to be male (79.1% vs. 71.4%, p<0.001), and had more comorbid illness as measured by the Charlson comorbidity index (2.9±1.6 vs. 2.6±1.4, p<0.001). The length of hospital stay was significantly shorter after EVAR (3.4±4.2 vs. 9.4±7.4 days, p<0.001).
Table 1.
Characteristics of Medicare beneficiaries who underwent elective AAA repair (n = 2481), by procedure type.
| Characteristic | EVAR (n = 1502) | Open (n = 979) | P |
|---|---|---|---|
| Age, mean (SD) | 76.6 (6.0) | 75.5 (5.6) | <0.001 |
| Female, n (%) | 314 (20.9) | 280 (28.6) | <0.001 |
| Race, n (%) | 0.95 | ||
| White | 1418 (94.4) | 922 (94.2) | |
| Black | 50 (3.3) | 33 (3.4) | |
| Other | 34 (2.3) | 24 (2.5) | |
| Reason for Medicare entitlement, n (%) | 0.21 | ||
| Age | 1346 (89.6) | 879 (89.8) | |
| Disability | 156 (10.4) | 98 (10.0) | |
| End-stage renal disease | 0 | † (0.2) | |
| Medicaid enrollment, n (%) | 114 (7.6) | 79 (8.1) | 0.66 |
| Charlson comorbidity score, mean (SD) | 2.88 (1.55) | 2.61 (1.39) | <0.001 |
| Patient area of residence, n (%) | 0.37 | ||
| Urban | 917 (61.1) | 570 (58.2) | |
| Suburban | 141 (9.4) | 115 (11.8) | |
| Large town | 219 (14.6) | 143 (14.6) | |
| Small town or rural | 218 (14.5) | 145 (14.8) | |
| Missing | † (0.5) | † (0.6) | |
| Underwent procedure at high volume hospital, n (%) | 704 (46.9) | 398 (40.7) | 0.002 |
| Had in-hospital complication, n (%) | |||
| Any complication | 315 (21.0) | 399 (40.8) | <0.001 |
| Respiratory | 59 (3.9) | 184 (18.8) | <0.001 |
| Hemorrhage/Shock | 104 (6.9) | 136 (13.9) | <0.001 |
| Vascular/Device | 95 (6.3) | 65 (6.6) | 0.76 |
| Cardiac | 42 (2.8) | 67 (6.8) | <0.001 |
| Wound | † (0.5) | 21 (2.2) | <0.001 |
| Renal/Urologic | 40 (2.7) | 32 (3.3) | 0.34 |
| Neurologic | 35 (2.3) | 32 (2.2) | 0.14 |
| Reoperation (Non Vascular) | † (0.2) | 17 (1.7) | <0.001 |
| Venous Thromboembolism | 0 | 11 (1.2) | <0.001 |
| Length of stay, mean (SD) | 3.4 (4.2) | 9.4 (7.4) | <0.001 |
| Discharge destination, n (%) | <0.001 | ||
| Home | 1214 (80.8) | 540 (55.2) | |
| Home with home care | 171 (11.4) | 210 (21.5) | |
| Skilled nursing facility | 79 (5.3) | 144 (14.7) | |
| Other facility | 38 (2.5) | 85 (8.7) | |
| 30-day readmission, n (%) | 200 (13.3) | 125 (12.8) | 0.69 |
| 30-day mortality*, n (%) | 11 (0.7) | † (0.5) | 0.50 |
| One-year mortality*, n (%) | 106 (7.1) | 67 (6.8) | 0.84 |
SD denotes standard deviation; %, column percentage; HCC, Hierarchical Condition Categories.
Patients who died during the index stay were excluded.
Exact cell size suppressed per data use agreement to protect patient confidentiality as n < 11.
Frequency of Readmission after AAA Repair
The 30-day readmission rates after EVAR and open repair were 13.3% and 12.8%, respectively, and the difference was not statistically significant (p=0.693). Of the 325 readmitted patients, 64.3% returned to the index surgical hospital, and 35.7% were readmitted to a different hospital. Twenty-one of the 325 readmitted patients died during the readmission inpatient stay, yielding a rehospitalization mortality rate of 6.5%, which was much higher than the in-hospital mortality rate of 2.2% for the index stay.
Readmission Diagnoses
For the 325 patients that were readmitted within 30 days after AAA repair, the frequencies of readmission diagnoses for each type of procedure are shown in Table 2. For the EVAR readmitted group (n = 200), the top-five most frequent readmission primary diagnoses were wound complication (15.5% of all EVAR readmissions), pneumonia & respiratory (11.5%), AAA & graft-related (10.0%), CHF (8.5%), and sepsis (6.5%). For patients who underwent open aneurysm repair and were readmitted (n = 125), the most common reason was also wound complication (17.6% of all readmissions in the open group). Other frequent readmission diagnoses after open repair included GI obstruction (13.6%), pneumonia & respiratory (12.0%), sepsis (10.4%), AAA & graft-related (5.6%), and MI & cardiac arrest (5.6%). Approximately half of the readmission diagnoses (44% for EVAR and 54% for open repair) were surgical complications such as wound infections or bleeding, whereas the other half were medical complications of surgery such as pneumonia or CHF.
Table 2.
Readmission diagnoses after endovascular (EVAR) and open AAA repair.
| EVAR (200 Readmissions) | Open (125 Readmissions) | ||||
|---|---|---|---|---|---|
| Rank # | Diagnosis | % | Rank # | Diagnosis | % |
|
| |||||
| 1 | Wound Complication | 15.5 | 1 | Wound Complication | 17.6 |
|
| |||||
| 2 | Pneumonia & Respiratory | 11.5 | 2 | GI Obstruction | 13.6 |
|
| |||||
| 3 | AAA or Graft | 10.0 | 3 | Pneumonia & Respiratory | 12.0 |
|
| |||||
| 4 | CHF | 8.5 | 4 | Sepsis | 10.4 |
|
| |||||
| 5 | Sepsis | 6.5 | 5 | AAA or Graft | 5.6 |
|
| |||||
| 6 | MI, Cardiac Arrest | 6.0 | 6 | MI, Cardiac Arrest | 5.6 |
|
| |||||
| 7 | Renal Failure | 6.0 | 7 | Arrhythmia | 4.0 |
|
| |||||
| 8 | GI Obstruction | 5.5 | 8 | Fluid & Electrolyte | 4.0 |
|
| |||||
| 9 | Bleeding | 3.0 | 9 | CHF | 3.2 |
|
| |||||
| 10 | Cancer related | 3.0 | 10 | Bleeding | 2.4 |
|
| |||||
| 11 | Miscellaneous | 3.0 | 11 | Cancer related | 2.4 |
|
| |||||
| 12 | GI Bleeding | 3.0 | 12 | Miscellaneous | 2.4 |
|
| |||||
| 13 | Stroke | 2.5 | 13 | Diabetes | 2.4 |
|
| |||||
| 14 | UTI | 2.5 | 14 | Venous Thromboembolism | 2.4 |
|
| |||||
| 15 | Arrhythmia | 2.0 | 15 | GI Inflammation & Infection | 2.4 |
|
| |||||
| 16 | Diabetes | 2.0 | 16 | Renal Failure | 1.6 |
|
| |||||
| 17 | Hypertension | 2.0 | 17 | GI Bleeding | 1.6 |
|
| |||||
| 18 | Fluid & Electrolyte | 1.5 | 18 | Stroke | 1.6 |
|
| |||||
| 19 | Neurologic | 1.5 | 19 | Hypertension | 1.6 |
|
| |||||
| 20 | Other | 4.5 | 20 | Other | 3.2 |
CHF indicates congestive heart failure; MI, myocardial infarction, GI, gastrointestinal; UTI, urinary tract infection.
Univariate Analysis of Potential Risk Factors for Readmission
We then analyzed variables that were potential risk factors for readmission. The results of our univariate analysis are displayed in Table 3. Of patient sociodemographics, older age and female gender were associated with readmission, while race, reason for Medicare entitlement, Medicaid enrollment (a surrogate for poverty), and rural-vs.-urban residence were not. Burden of preoperative comorbid illness, as measured by the Charlson comorbidity index, was associated with readmission. However, of the 29 individual comorbid conditions in the Elixhauser classification that we analyzed, only eight were associated with a significantly higher readmission rate. The comorbid condition associated with the most striking readmission rate was preoperative paralysis, with 25% of patients with this condition readmitted, compared to 12.9% for those without paralysis (p<0.018). No other comorbid condition was associated with a readmission rate exceeding 20%. We also examined hospital annual AAA procedure volume, but this statistic was not associated with readmission.
Table 3.
Univariate analysis of factors potentially related to 30-day readmission after non-ruptured AAA repair in 2481 Medicare beneficiaries.
| Factor | # of Patients with Factor Present | % Readmitted if Factor Present | % Readmitted if Factor Absent | P |
|---|---|---|---|---|
| Age | <0.023 | |||
| 65–74 | 1007 | 11.0 | n/a | |
| 75–84 | 1246 | 14.1 | n/a | |
| ≥85 | 228 | 16.7 | n/a | |
| Gender | 0.048 | |||
| Male | 1887 | 12.4 | n/a | |
| Female | 594 | 15.5 | n/a | |
| Race | 0.99 | |||
| White | 2340 | 13.1 | n/a | |
| Black | 83 | 13.3 | n/a | |
| Other | 58 | 13.8 | n/a | |
| Reason for Medicare entitlement | 0.50 | |||
| Age | 2225 | 13.4 | n/a | |
| Disability | 254 | 11.0 | n/a | |
| End-stage renal disease | † | 0 | n/a | |
| Medicaid enrollment | 192 | 13.0 | 13.1 | 0.95 |
| Charlson comorbidity score | <0.001 | |||
| 1st tertile | 1372 | 10.5 | n/a | |
| 2nd tertile | 568 | 13.9 | n/a | |
| 3rd tertile | 541 | 18.9 | n/a | |
| Comorbid conditions (Elixhauser codes) | ||||
| Paralysis | 44 | 25.0 | 12.9 | 0.018 |
| Other neurologic disease | 150 | 19.3 | 12.7 | 0.020 |
| Anemia | 509 | 18.9 | 11.6 | <0.001 |
| Congestive heart failure | 441 | 18.4 | 12.0 | <0.001 |
| Renal failure | 230 | 17.8 | 12.6 | 0.026 |
| Obesity | 80 | 17.5 | 13.0 | 0.24 |
| Coagulation disorder | 138 | 17.4 | 12.9 | 0.12 |
| History of cancer | 428 | 16.4 | 12.4 | 0.028 |
| Hypothyroidism | 297 | 16.5 | 12.6 | 0.064 |
| Diabetes mellitus | 565 | 15.4 | 12.4 | 0.065 |
| Chronic pulmonary disease | 1023 | 14.9 | 11.9 | 0.030 |
| Valvular disease | 630 | 14.3 | 12.7 | 0.31 |
| Hypertension | 1982 | 13.3 | 12.2 | 0.52 |
| Weight loss | 143 | 15.4 | 13.0 | 0.40 |
| Depression | 138 | 14.5 | 13.0 | 0.62 |
| Peripheral vascular disease | 2380 | 12.9 | 16.8 | 0.26 |
| Fluid or electrolyte disorder | 321 | 16.8 | 12.6 | 0.034 |
| Other comorbidity | 494 | 14.4 | 12.8 | 0.35 |
| Patient area of residence | 0.34 | |||
| Urban | 1487 | 13.9 | n/a | |
| Suburban | 256 | 14.8 | n/a | |
| Large town | 362 | 11.3 | n/a | |
| Small town or rural | 363 | 10.7 | n/a | |
| Missing | 13 | 7.7 | n/a | |
| Underwent procedure at high volume hospital | 1102 | 14.0 | 12.4 | 0.25 |
| Had in-hospital complication | ||||
| Any complication | 724 | 17.4 | 11.3 | <0.001 |
| Wound | 31 | 35.5 | 12.8 | <0.001 |
| Reoperation (for non-vascular complications) | 20 | 25.0 | 13.0 | 0.11 |
| Renal/Urologic | 77 | 26.0 | 12.7 | 0.001 |
| Vascular/graft-related | 164 | 20.1 | 12.6 | 0.006 |
| Cardiac | 117 | 20.5 | 12.7 | 0.015 |
| Respiratory | 254 | 17.3 | 12.6 | 0.035 |
| Hemorrhage/shock | 245 | 16.3 | 12.8 | 0.12 |
| Neurologic | 68 | 16.2 | 13.1 | 0.45 |
| Venous thromboembolism | 12 | 8.3 | 13.1 | 0.62 |
| Prolonged length of stay (>7d) | 601 | 19.1 | 11.2 | <0.001 |
| Discharge destination | <0.001 | |||
| Home | 1754 | 9.9 | n/a | |
| Home with home care | 381 | 16.8 | n/a | |
| Skilled nursing facility | 223 | 27.4 | n/a | |
| Other facility | 123 | 21.1 | n/a | |
| Procedure type | 0.69 | |||
| Endovascular | 1502 | 13.3 | n/a | |
| Open | 979 | 12.8 | n/a | |
| 30-day mortality* | 16 | 62.5 | 12.8 | <0.001 |
| One-year mortality* | 173 | 43.9 | 10.8 | <0.001 |
Mortality outcome variables only include deaths that occurred after discharge and exclude deaths that occurred during the index/surgical hospital stay.
Exact cell size suppressed per data use agreement to protect patient confidentiality as n < 11.
In contrast to comorbidities, postoperative factors had a much stronger association with 30-day readmission. Patients who had any in-hospital postoperative complication had a readmission rate of 17.4% vs. 11.3% for those who did not have a complication. We examined nine categories of complications, and five were significantly associated with readmission. Moreover, the magnitudes of the readmission rates for these complications were quite high. Patients diagnosed with a wound complication had a readmission rate of 35.5%, compared to 12.8% in those who did not (p<0.001). Four other types of complications also had readmission frequencies above 20%: renal/urologic (26.0%; p=0.001), reoperation during the index stay for bowel obstruction and other non-vascular problems (25.0%; p=0.113), cardiac complications (20.5%; p=0.015), and vascular/graft-related complications (20.1%; p=0.006). The 30-day readmission rate for patients who suffered any complication that resulted in reintervention during the index stay was 21.6%.
Another factor that significantly predicted readmission was prolonged length of hospital stay, which we defined as greater than seven days (the 75th percentile) for the overall cohort. Patients with a prolonged initial hospital length of stay were subsequently readmitted at a rate of 19.1%, compared to 11.2% for those with shorter LOS (p<0.001). The linear relationship between LOS and readmission frequency is displayed in Figure 1. Finally, we examined the association of discharge destination on readmission. Patients discharged home with no nursing care had a readmission rate of only 9.9%. Those who required home nursing care had a readmission rate of 16.8%. Patients discharged to a skilled nursing facility (SNF) had a high rate of readmission, 27.4%. The mean rehospitalization length of stay for patients readmitted from SNF was 7.7 days, and their rehospitalization in-hospital mortality was 9.8%.
Figure 1.

Index hospital length of stay (LOS) and frequency of readmission after non-ruptured AAA repair (n = 2481). The readmission rates for LOS longer than 14 days are aggregates for each of three intervals: 15–21 days (n = 99), 22–42 days (n = 55) and 43–126 days (n = 8), using the midpoint and mean rates within each interval.
In summary, the univariate analysis revealed that both pre- and post-operative factors were associated with 30-day readmission. However, the association between postoperative factors and readmission was stronger. We performed similar but separate analyses in the EVAR and open repair groups and the results were similar to the overall cohort (Supplemental Tables 2 & 3).
Multivariate Analysis of Predictors of Readmission
We next performed a multivariate analysis of 30-day readmission. Variables that were significantly associated with readmission in univariate analysis were included in a model, and logistic regression analysis was performed to calculate adjusted odds ratios for readmission. Covariates included age, gender, eight comorbid conditions (paralysis, neurologic disease, anemia, CHF, chronic renal failure, malignancy, chronic pulmonary disease, and fluid/electrolyte disorder), five postoperative complications (wound complication, renal/urologic, vascular/graft-related, cardiac, and respiratory), prolonged LOS, and discharge destination. The results of the multivariate analysis are shown in Table 4. Compared to patients aged 65–70, older patients had higher odds of readmission. Gender was not significant after adjusting for all the other variables in the model. Of the eight comorbid conditions, three were significantly associated with readmission, albeit with modest odds ratios: anemia (OR 1.39), CHF (OR 1.40), and history of cancer (OR 1.40). The remaining five comorbid conditions were not associated with readmission in multivariate analysis.
Table 4.
Multivariate analysis of predictors of 30-day readmission after elective AAA repair. Odds ratios are adjusted for the variables shown in the table: age, gender, 8 comorbid conditions, 5 complications, prolonged LOS, and discharge destination.
| Factor | Odds Ratio (95% CI) |
|---|---|
|
| |
| Age | |
| 65–70 | Referent |
| 71–75 | 2.01 (1.35 – 2.98) * |
| 76–80 | 1.57 (1.05 – 2.33) * |
| 81–85 | 1.80 (1.18 – 2.76) * |
| 85+ | 1.76 (0.99 – 3.10) |
| Female (vs. Male) | 1.14 (0.86 – 1.50) |
| Comorbid Conditions | |
| Paralysis | 1.59 (0.73 – 3.47) |
| Neurologic Disease | 1.16 (0.74 – 1.82) |
| Anemia | 1.39 (1.05 – 1.85) * |
| Congestive Heart Failure | 1.40 (1.03 – 1.89) * |
| Renal Failure | 1.15 (0.78 – 1.68) |
| History of Cancer | 1.40 (1.03 – 1.90) * |
| Chronic Pulmonary Disease | 1.11 (0.86 – 1.42) |
| Fluid/Electrolyte Disorder | 1.05 (0.73 – 1.50) |
| Postoperative Complications | |
| Wound | 2.50 (1.08 – 5.79) * |
| Renal/Urologic | 1.75 (1.01 – 3.06) * |
| Vascular/Graft | 1.40 (0.91 – 2.13) |
| Cardiac | 1.31 (0.78 – 2.20) |
| Respiratory | 0.84 (0.56 – 1.25) |
| Prolonged Length of Stay (>7d) | 1.26 (0.93 – 1.72) |
| Discharge Destination | |
| Home | Referent |
| Home with Home Care | 1.52 (1.09 – 2.11) * |
| Skilled Nursing Facility | 2.50 (1.68 – 3.71) * |
| Other facility | 1.72 (1.03 – 2.88) * |
Denotes a statistically significant association at the p<0.05 level.
Of the five postoperative complications in the multivariable model, two predicted 30-day readmission – wound complication, with a high odds ratio of 2.50 (95% CI 1.08–5.79), and renal/urologic (OR, 1.75, 95% CI, 1.01–3.06). The remaining three complications were not significantly associated with readmission. After adjusting for potential confounders, prolonged LOS was also not significant. However, discharge to destination other than home remained a strong predictor of readmission, with patients discharged to a nursing home having an odds ratio of 2.50 (95% CI, 1.68–3.71).
We suspected a high degree of multicollinearity between the three postoperative variables in the model – complications, LOS, and discharge destination, and this was confirmed by calculation of correlation coefficients. For example, prolonged LOS was correlated with all the complications and discharge destination at the p<0.0001 level, and the correlation coefficient between prolonged LOS and respiratory complication was 0.4. We therefore performed multivariate analysis using a second model that included all the preoperative variables in Table 4 as well as the complications, but excluded prolonged LOS and discharge destination. The results are shown in Supplemental Table 4. In this model, older age and three complications – wound complication, renal/urologic, and vascular/graft – are stronger predictors of 30-day readmission compared to preoperative comorbid conditions. In terms of odds ratio magnitude, postoperative wound complication is the strongest predictor (OR, 3.21; 95% CI, 1.35–7.66).
In summary, the multivariate analysis confirmed the findings of our univariate analysis, demonstrating that postoperative events rather than preoperative factors are the most important determinants of readmission.
Association between Early Readmission and One-Year Mortality
After determining the rates, causes, and risk factors of readmission after endovascular and open AAA repair, we next examined the association between early readmission and one-year mortality. The unadjusted one-year mortality rate in readmitted patients was 23.4%, compared to 4.5% in those who were not readmitted (p<0.001). Kaplan-Meier survival analysis confirmed a highly significant difference in survival based on 30-day readmission status (Figure 2). In a multivariable model of one-year mortality that included readmission status, age, gender, Charlson comorbidity index, and EVAR vs. open repair type, the adjusted odds ratio of readmission for mortality was 5.76 (95% CI, 4.09–8.10), indicating an exceedingly strong association between these two outcomes.
Figure 2.
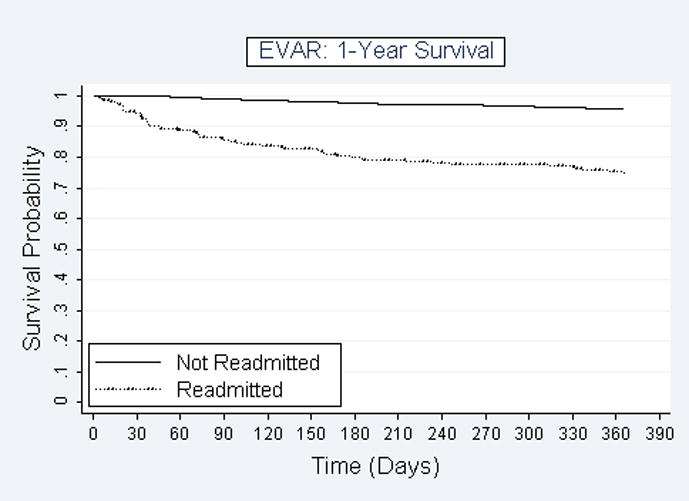
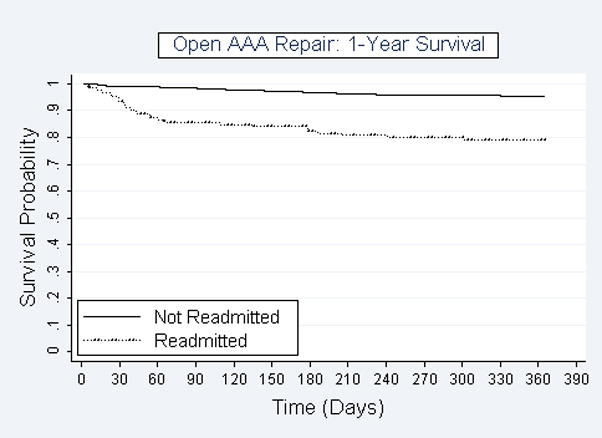
Figure 2a. Kaplan-Meier survival curves for patients who were readmitted (n=200) or were not readmitted (n=1302) after endovascular AAA repair. Y-axis displays probability of survival and X-axis shows days after surgical discharge.
Figure 2b. Kaplan-Meier survival curves for patients who were readmitted (n=125) or were not readmitted (n=854) after open AAA repair. Y-axis displays probability of survival and X-axis shows days after surgical discharge.
DISCUSSION
Hospital readmissions have emerged as a major target of health care reform. CMS will soon begin penalizing hospitals with higher-than-projected rates of 30-day readmission after vascular surgical procedures by docking a percentage of total Medicare reimbursement. However, few prior studies have examined vascular readmission using National-level data. Our goal in this study was to address this gap by describing the frequency, causes, risk factors, and consequences of readmission after endovascular and open AAA repair.
In our analysis of National Medicare data we found that readmission after AAA repair is common, with more than one in eight individuals readmitted within 30 days of discharge after non-ruptured aneurysm surgery. Few prior studies have focused on 30-day readmissions after AAA repair. However, several investigators have included readmission in composite outcomes of aneurysm repair involving reoperation or mortality,14 or studied readmission over longer time intervals such as 6 to 12 months.14–17 In one prior study, Vogel and colleagues analyzed a Washington State hospital administrative discharge database and found 30-day readmission rates of 11.6% for EVAR and 13.1% for open repair.18 These readmission rates were similar to our findings of 13.3% and 12.8%, respectively, in National Medicare beneficiaries. In contrast, Jackson et al reported much lower rates of 30-day readmission after AAA repair (4.9% for EVAR and 10.5% for open repair) in a single-institutional retrospective study.19 This retrospective study design at a solitary institution may have resulted in under-detection of readmission, as a significant proportion of readmissions are to hospitals other than the site where the primary procedure was performed. In our analysis of National Medicare data on aneurysm repair, 36% of readmissions were to a hospital other than the index surgical hospital. This frequency of readmission to a different hospital is much higher than the rate of 22% in the general Medicare population. 20 Nasir and colleagues also analyzed Medicare data and concluded that measuring same-hospital readmission is a poor proxy for true readmission rates.21 Studies or programs that rely on single-institution administrative data are therefore likely to miss a significant proportion of readmissions.
In addition to determining the rate of readmission after endovascular and open AAA repair, we also wished to describe the diagnoses that led to readmission. Jencks and colleagues have shown that patients who are hospitalized for a medical condition and then readmitted are most often rehospitalized for the same primary diagnosis – e.g., patients with CHF are readmitted for CHF, and patients with pneumonia are readmitted for pneumonia.1 In our analysis we found that most readmissions after AAA repair are due to complications of the procedure. The most common reason for readmission after both EVAR and open repair was a wound complication. The relative frequencies of other readmission diagnoses differed between EVAR and open repair. For example, bowel obstruction was common after open repair, while graft complications were more frequent after EVAR. Understanding the most common reasons for readmission after AAA repair is critical for the development of interventions that will decrease readmissions.
After describing the most frequent readmission diagnoses, we sought to discover patient and treatment related factors that are associated with readmission. Any attempt to design an intervention to prevent readmission will be aided by defining the subgroup of patients that is at highest risk. We were surprised to discover that preoperative comorbidities were only weakly associated with early readmission after aneurysm repair. In univariate analysis we identified eight preoperative comorbidities that predicted readmission; however, most increased the rate of readmission modestly (3–8%) with the exception of paralysis. The readmission rate with paralysis was 25% vs. 13% without, suggesting a strong association (although the total number of patients with this condition was small). The disability produced by paralysis might impede recovery or predispose the patient to complications such as deep venous thrombosis or pneumonia. We were not able to confirm the association between diabetes and increased readmission risk that has been reported in previous studies.15, 19 In contrast to comorbid illnesses, older patient age was strongly associated with readmission. The rate of readmission was as low as 11% in patients younger than 75, and approximately 17% in those older than 85. Other investigators have also reported that older patients have higher risk of readmission.16
We examined nine categories of postoperative complications that were recognized and coded during the index hospital stay. Patients that had any one of these nine in-hospital complications had an associated readmission rate of 17.4% compared to 11.3% in those who did not have any complication. In univariate analysis, five of the nine were associated with readmission in a statistically significant manner: wound complication, renal/urologic, vascular/graft-related, cardiac, and respiratory. Of these, wounds complications including surgical site infections and wound disruptions had the strongest association with readmission. Over thirty-five percent of those that had a wound complication during the index stay were subsequently readmitted within 30 days vs. 12.8% in individuals who did not have this complication. In addition to wound, four other complications also were associated with readmission frequencies exceeding 20%. In multivariate analysis, wound (OR, 2.50) and renal/urologic complications (OR, 1.75) remained significant predictors of readmission after adjusting for prolonged LOS, discharge destination, and other factors. When prolonged LOS and discharge destination were removed from the multivariable model of readmission to reduce multicollinearity with the complications, three postoperative complications were significant in multivariate logistic regression: wound complication (OR, 3.21), renal/urologic (OR, 1.97), and vascular/graft (OR, 1.55). These results confirmed our hypothesis that serious postoperative complications are an important determinant of readmission.
Another variable that we examined, related to the same theoretical construct of complicated postoperative course, was length of stay. Prolonged LOS during the index hospitalization was associated with 30-day readmission in univariate analysis, and the relationship was remarkably linear (Figure 1). It is well known that surgical patients who suffer serious postoperative complications are more likely to have prolonged length of stay and be discharged to skilled nursing care rather than home. Of all the variables that we examined, discharge destination was the most powerful predictor of early readmission. After adjusting for potential confounders, the odds ratio of readmission for patients discharged to a skilled nursing facility was 2.50 compared to those discharged home without nursing care (95% CI, 1.68–3.71). Taken together, our analyses suggest that surgical complications leading to prolonged length of stay and discharge destination other than home have a profound influence on the probability of readmission. The fact that discharge destination and length of stay appear to be more powerful determinants of readmission than individual complications is interesting. This observation suggests that not all complications are equivalent in their impact. Our data would suggest that some complications – if recognized and treated – resolve and do not lead to prolonged length of stay or discharge to SNF or readmission. Alternatively, other complications have greater consequences and it is these complications that produce the need for readmission.
Another important finding of this study was the striking association between 30-day readmission and mortality. The in-hospital mortality rate was much higher for rehospitalization compared to the initial surgical hospital stay (6.5% vs. 2.2%). The in-hospital mortality for patients who were discharged to SNF and subsequently readmitted was extremely high, with one in ten of these patients dying during the rehospitalization. Longer term, the unadjusted one-year mortality in readmitted patients was an astounding 23.4% compared to 4.5% in non-readmitted patients (p<0.001). After adjusting for age, gender, comorbidity, and procedure type, the odds ratio of readmission for one-year mortality was 5.76 (95% CI, 4.09–8.10), indicating a powerful association, which other investigators have also noted for patients undergoing aneurysm repair.14, 15 The question is whether the readmission is a surrogate for the identification of a cohort of patients that even preoperatively have diminished longevity. Conversely, perhaps events leading up to the readmission alter survival. The latter hypothesis suggests that improved postoperative care and interventions designed to reduce readmissions may have the potential to positively impact longevity in these patients. As this is a retrospective cohort study it is difficult to determine causal relationships between postoperative events, readmission, and mortality. However, we hypothesize that postoperative complications, which may occur before or after discharge, are important determinants of both early readmission and long-term mortality after AAA repair. The striking association between readmission and mortality suggests that the problem of readmission is much more than economic.
To approach the issue of surgical readmission and to help guide future research we have developed a conceptual model, shown in Figure 3, below. This model builds upon a theoretical framework developed by Kangovi and Grande, which includes health policy, quality of and access to inpatient and outpatient care, and patient health status and socioeconomic resources.22 To these components we add the new concept of “complication identification and management failure”, which we propose to be fundamentally important in surgical readmissions. There are three major paradigms that fall under this rubric. First, a complication develops during the index hospitalization that is not adequately treated which leads to readmission (e.g., a patients is diagnosed with pneumonia but given inappropriate antibiotics). Second, a complication develops during the index hospitalization that is not recognized and thus not treated, leading to readmission (e.g., a patient with fluid overload is sent home without diuresis and is then readmitted in congestive heart failure). Third, a de novo complication develops following discharge that leads to readmission (e.g., a pulmonary embolism). Approximately 38 percent of readmitted patients in this study had a diagnosis or procedure code corresponding to an inhospital complication during the surgical hospital stay, suggesting that a significant number of readmissions are due to paradigm one – inadequate treatment of a recognized complication. The data however suggests that about 60% of complications that resulted in readmission were either not diagnosed during the index stay or developed after discharge.
Figure 3.
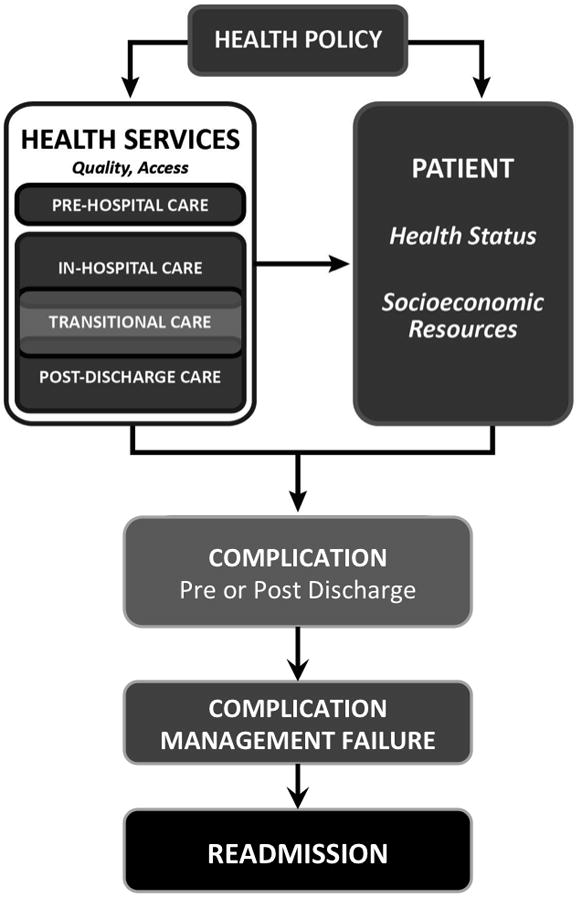
Model of surgical readmission (adapted from a general model of readmission by Kangovi and Grande{1 Kangovi,S. 2011;}}), showing complication management failure as the proximate cause.
In conclusion, we have found that 30-day readmission is common after AAA repair, postoperative events are strong predictors of readmission after adjusting for comorbidity, and readmission is strongly associated with one-year mortality. We hypothesize that improved coordination of care across the inpatient, transitional care, and outpatient settings, with active surveillance for procedure-specific (EVAR vs. open) postoperative complications, may prevent at least some early readmissions after aneurysm repair. Given the pending financial implications, and the striking association with one-year mortality, developing interventions that target readmission after surgical procedures such as AAA repair is of paramount importance.
Supplementary Material
Acknowledgments
Sources of Funding: Support for the work was provided by the Health Innovation Program (HIP) and the Clinical & Translational Science Award (CTSA) program, previously through the National Center for Research Resources (NCRR) grant 1UL1RR025011, and now by the National Center for Advancing Translational Sciences (NCATS) grant 9U54TR000021. Additional funding was provided by the University of Wisconsin School of Medicine & Public Health via The Wisconsin Partnership Program. Amy J.H. Kind is supported by a National Institute on Aging Beeson Career Development Award (K23AG034551, National Institute on Aging, The American Federation for Aging Research, The John A. Hartford Foundation, The Atlantic Philanthropies, and The Starr Foundation).
The authors acknowledge the assistance of Glen Leverson, PhD, who provided advice on statistical analysis and multivariable modeling.
Footnotes
Conflicts of Interest
The authors declare no relevant conflicts of interest.
The content is solely the responsibility of the authors and does not represent the official views of the National Institutes of Health (NIH), Centers for Medicare & Medicaid Services (CMS), or any other organization.
References
- 1.Jencks SF, Williams MV, Coleman EA. Rehospitalizations among patients in the Medicare fee-for-service program. N Engl J Med. 2009;360:1418–1428. doi: 10.1056/NEJMsa0803563. [DOI] [PubMed] [Google Scholar]
- 2.Hackbarth G, Reischauer R, Miller M. Report to the Congress: Promoting Greater Efficiency in Medicare. 2007. [Google Scholar]
- 3.U.S. Department of Agriculture Economic Research Service. Measuring Rurality: Rura-Urban Commuting Area Codes. Available at: http://www.ers.usda.gov/briefing/rurality/ruralurbancommutingareas/
- 4.D’Hoore W, Bouckaert A, Tilquin C. Practical considerations on the use of the Charlson comorbidity index with administrative data bases. J Clin Epidemiol. 1996;49:1429–1433. doi: 10.1016/s0895-4356(96)00271-5. [DOI] [PubMed] [Google Scholar]
- 5.Elixhauser A, Steiner C, Harris DR, et al. Comorbidity measures for use with administrative data. Med Care. 1998;36:8–27. doi: 10.1097/00005650-199801000-00004. [DOI] [PubMed] [Google Scholar]
- 6.Mell MW, Kind A, Bartels CM, et al. Failure to rescue and mortality after reoperation for abdominal aortic aneurysm repair. J Vasc Surg. 2011;54:346–51. doi: 10.1016/j.jvs.2011.01.030. discussion 351-2. [DOI] [PMC free article] [PubMed] [Google Scholar]
- 7.Greco G, Egorova N, Anderson PL, et al. Outcomes of endovascular treatment of ruptured abdominal aortic aneurysms. J Vasc Surg. 2006;43:453–459. doi: 10.1016/j.jvs.2005.11.024. [DOI] [PubMed] [Google Scholar]
- 8.Egorova NN, Vouyouka AG, McKinsey JF, et al. Effect of gender on long-term survival after abdominal aortic aneurysm repair based on results from the Medicare national database. J Vasc Surg. 2011;54:1–12.e6. doi: 10.1016/j.jvs.2010.12.049. discussion 11-2. [DOI] [PubMed] [Google Scholar]
- 9.Egorova N, Giacovelli J, Greco G, et al. National outcomes for the treatment of ruptured abdominal aortic aneurysm: comparison of open versus endovascular repairs. J Vasc Surg. 2008;48:1092–100. 1100.e1–2. doi: 10.1016/j.jvs.2008.06.036. [DOI] [PMC free article] [PubMed] [Google Scholar]
- 10.Nowygrod R, Egorova N, Greco G, et al. Trends, complications, and mortality in peripheral vascular surgery. J Vasc Surg. 2006;43:205–216. doi: 10.1016/j.jvs.2005.11.002. [DOI] [PubMed] [Google Scholar]
- 11.Greenblatt DY, Weber SM, O’Connor ES, et al. Readmission after colectomy for cancer predicts one-year mortality. Ann Surg. 2010;251:659–669. doi: 10.1097/SLA.0b013e3181d3d27c. [DOI] [PMC free article] [PubMed] [Google Scholar]
- 12.HCUP: Clinical Classifications Software (CCS) for ICD-9-CM. 2012 Available at: http://www.hcup-us.ahrq.gov/toolssoftware/ccs/ccs.jsp.
- 13.Cowen ME, Dusseau DJ, Toth BG, et al. Casemix adjustment of managed care claims data using the clinical classification for health policy research method. Med Care. 1998;36:1108–1113. doi: 10.1097/00005650-199807000-00016. [DOI] [PubMed] [Google Scholar]
- 14.Giles KA, Landon BE, Cotterill P, et al. Thirty-day mortality and late survival with reinterventions and readmissions after open and endovascular aortic aneurysm repair in Medicare beneficiaries. J Vasc Surg. 2011;53:6–12. 13.e1. doi: 10.1016/j.jvs.2010.08.051. [DOI] [PMC free article] [PubMed] [Google Scholar]
- 15.Gioia LC, Filion KB, Haider S, et al. Hospital readmissions following abdominal aortic aneurysm repair. Ann Vasc Surg. 2005;19:35–41. doi: 10.1007/s10016-004-0132-4. [DOI] [PubMed] [Google Scholar]
- 16.Holt PJ, Poloniecki JD, Hofman D, et al. Re-interventions, readmissions and discharge destination: modern metrics for the assessment of the quality of care. Eur J Vasc Endovasc Surg. 2010;39:49–54. doi: 10.1016/j.ejvs.2009.10.003. [DOI] [PubMed] [Google Scholar]
- 17.Jetty P, Hebert P, van Walraven C. Long-term outcomes and resource utilization of endovascular versus open repair of abdominal aortic aneurysms in Ontario. J Vasc Surg. 2010;51:577–83. 583.e1–3. doi: 10.1016/j.jvs.2009.10.101. [DOI] [PubMed] [Google Scholar]
- 18.Vogel TR, Symons RG, Flum DR. Longitudinal outcomes after endovascular repair of abdominal aortic aneurysms. Vasc Endovascular Surg. 2008;42:412–419. doi: 10.1177/1538574408316143. [DOI] [PubMed] [Google Scholar]
- 19.Jackson BM, Nathan DP, Doctor L, et al. Low rehospitalization rate for vascular surgery patients. J Vasc Surg. 2011;54:767–772. doi: 10.1016/j.jvs.2011.03.255. [DOI] [PubMed] [Google Scholar]
- 20.Kind AJ, Bartels C, Mell MW, et al. For-profit hospital status and rehospitalizations at different hospitals: an analysis of Medicare data. Ann Intern Med. 2010;153:718–727. doi: 10.1059/0003-4819-153-11-201012070-00005. [DOI] [PMC free article] [PubMed] [Google Scholar]
- 21.Nasir K, Lin Z, Bueno H, et al. Is same-hospital readmission rate a good surrogate for all-hospital readmission rate? Med Care. 2010;48:477–481. doi: 10.1097/MLR.0b013e3181d5fb24. [DOI] [PubMed] [Google Scholar]
- 22.Kangovi S, Grande D. Hospital readmissions--not just a measure of quality. JAMA. 2011;306:1796–1797. doi: 10.1001/jama.2011.1562. [DOI] [PubMed] [Google Scholar]
Associated Data
This section collects any data citations, data availability statements, or supplementary materials included in this article.