

Abstract
Study Design
Prospective cohort study
Objective
This study was designed to neurophysiologically characterize motor control recovery after spinal cord injury (SCI).
Setting
University of Louisville, Louisville, Kentucky, USA.
Material
Eleven acute SCI admissions and five non-injured subjects were recruited for this study.
Methods
The American Spinal Injury Association Impairment Scale (AIS) was used to categorize injury level and severity at onset. Multi-muscle surface EMG (sEMG) recording protocol of reflex and volitional motor tasks was initially performed between the day of injury and 11 days post onset (6.4 ± 3.6, mean ± SD days). Follow-up recordings were performed for up to 17 months after injury. Initial AIS distribution was: 4 AIS-A; 2 AIS-C; 5 AIS-D. Multi-muscle activation patterns were quantified from the sEMG amplitudes of selected muscles using a vector-based calculation that produces values for Magnitude and Similarity of SCI test-subject patterns to those produced by non-injured subjects.
Results
In SCI subjects, overall sEMG amplitudes were lower after SCI. Prime mover muscle voluntary recruitment was slower and multi-muscle patterns were disrupted by SCI. Recovery occurred in 9 of the 11 showing an increase in sEMG amplitudes, more rapid prime mover muscle recruitment rates and the progressive normalization of the multi-muscle activation patterns. The rate of increase was highly individualized, differing over time by limb and proximal or distal joint within each subject and across the SCI group.
Conclusions
Recovery of voluntary motor function can be quantitatively tracked using neurophysiological methods in the domains of time and multi-muscle motor unit activation.
Sponsorship
NIH NINDS funded project #NS049954-01
Keywords: Spinal Cord Injury, Motor Control, Surface Electromyography, Recovery, Voluntary motor control, motor unit recruitment
Introduction
Spinal Cord Injury (SCI) in humans produces profound changes in central nervous system sensory and motor function that are known to recover to varying degrees.1 At the time of injury, spinal motor neurons and the interneurons that modulate their excitability suffer significant loss of synaptic connections from interneurons lost within the immediate injury zone and severed long-tract fibers.2 Demyelination of other long-tract fibers disrupts their ability to deliver impulses to the synapses of spinal motor circuitry within and distal to the injury zone.3 Further, neuropathological examination of human SCI reveals that each lesion is highly individualized in regards to severity and which and to what extent descending tracts are spared.4 This broad range of injury locations and severity results in considerable diversity in impairment and extent of recovery observed within the population of people with SCI. As a result, detailed characterization of SCI impact on central nervous system motor control processing is a complex and difficult task.
The recovery of voluntary capability after SCI is currently tracked through the use of clinical expert-examiner scales such as the American Spinal Injury Association Impairment Scale (AIS).5 Using the AIS framework, an examiner grades the force produced against resistance by voluntary contraction of selected muscles to derive a categorical classification of severity, A to E. However, the rate of recruitment of the target muscle and the activation of synergistic muscles with concurrent inhibition of antagonistic muscles necessary to efficiently perform functional volitional movement are not captured by such scales. Neurophysiological methods using surface electromyography (sEMG) recorded from multiple muscles have demonstrated an ability to identify and quantify evidence of preserved trans-lesional conduction in chronic, clinically complete, paralyzed SCI subjects.6 Calancie and coworkers7 showed that examiner-judged sEMG amplitudes for selected muscles could be used to describe recovery of voluntary contraction during the first six months after SCI. A vector-based method to quantify sEMG to calculate an index relating the multi-muscle activation patterns produced to perform volitional movement in a test subject to those of non-injured persons was published8 and validity tested in chronic SCI subjects.9 The study reported here was undertaken to neurophysiologically examine and quantify the return of the volitional recruitment of motor units within the domains of time and distribution across multiple muscles to characterize recovery from SCI.
Methods
Material
Assessments were carried out after informed consent was obtained as approved by the Institutional Review Board for human research of the University of Louisville. Persons with concomitant head injury were not enrolled in this study. Medical management strategies were not altered to accommodate this study.
Nineteen subjects were recruited from acute traumatic SCI admissions to the University of Louisville hospital. Eleven who completed follow-up studies at least one month after injury were analyzed for this report (Table 1). Initial neurophysiological recordings were carried out as early as was judged medically appropriate by attending physicians, between one and 11 days post onset (6.4 ± 3.6 days, mean ± SD). Seven underwent surgical stabilization prior to initial testing and two were stabilized between initial and follow-up recordings. Two saw no surgical intervention. All received rehabilitation treatment after discharge from the acute care facility. Follow-up recordings were performed between one and 17 months (206 ± 137 days) post injury. Two subjects were female and ages ranged from 24 to 63 (45 ± 12) years at the time of injury. Neurological injury levels ranged from C1 to T6. Initial AIS distribution was: 4 AIS-A; 2 AIS-C; 5 AIS-D. Only one subject in this study, number 5, was taking anti-spasticity medication during follow-up recordings. One female and four male non-injured subjects, age 20 to 59 (39 ± 18) years underwent the neurophysiological recording to provide normative data.
Table 1.
Study subject injury level, ASIA Impairment Scale (AIS) category, age, days post-onset for first BMCA recording and months post-onset for the final follow-up recording.
| Subject | Sex | Age (yrs) | Initial AIS | Initial BMCA | First Follow-up | Second Follow-up | Third Follow-up | Fourth Follow-up | Final Follow-up BMCA | ||
|---|---|---|---|---|---|---|---|---|---|---|---|
| Grade | Motor Level | ||||||||||
| Riqht | Left | ||||||||||
| 1 | M | 48 | D | C1 | C1 | 11 days | 1 month | ||||
| 2 | M | 51 | C | C4 | C4 | 3 days | 15 days | 1 month | 40 days | 51 days | 8 months |
| 3 | M | 54 | C | C4 | C4 | 3 days | 47 days | 6 months | 9 months | ||
| 4 | M | 49 | D | C4 | C4 | 6 days | 25 days | 4 months | |||
| 5 | M | 44 | D | C4 | C4 | 9 days | 22 days | 1 month | 3 months | ||
| 6 | M | 52 | D | C5 | C5 | 1 day | 7 days | 3 months | |||
| 7 | F | 63 | D | C5 | C6 | 5 days | 5 months | 11 months | |||
| 8 | M | 23 | A | C5 | C5 | 10 days | 52 days | 3 months | 5 months | 8 months | |
| 9 | M | 51 | A | C5 | C5 | 11 days | 27 days | 45 days | 135 days | 7 months | |
| 10 | M | 24 | A | T1 | T1 | 3 days | 25 days | 4 months | |||
| 11 | F | 41 | A | T6 | T6 | 8 days | 40 days | 5 months | 17 months | ||
Clinical assessment was carried out on admission to the hospital using the American Spinal Injury Association Impairment Scale (AIS). The AIS provides a subjective estimation of voluntary contraction strength for five upper limb and five lower limb muscles, representing C5 to T1 and L2 to S1 levels.5 Initial AIS examinations were performed between the same day (n=4) and 5 (1.7 ± 1.8) days before neurophysiological recording in 10 subjects. In one subject who was intubated, a complete initial AIS examination was not performed until 33 days following the neurophysiological recording. Final follow-up AIS exams were performed on the same day in four and between 4 and 360 (87.0 ± 116.3) days prior to the final neurophysiological recording in the others.
Neurophysiological assessment was carried out using an expanded Brain Motor Control Assessment (BMCA) protocol10 with upper-limb tasks added to the published lower-limb tasks. The BMCA includes volitional and reflex motor tasks carried out with the subject in the supine position using published standards for administration and analysis. Following skin preparation, pairs of sEMG electrodes, spaced 2 cm apart were placed, oriented parallel to the long axis of the muscle, over the right and left upper trapezius (UT), biceps brachi (BB), triceps brachi (TB), wrist extensors (WE), wrist flexors (WF), rectus abdominus (RA) (para-umbilical), quadriceps (Qd), adductor femoris (Add), hamstrings (H), tibialis anterior (TA), soleus (Sol). Five minutes of relaxation were followed by three repetitions each of: reinforcement maneuvers; unilateral voluntary movement of elbow, wrist, hip and knee, and ankle joints; passive stretch, ankle clonus, plantar stimulation. For voluntary tasks, subjects were cued by an audible 5-second tone for each phase and instructed to “move and hold for the duration of the tone.” Signals were recorded on a 32-channel AXON Eclipse Neuromonitoring System (AXON Systems, Inc.) with a sampling rate of 2 KHz per channel and a bandpass of 30 Hz to 1 KHz.
Data reduction
sEMG was quantified using a root-mean-square (RMS) algorithm that produced values in μV/sec. Values from 5-second windows, the published standard for this analysis method, were averaged for each muscle from three trials each of elbow flexion and extension, wrist extension, hip and knee flexion, and ankle dorsiflexion and plantar flexion. In some recordings, analysis windows for elbow extension and plantar flexion tasks were less than 5 seconds based on event marks. Hip and knee extension was not presented because it is not a true extension task, but rather an eccentric flexion when performed in the supine position. Background activity and noise were measured from a one-second window before the motor task and subtracted from the average value for each channel. These values were used to calculate overall Magnitude and the Similarity Index (SI) which compares the relative distribution across an appropriate set of muscles chosen for the task to that of a non-injured subject group.8 Response vectors (RVs) with one element per muscle were calculated for each task. RVs for elbow flexion and extension were calculated from right and left UT, BB, and TB muscles. The wrist extension RV was calculated from right and left UT, BB, TB, WE and WF muscles. The elements for the hip and knee flexion RV were from the right and left Qd, Add, and H muscles. Right and left Qd, Add, H, TA and Sol muscle values made up the RVs for ankle dorsiflexion and plantar flexion. The distal muscles were not included in elbow or hip and knee task prototypes because instructions to the subject did not specify how they were to be moved during those tasks. To generate the Prototype Response Vectors (PRVs), the healthy subject RVs were first normalized, then averaged. The PRV is presented in dimensionless units for each task. The Euclidian length of the RV or PRV provided the Magnitude value. The SI, a numerical expression of the relationship of the RV to the PRV, is computed as the cosine of the solid angle between the two vectors. A value of 1.0 for the SI means that the angle was zero and that the test-subject’s RV had an identical distribution of sEMG activity across muscles as did the non-injured subject group PRV for that task.
Quantification of the voluntary recruitment rate focused on four muscles considered to be the prime movers for their motor task: biceps brachi for elbow flexion; wrist extensors for wrist extension; quadriceps for hip flexion; tibialis anterior for ankle dorsiflexion. Elbow extension and plantar flexion were not evaluated for this measure because they were performed from an active state as the second phase of a two-phase movement. sEMG from these muscles was processed into an RMS envelope and filtered at 20 Hz to enhance envelope peak recognition. Prime mover activation times were measured as the time between the appearance of the first motor unit firing and the peak of the RMS envelope. Again, three trials were averaged for each task.
Statistical analysis
Data sets were tested for normal distribution using skewness, kurtosis, and omnibus normality tests. For normally distributed sets, two-tailed unpaired t-test calculations were made to compare non-injured to SCI group onset-to-peak, similarity index, and magnitude values. Paired t-test analysis was used to compare initial to final session results for each variable. For sets that were not normally distributed, the Wilcoxon and Mann-Whitney tests were used to compare paired and non-paired data sets respectively. Spearman’s rank correlation coefficient (ρ) calculations were used to determine the strength of the relationships between non-parametric data sets, specifically between AIS motor scores and BMCA parameters. Significance was reached at the p<0.05 level. This analysis was conducted in the NCSS/Pass software (v.2002, Kaysville, UT).
Results
Recovery of voluntary activation
sEMG patterns were highly individualized as were their rate of change over time. Two subjects, numbers 10 and 11, were unable to activate motor units in muscles below their respective T1 and T6 lesions for the period covered by serial recordings at 4 and 17 months respectively. They were unchanged throughout and therefore not included in the calculated values presented below. For the remaining 9 subjects, unilateral voluntary motor tasks were analyzed for a maximum of 18 responding limbs for each task. Two subjects progressed from complete paralysis of both arms and legs to having differing degrees of ability in follow-up recordings. One, #7, developed the ability to perform only elbow flexion on one side. The other, #8, recovered for all tested tasks. Although the occurrence and degree of recovery varied across and within subjects and follow-up recording periods differed, the prevalence of volitional activation in this group of 9 increased from 67% to 100% for elbow flexion, 44% to 94% for elbow extension, 56% to 89% for wrist extension, 69% to 87% for hip and knee flexion, and 75% to 87% for ankle dorsiflexion but plantar flexion was 75% throughout.
Prime mover onset-to-peak recruitment time
Figure 1 illustrates progressive increase in the volitional activation of the biceps brachi muscle in one representative subject. Initial prime mover onset-to-peak times from the SCI group were highly variable but significantly delayed in comparison to those of the non-injured group (p < 0.01) (Table 2). Envelope peak amplitudes showed no significant difference between the two groups. One subject, #2, developed continuous background motor unit activity which interfered with the determination of sEMG onset. Onset-to-peak times decreased significantly with recovery in the remaining 8 subjects (p < 0.05).
Figure 1.
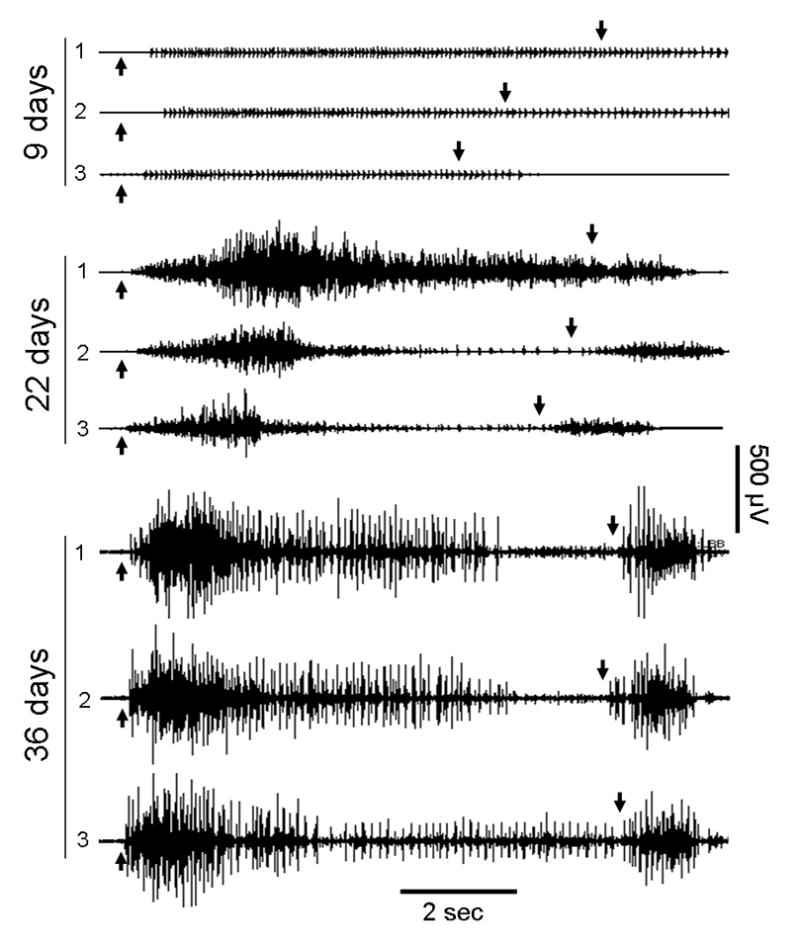
Biceps Brachi sEMG during three repeated trials of voluntary elbow flexion (auditory cue at up arrow) and extension (down arrow) performed in the supine position by subject #5 (C4, AIS-D). Serial recordings made 9, 22, and 36 days after injury show typical characteristics of changing motor control in the prime mover muscle for the task. Note that at first, only a few motor units can be fired, but with recovery, an increase in motor unit firing occurs with a progressive decrease in the time from the onset of activity to the peak of activation. Also, note the antagonistic co-activation of this muscle during the elbow extension phase of the motor task that developed over time.
Table 2.
Group average (± SD) onset-to-peak times and RMS envelope peak amplitudes for the prime mover muscles of voluntary motor tasks from 5 non-injured and 11 SCI subjects taken from the initial recording, first recording in which activity was present, and the final follow-up recording.
| Muscle | Onset to Peak Time | Amplitude | ||||||||
|---|---|---|---|---|---|---|---|---|---|---|
| Non-injured | SCI | Non-injured | SCI | |||||||
| Initial Recording | First seen | Follow-up | Initial | First seen | Follow-up | |||||
| (Sec ± SD) | number of sides | (Sec ± SD) | number of sides | (Sec ± SD) | (Sec ± SD) | (μV ± SD) | (μV ± SD) | (μV ± SD) | (μV ± SD) | |
| Biceps Brachi | 0.28 ± 0.17 | 11 | 1.33 ± 0.70** | 15 | 1.58 ± 0.80** | 1.22 ± 0.73 | 91 ±47 | 285 ± 519 | 69 ± 34 | 91 ± 46 |
| Wrist Extensors | 0.53 ± 0.39 | 10 | 1.76 ± 1.37* | 13 | 2.06 ± 1.04** | 1.36 ± 0.52* | 386 ± 162 | 304 ± 274 | 135 ± 151** | 173 ± 74 |
| Quadriceps | 0.42 ± 0.21 | 6 | 2.32 ± 0.70** | 12 | 1.51 ± 0.61** | 1.02 ± 0.53* | 51 ±15 | 44 ± 22 | 113 ± 81* | 62 ± 30 |
| Tibialis Anterior | 0.59 ± 0.28 | 11 | 4.17 ± 1.34** | 12 | 1.90 ± 1.31** | 0.89 ± 0.39* | 280 ± 20 | 214 ± 242 | 226 ± 236 | 267 ± 107 |
Note that times for SCI subjects in both initial and “first seen” columns were significantly longer than for controls and that times decreased significantly between “first seen” and final follow-up sessions in all but the biceps brachi muscle
p<0.05;
p< 0.01.
sEMG amplitudes
Mean sEMG envelope amplitudes were significantly lower for SCI group elbow flexion and extension, wrist extension, and ankle dorsiflexion (Table 3). Amplitudes increased between initial and final recordings but reached significance only for upper-limb tasks. During hip and knee flexion, contralateral hamstrings activity, an important component of the non-injured pattern, also increased significantly between initial and final recordings.
Table 3.
Non-injured and SCI group mean ASIA Impairment Scale (AIS) values and RMS amplitude values for the prime-mover muscles and functional EMG (fEMG) parameters, Similarity Index (SI) and Magnitude (Mag), for each motor task. Comparisons were made between SCI Initial values and non-injured group values and between SCI group initial and final values. Note that the SCI group changes were mostly in upper-limb muscles and their control.
| Prime Mover-Motor Task | Subject Group | AIS Motor Score | sEMG Amplitude | fEMG Parameters | ||||
|---|---|---|---|---|---|---|---|---|
| n = | Motor Score | n = | μV | % Responding) | SI | Mag | ||
| Biceps Brachi - Elbow Flexion | Non-injured | na | na | 10 | 70 ± 68 | 100 | 0.99 ± 0.02 | 60 ± 56 |
| SCI Initial | 15 | 2.0 ± 2.3 | 18 | 20 ± 23** | 61 | 0.46 ± 0.47** | 23 ± 26** | |
| SCI Final | 15 | 4.0 ± 1.4** | 18 | 61 ± 58** | 100 | 0.87 ± 0.19** | 69 ± 56** | |
| Triceps Brachi -Elbow Extension | Non-injured | na | na | 10 | 18 ± 11 | 100 | 0.97 ± 0.03 | 18 ± 10 |
| SCI Initial | 15 | 1.2 ± 2.0 | 18 | 6 ± 10** | 50 | 0.26 ± 0.36** | 0.8 ± 0.12* | |
| SCI Final | 15 | 3.3 ± 2.1** | 18 | 16 ± 14** | 100 | 0.76 ± 0.50** | 25 ± 13** | |
| Wrist Extensor-Wrist Extension | Non-injured | na | na | 10 | 199 ± 116 | 100 | 1.0 ± 0.00 | 207 ± 115 |
| SCI Initial | 16 | 1.4 ± 2.0 | 18 | 38 ± 61** | 44 | 0.37 ± 0.45** | 31 ± 59** | |
| SCI Final | 16 | 3.3 ± 2.2** | 18 | 91 ± 57** | 100 | 0.87 ± 0.29** | 98 ± 54** | |
| Quadriceps-Hip Knee Flexion | Non-injured | na | na | 10 | 15 ± 7 | 100 | 0.95 ± 0.04 | 45 ± 13 |
| SCI Initial | 16 | 2.4 ± 2.0 | 20 | 10 ± 15 | 55 | 0.44 ± 0.43** | 23 ± 30* | |
| SCI Final | 16 | 3.9 ± 1.8** | 20 | 15 ± 15 | 64 | 0.65 ± 0.44* | 40 ± 34 | |
| Tibialis Anterior-Ankle Dorsiflexion | Non-injured | na | na | 10 | 155 ± 57 | 100 | 1.0 ± 0.01 | 152 ± 58 |
| SCI Initial | 16 | 3.1 ± 2.1 | 20 | 60 ± 103* | 60 | 0.50 ± 0.46** | 64 ± 102** | |
| SCI Final | 16 | 3.9 ± 2.1 | 20 | 93 ± 84 | 64 | 0.69 ± 0.46* | 95 ± 84 | |
| Soleus-Ankle Plantar Flexion | Non-injured | na | na | 10 | 54 ± 25 | 100 | 0.94 ± 0.06 | 77 ± 23 |
| SCI Initial | 16 | 3.3 ± 2.1 | 20 | 33 ± 44 | 60 | 0.52 ± 0.45* | 0.41 ± 0.51* | |
| SCI Final | 16 | 3.9 ± 2.0* | 20 | 41 ± 57 | 64 | 0.54 ± 0.38 | 55 ± 61 | |
Multi-muscle activation patterns
Variance within the non-injured group prototypes for the tested tasks were similar to those previously reported.8, 9 In initial recordings, SCI group mean SI and magnitude values were lower than those of the non-injured group (Table 3). The degree of recovery was indicated by increased SI and Magnitude values at the end of the follow-up period. Figure 3 illustrates progressive change in the multi-muscle activation patterns from no volitional activation through a pattern that included co-activation of antagonistic and distant muscles to the appropriate pattern for ankle dorsiflexion within an individual subject. Increases in SI and Magnitude values occurred at different rates in different limb segments yielding a different index profile for each of the motor tasks within each individual (Figure 4) and across the SCI group (Figure 5).
Figure 3.

Profile of Similarity Index increase over time within an individual (subject #2) for all voluntary motor tasks. Note that recovery occurred at different rates for each task with elbow flexion being the slowest.
Figure 4.

Profile of SI changes for all 11 SCI subjects and all 6 tasks. Note the diverse distribution of initial values and change patterns.
Involuntary muscle activation
Within the group of nine people with SCI, five were able to relax completely during their initial examination while four produced low-amplitude continuous activation of one or more muscles. This form of activity appeared on follow-up in three others and disappeared in two by the final recording. No ‘spontaneous’ episodic spasms were observed. Responses were recorded from the muscles stretched in three of the eight subjects in whom passive movements were performed during the initial examination. However, of the ten muscles stretched in each study, only one to three responded in these three subjects. Responsiveness to stretch was found in follow-up recordings in six subjects, again not appearing in all 10 muscles tested. This responsiveness disappeared by the final recording in all but three of the nine subjects. Further, volitional activation of spasms distal to the injury was not seen in any initial recordings and developed on follow-up in only four subjects. Long duration ankle clonus was present in only one subject on initial recording and disappeared on follow-up. Finally, on initial examination, eight of the nine responded to plantar stimulation and four of those were able to volitionally reduce the response. Final recordings showed asymmetrical results with 5 of 18 limbs not responding, 10 responding but could be volitionally suppressed, and 3 that could not be suppressed.
ASIA Impairment Scale
AIS motor score data was available for eight of these nine subjects covering a follow-up period of 25 to 420 (184 ± 120) days post injury. Group mean motor scores increased significantly for elbow flexor and extensor, wrist extensor, and hip flexor muscles (p < 0.01) (Table 3). Ankle plantar flexor motor scores also increased significantly (p < 0.05) but ankle dorsiflexor motor score increase was not significant. Only five recordings in four subjects were performed within a day of the AIS assessment. Within these recordings, AIS motor scores correlated significantly (p < 0.01) with sEMG amplitude recorded from the prime mover muscle (ρ = 0.82). Also, SI and Magnitude values correlated with AIS motor scores (ρ = 0.84 both; p < 0.01). No subjects showed a decrease in AIS letter grade. For the nine in whom both upper and lower limbs were studied, AIS grades increased one letter in 3 subjects: #2, 60 days before recording; #3, 90 days before recording; #6, day of recording. In these three, Magnitude and SI values for both upper and lower limb tasks increased in follow-up recordings (Table 4). Neurological injury level moved caudally in six subjects, rostrally in one, did not change in one, and disappeared in one. Both magnitude and SI values increased for all (Table 4).
Table 4.
Comparison of Similarity Index (SI) and Magnitude values for SCI group members whose American Spinal Injury Association Impairment Scale (AIS) Grade, in 3 subjects, or neurological injury level improved in 6 subjects (n = number of sides). Note that AIS improvement was associated with significant increases in SI and Magnitude values primarily for upper-limb tasks for this group in whom impairment was initially most pronounced in the upper limbs.
| Prime Mover - Motor Task | AIS | Category Increased | Injury Level Moved Rostrally | ||||
|---|---|---|---|---|---|---|---|
| n = | SI | Mag | n = | SI | Mag | ||
| Biceps Brachi - Elbow Flexion | Initial | 6 | 0.15 ± 0.37 | 1 ± 2 | 12 | 0.48 ± 0.48 | 24 ± 25 |
| Final | 6 | 0.86 ± 21** | 47 ± 24** | 12 | 0.87 ± 0.18* | 60 ± 47* | |
| Triceps Brachi - Elbow Extension | Initial | 6 | 0±0 | 0±0 | 12 | 0.37 ± 0.40 | 12 ± 13 |
| Final | 6 | 0.81 ± 25** | 26 ± 16* | 12 | 0.85 ± 0.18** | 22 ± 12 | |
| Wrist Extensor - Wrist Extension | Initial | 6 | 0±0 | 0±0 | 12 | 0.56 ± 0.45 | 46 ± 68 |
| Final | 6 | 0.97 ± 0.04** | 115 ± 74* | 12 | 0.97 ± 0.04** | 102 ± 26** | |
| Quadriceps - Hip Knee Flexion | Initial | 4 | 0.54 ± 0.47 | 12 ± 5 | 12 | 0.57 ± 0.38 | 36 ± 33 |
| Final | 4 | 0.96 ± 0.03 | 53 ± 6** | 12 | 0.92 ± 0.06** | 58 ± 27 | |
| Tibialis Anterior - Ankle Dorsiflexion | Initial | 4 | 0.54 ± 0.23 | 24 ± 13 | 12 | 0.72 ± 0.41 | 100 ± 119 |
| Final | 4 | 0.95 ± 0.06* | 91 ± 40 | 12 | 0.98 ± 0.04* | 148 ± 64 | |
| Soleus - Ankle Plantar Flexion | Initial | 4 | 0.77 ± 0.12 | 41 ± 27 | 12 | 46 ± 68 | 64 ± 55 |
| Final | 4 | 0.64 ± 0.12 | 52 ± 38 | 12 | 102 ± 26** | 88 ± 57 | |
Discussion
The neurophysiological data presented here described recovery in terms of significant increases in: 1) the ability to activate, on command, motor units within the prime mover muscle for each specific task; 2) the rate at which those motor units were recruited; 3) the ability to appropriately organize the relative distribution of motor-unit activation across prime mover, antagonist, and distant muscles. The first of these three aspects of motor control is characterized by the AIS examination which produces a motor score from which a severity grade (A through E) and neurological injury level are determined. All of these increased for upper limb muscles during the follow-up term as did SI and Mag. However, it should be pointed out that the pattern of motor unit firings in multiple muscles during unloaded movements as in the neurophysiological examination and the forces perceived by an examiner during resisted contractions are related but not equivalent. The second and third parameters quantify previously unmeasured aspect of motor control and the analytic approaches that generate them avoid the statistical variance induced by subject-to-subject differences known to exist in sEMG raw amplitudes and the inherent inter- and intra-rater inconsistencies of clinical scales.
Potential mechanisms of recovery from SCI elucidated in animal models include: remyelination of long-tract fibers whose axons and synaptic connections to interneurons and motor neurons remained intact but were deprived of their myelin cover within the injury zone;3 new synaptic connections formed to re-occupy space vacated at the time of injury from surviving long-tract axons; 11, 12 new connections produced by sprouting from peripheral nerve fibers.13 The latter mechanism would likely be counterproductive for the recovery of voluntary motor control as it may increase responsiveness to muscle and cutaneous afferents and increase spasticity.13 In the current study, increased responsiveness to muscle stretch was transient, of low amplitude, in only a few muscles tested, and disappeared in all but three subjects. Although some developed increased responsiveness to cutaneous input, most also developed the ability to volitionally inhibit the response. Therefore, increasing voluntary control found in the data reported here was more likely a result of improvements within the long-tract systems of the spinal cord. Although any neurons with axons ending near spinal motor neurons or interneurons with vacated synaptic space would be candidates for post-injury synaptogenesis, the fEMG method used here minimizes the participation of vestibulospinal, reticulospinal, and propriospinal systems by testing in the fully-supported supine position. Thus the method as applied is likely to be most sensitive to corticospinal system function. In fact, within chronic SCI subjects, the responsiveness of the corticospinal system to transcranial magnetic stimulation was related to higher SI values for dorsiflexion14 and improvement of gait after training.15 In both studies, thresholds for the elicitation of motor evoked potentials from muscles caudal to the lesion were the lowest when motor control was the best.
A final component of the recovery process must certainly be the functional reorganization that cortical motor circuitry undergoes16 as it ‘learns’ to make the ‘best use’ of surviving and new corticospinal and cortico-bulbospinal architecture. Synergistic, co-activated, multi-muscle patterns reflecting the characteristics of the musculoskeletal system and the constraints to movement due to the physical environment are useful in the control of often-repeated movements.17 However, in disordered control as is characteristic of incomplete SCI, inappropriate co-activation decreases the forces developed during voluntary movement attempts.18 Although not specifically described in the literature, such co-activation would likely reduce endurance and contribute significantly to a person’s SCI-induced disability. Mechanisms of inhibitory control that are impacted by spinal cord injury include: presynaptic inhibition of Ia inputs from muscles being stretched;19 enhanced fusimotor activity of the static gamma motor neurons; nonreciprocal Ib inhibition;20 reciprocal or ‘disynaptic’ inhibition;21 recurrent or Renshaw inhibition.21 All but the Renshaw inhibitory process would be involved in the refinement of volitional control after SCI. Further, the reduction in responsiveness to passive stretch and cutaneous input suggests an increase in the efficacy of inhibitory control.
In humans, no methods have been developed to independently monitor changes specific to each of the excitatory and inhibitory processes listed above. However, it is possible to monitor net effects as they work in parallel to increase long-tract synaptic connections to spinal motor circuits. For example, in a coarse fashion, the AIS can be used to recognize large changes as Marino and coworkers did in 1999 when they reported that of 775 initially motor-complete SCI subjects, 16% became incomplete within the first year after injury.22 Neurophysiological measures offer greater sensitivity to this net change. For example, greater than 60% of persons clinically categorized as motor-complete lesions, AIS-A or B, have been shown to have residual translesional ability to modulate spinal motor excitability.6 In the current report, the rate of recruitment of prime mover muscle motor units would be difficult to measure without sEMG. Further, the co-activation of antprime moveric and distant muscles during voluntary movement attempts, a common feature within the AIS-C and D categories,18 can only be captured through neurophysiological examination.
The neurophysiological quantification of recovery or intervention effect offers the potential for greater sensitivity and reliability but additional study is needed. First, the fEMG protocol used here should be reduced to focus on specific body regions. Each phase of the voluntary movement tasks should be performed independently from as nearly complete relaxation as is possible. In addition, they should be performed self-paced, as in this study, and repeated under instruction to do so as fast as is possible to provide true reaction-time information and test the maximum rate or prime mover recruitment. Further, better temporal synchronization of fEMG and clinical assessment scale sessions is needed to better relate findings to currently recognized measures. Finally, fEMG parameters introduced here need to be compared to clinically-relevant measures of function to examine clinical and predictive capacity. Regardless, the findings presented here introduce new parameters that are objectively derived from non-invasively acquired spinal motor output with which clinicians and clinical researchers can measure and track changes in spatiotemporal aspects of motor control recovery that may result from spontaneous recovery as in the current study, or that may result from intervention or additional disease processes.
Figure 2.

Voluntary right ankle dorsiflexion performed by a subject (#9) with an initial injury level at C5, who improved to the level of L2. Serial recordings made 11, 27, 45, and 135 days post onset show the evolution of control in which the prime mover (RTA) amplitude increases, at first along with coactivation of other muscles followed by the reduction of activation in all but the prime mover. The Cue mark is 5 seconds.
Acknowledgments
The authors would like to express their appreciation to the subjects who participated in this study, Anne Watson, RN for project management support, and Renee Ford for obtaining informed consent and coordination of study scheduling. We are also grateful to Yangsheng Chen, PhD for data conversion and Dongchul Lee, PhD and Matthew Nitzken for their preparation of tools used in the calculation of the voluntary response index. In addition, we would like to acknowledge the Neurosurgery Residents at the University of Louisville Hospital for providing the clinical assessments reported in this study. This study was supported by NIH NINDS funded project #NS049954-01.
References
- 1.Yilmaz F, Sahin F, Aktug S, Kuran B, Yilmaz A. Long-Term Follow-up of Patients with Spinal Cord Injury. Neurorehabil Neural Repair. 2005;19(4):332–7. doi: 10.1177/1545968305280210. [DOI] [PubMed] [Google Scholar]
- 2.Illis LS. The motor neuron surface and spinal shock. In: Williams Denis., editor. Modern Trends in Neurology. 0. Vol. 4. Vol. 4. Appleton-Century-Crofts; 1967. pp. 53–68. [PubMed] [Google Scholar]
- 3.Sasaki M, Li B, Lankford KL, Radtke C, Kocsis JD. Remyelination of the injured spinal cord. Prog Brain Res. 2007;161:419–33. doi: 10.1016/S0079-6123(06)61030-3. [DOI] [PMC free article] [PubMed] [Google Scholar]
- 4.Kakulas BA. Neuropathology: the foundation for new treatments in spinal cord injury (Sir Ludwig Guttman Lecture) Spinal Cord. 2004;42:549–563. doi: 10.1038/sj.sc.3101670. [DOI] [PubMed] [Google Scholar]
- 5.Marino RJ, Barros T, Biering-Sorensen F, Burns SP, Donovan WH, Graves DE, Haak M, Hudson LM, Priebe MM ASIA Neurological Standards Committee. International standards for neurological classification of spinal cord injury. J Spinal Cord Med. 2003;26 (Suppl 1):S50–6. doi: 10.1080/10790268.2003.11754575. [DOI] [PubMed] [Google Scholar]
- 6.McKay WB, Lim HK, Priebe MM, Stokic DS, Sherwood AM. Clinical neurophysiological assessment of residual motor control in post-spinal cord injury paralysis. Neurorehabil Neural Repair. 2004;18(3):144–53. doi: 10.1177/0888439004267674. [DOI] [PubMed] [Google Scholar]
- 7.Calancie B, Molano MR, Broton JG. EMG for assessing the recovery of voluntary movement after acute spinal cord injury in man. Clin Neurophysiol. 2004;115(8):1748–59. doi: 10.1016/j.clinph.2004.03.002. [DOI] [PubMed] [Google Scholar]
- 8.Lee DC, Lim HK, McKay WB, Priebe MM, Holmes SA, Sherwood AM. Toward an objective interpretation of surface EMG patterns: a voluntary response index (VRI) J Electromyogr Kinesiol. 2004;14:379–388. doi: 10.1016/j.jelekin.2003.10.006. [DOI] [PubMed] [Google Scholar]
- 9.Lim HK, Sherwood AM. Reliability of surface electromyographic measurements from subjects with spinal cord injury during voluntary motor tasks. J Rehab Res Dev. 2005;42(4):413–422. doi: 10.1682/jrrd.2004.07.0079. [DOI] [PubMed] [Google Scholar]
- 10.Sherwood AM, McKay WB, Dimitrijevic MR. Motor control after spinal cord injury: assessment using surface EMG. Muscle Nerve. 1996;19(8):966–79. doi: 10.1002/(SICI)1097-4598(199608)19:8<966::AID-MUS5>3.0.CO;2-6. [DOI] [PubMed] [Google Scholar]
- 11.Hill CE, Beattie MS, Bresnahan JC. Degeneration and sprouting of identified descending supraspinal axons after contusive spinal cord injury in the rat. Exp Neurol. 2001;171:153–169. doi: 10.1006/exnr.2001.7734. [DOI] [PubMed] [Google Scholar]
- 12.Fouad K, Tse A. Adaptive changes in the injured spinal cord and their role in promoting functional recovery. Neurol Res. 2008;30:17–27. doi: 10.1179/016164107X251781. [DOI] [PubMed] [Google Scholar]
- 13.McCough GP, Austin GM, Liu CN, Liu CY. Sprouting as a cause of spasticity. J Neurophysiol. 1958 May;21(3):205–16. doi: 10.1152/jn.1958.21.3.205. [DOI] [PubMed] [Google Scholar]
- 14.McKay WB, Lim HK, Priebe MM, Stokic DS, Sherwood AM. Neurophysiological examination of the corticospinal system and voluntary motor control in motor-incomplete human spinal cord injury. Exp Br Res. 2005;163:379–387. doi: 10.1007/s00221-004-2190-9. [DOI] [PubMed] [Google Scholar]
- 15.Thomas SL, Gorassini MA. Increases in corticospinal tract function by treadmill training after incomplete spinal cord injury. J Neurophysiol. 2005;94(4):2844–55. doi: 10.1152/jn.00532.2005. [DOI] [PubMed] [Google Scholar]
- 16.Crawley AP, Jurkiewicz MT, Yim A, Heyn S, Verrier MC, Fehlings MG, Mikulis DJ. Absence of localized grey matter volume changes in the motor cortex following spinal cord injury. Br Res. 2004;1028:19–25. doi: 10.1016/j.brainres.2004.08.060. [DOI] [PubMed] [Google Scholar]
- 17.Tresch MC, Jarc A. The case for and against muscle synergies. Curr opin neurobiol. 2009;19:601–607. doi: 10.1016/j.conb.2009.09.002. [DOI] [PMC free article] [PubMed] [Google Scholar]
- 18.Lim HK, Lee D, McKay WB, Priebe MM, Holmes SA, Sherwood AM. Neurophysiological assessment of lower-limb voluntary control in incomplete spinal cord injury. Spinal Cord. 2005;43(5):283–90. doi: 10.1038/sj.sc.3101679. [DOI] [PubMed] [Google Scholar]
- 19.Knikou M. Effects of hip joint angle changes on intersegmental spinal coupling in human spinal cord injury. Exp Brain Res. 2005;167(3):381–93. doi: 10.1007/s00221-005-0046-6. [DOI] [PMC free article] [PubMed] [Google Scholar]
- 20.McCrea DA. Neuronal basis of afferent-evoked enhancement of locomotor activity. Ann N Y Acad Sci. 1998;16:860, 216–25. doi: 10.1111/j.1749-6632.1998.tb09051.x. [DOI] [PubMed] [Google Scholar]
- 21.Nielsen JB, Crone C, Hultborn H. The spinal pathophysiology of spasticity--from a basic science point of view. Acta Physiol (Oxf) 2007;189(2):171–80. doi: 10.1111/j.1748-1716.2006.01652.x. [DOI] [PubMed] [Google Scholar]
- 22.Marino RJ, Ditunno JF, Donovan WH, Maynard F. Neurologic recovery after traumatic spinal cord injury: Data from the Model Spinal Cord Injury Systems. Arch Phys Med Rehabil. 1999;80:1291–1396. doi: 10.1016/s0003-9993(99)90249-6. [DOI] [PubMed] [Google Scholar]