

Abstract
In this study our aim was to investigate the time courses of inflammation, oxidative stress and tissue damage after hyperoxia in the mouse lung. Groups of BALB/c mice were exposed to 100% oxygen in a chamber for 12, 24 or 48 h. The controls were subjected to normoxia. The results showed that IL-6 increased progressively after 12 (P < 0.001) and 24 h (P < 0.001) of hyperoxia with a reduction at 48 h (P < 0.01), whereas TNF-α increased after 24 (P < 0.001) and 48 h (P < 0.001). The number of macrophages increased after 24 h (P < 0.001), whereas the number of neutrophils increased after 24 h (P < 0.01) and 48 h (P < 0.001). Superoxide dismutase activity decreased in all groups exposed to hyperoxia (P < 0.01). Catalase activity increased only at 48 h (P < 0.001). The reduced glutathione/oxidized glutathione ratio decreased after 12 h (P < 0.01) and 24 h (P < 0.05). Histological evidence of lung injury was observed at 24 and 48 h. This study shows that hyperoxia initially causes an inflammatory response at 12 h, resulting in inflammation associated with the oxidative response at 24 h and culminating in histological damage at 48 h. Knowledge of the time course of inflammation and oxidative stress prior to histological evidence of acute lung injury can improve the safety of oxygen therapy in patients.
Keywords: hyperoxia, inflammation, lung, mouse, oxidative stress
Acute lung injury (ALI) affects a large number of patients worldwide, with reported mortality rates of 35–40% (Rubenfeld & Herridge 2007). Many patients with ALI require oxygen supplementation to maintain adequate tissue oxygenation, leading to hyperoxia (Fisher & Beers 2008). However, exposure to hyperoxia can have pathological effects, such as lung inflammation and oedema accompanied by epithelial and endothelial cell death, suggesting that oxygen supplementation, although necessary, may potentially perpetuate or exacerbate ALI (Bhandari et al. 2006; Bhandari 2008). Paradoxically, hyperoxia may cause ALI and damage to components of the extracellular matrix (Murray et al. 2008). Moreover, hyperoxia has been linked to the production of reactive oxygen species (ROS) and subsequent oxidative stress (Huang et al. 2009). Reactive oxygen species are important mediators in ALI, attacking biological molecules and causing lipid peroxidation, protein oxidation and DNA breakage (Papaiahgari et al. 2006).
Under physiological conditions, living organisms maintain a balance between the formation and removal of ROS (Owuor & Kong 2002). The antioxidant enzymes superoxide dismutase (SOD), catalase (CAT) and glutathione peroxidase and non-enzymatic antioxidants, such as α-tocopherol, vitamin-C, carotenoids and the glutathione system, all prevent the formation of toxic levels of ROS. Oxidative stress occurs when the generation of ROS in a system exceeds the system’s capacity to neutralize and eliminate the ROS (Sies 1997). This imbalance can result from a deficiency of the antioxidant system owing to decreased synthesis or increased consumption linked to an over-abundance of ROS from an environmental or behavioural stressor, such as hyperoxia (Ghezzi et al. 2005). In addition, hyperoxia incites the release of a large number of pro-inflammatory cytokines, such as tumour necrosis factor alpha (TNF-α) and interleukin-6 (IL-6) (Ogawa et al. 2007). The exact mechanisms of hyperoxia-induced toxicity in the lung are complex, but evidence suggests that inflammation and oxidative stress are important co-mediators of ALI (Reddy et al. 2009).
We have previously demonstrated the effects of short-duration hyperoxic exposure and different doses of hyperoxia on Wistar rat lungs. In the first study, after 90 min of exposure, hyperoxia induced alterations in rat lung parenchymas, although no structural damage was evident; inflammatory cell influxes, extravasation of red blood cells and oedema were the most important alterations identified (Valenca Sdos et al. 2007). In the second study, Wistar rats exposed to 50% or 75% oxygen for 90 min did not exhibit lung alterations, whereas 100% oxygen for the same duration induced interstitial oedema and large numbers of red blood cells in the alveoli (Nagato et al. 2009). In this study our aim was to investigate the time courses of inflammation, oxidative stress and tissue damage after hyperoxia in BALB/c mouse lungs. To achieve this goal, we used different periods of hyperoxia exposure: 12, 24 and 48 h. BALB/c mice were used in this study because this strain is sensitive to hyperoxia and presents an appropriate response to lung inflammation and damage (Ho 2002; Whitehead et al. 2006).
Materials and methods
Animals
Male BALB/c mice (8 weeks old; 20–24 g) were purchased from the Instituto de Veterinária – Universidade Federal Fluminense (Niterói, Brazil). The mice were housed in an environment-controlled room with constant 24-h light/dark cycle conditions (12-h light/12-h dark, lights on at 6 pm). The ambient temperature was maintained at 25 ± 2 °C, and the relative humidity was approximately 80%. The animals were provided with water and food (Purine Chow) ad libitum. The study was conducted according to the Brazilian Federal Guidelines for Laboratory Animal Use and Care (Brazilian Law 11,794 from 12/08/2008). The experimental design was approved by the Ethics Committee of the Instituto de Biologia Roberto Alcântara Gomes, with protocol number CEA/010/2009.
Hyperoxia protocol
The animals were exposed to hyperoxic conditions in an inhalation chamber (length = 30 cm, width = 20 cm and height = 15 cm) as previously described by our group (Valenca Sdos et al. 2007; Nagato et al. 2009). Oxygen was acquired from White Martins® (White Martins Praxair Inc., São Paulo, Brazil). The oxygen tank was coupled to the inhalation chamber using a silicone conduit. The mice were randomly divided into four experimental groups of ten animals each: the control group was exposed to normoxia; the 12-h group was exposed to 100% oxygen for 12 h; the 24-h group was exposed to 100% oxygen for 24 h; and the 48-h group was exposed to 100% oxygen for 48 h. The oxygen concentration in the chamber was monitored continuously using an oxygen cell (C3, Middlesbrough, UK). The animals were euthanized by cervical dislocation immediately after being exposed to hyperoxia. The blood was flushed from the pulmonary vasculature, and the lungs were then harvested. The right lung was set aside for histology, and the left lung was used to perform bronchoalveolar lavage (BAL) and to prepare tissue homogenates. This experimental design was repeated twice.
Bronchoalveolar lavage (BAL)
The left lung airspaces were washed with a buffered saline solution (500 μl) three times (final volume 1.2–1.5 ml). The BAL fluid was withdrawn and stored on ice. The total amount of mononuclear and polymorphonuclear cells was determined using a Zi Coulter counter (Beckman Coulter, Carlsbad, CA, USA). Differential cell counts were performed using cytospin preparations (Shandon, Waltham, MA, USA) stained with Diff-Quik. At least 200 cells per BAL sample were counted using the standard morphologic criteria.
Biochemical analyses
All chemicals were purchased from Sigma-Aldrich Chemical Co., (St. Louis, MO, USA) unless otherwise specified. All measurements described below were taken on lung homogenates, unless otherwise specified, using a spectrophotometer (Beckman model DU 640; Fullerton, CA, USA) or a microplate reader (Bio-Rad model 550, Hercules, CA, USA). Superoxide dismutase activity was assayed by measuring the inhibition of adrenaline auto-oxidation as the absorbance at 480 nm (Bannister & Calabrese 1987). Catalase (CAT) activity was determined from the rate of decrease in the concentration of hydrogen peroxide, which was determined from the absorbance at 240 nm (Aebi 1984). Myeloperoxidase (MPO) activity was determined in BALs with hydrogen peroxide, hexadecyltrimethylammonium bromide and 3,3′,5,5′-tetramethylbenzidine by measuring the absorbance in a plate reader at 630 nm (Kuebler et al. 1996). The ratio of reduced glutathione (GSH) to disulphide glutathione (GSSG) was based on the reaction of GSH or GSSG with 5,5′-dithiobis-(2-nitrobenzoic acid), which produces the 2-nitro-5-thiobenzoate chromophore that absorbs at 412 nm (Rahman et al. 2006). To determine the GSSG levels, samples were treated with 2-vinylpyridine, which covalently reacts with GSH but not with GSSG. The level of malondialdehyde (MDA) was measured during an acid-heating reaction with thiobarbituric acid and was determined from the absorbance at 532 nm (Draper & Hadley 1990). The presence of nitrite was determined in BALs using a method based on the Griess reaction (1% sulphanilamide in 5% phosphoric acid and 0.1% naphthalenediamine dihydrochloride in water) followed by measuring the absorbance in a plate reader at 550 nm (Green et al. 1982). The presence of hydroxyproline (OH-proline) was determined using a colorimetric method based on the reaction of chloramine-T, perchloric acid and p-dimethylbenzaldehyde. The colour profile that developed was measured at 557 nm (Woessner 1961). The cytotoxicity was evaluated using the (3-(4,5-dimethylthiazol-2-yl)-2,5-diphenyltetrazolium bromide (MTT) assay in BAL cells cultured with Dulbecco’s modified Eagle’s medium. After incubation, the absorbance was measured at 540 nm (Putnam et al. 2002). The total protein contents in the BALs and lung tissue homogenates were determined according to Bradford’s method (Bradford 1976).
Cytokine analysis
The levels of pro-inflammatory mediators including tumour necrosis factor α (TNF-α) and interleukin-6 (IL-6) were measured in the lung homogenates using ELISA with the respective duo-antibody kits (PeproTech Inc., Rocky Hill, NJ, USA).
Zymography
Aliquots of lung homogenates (30 μg protein) were subjected to electrophoresis in 8% acrylamide stacking gel–7% acrylamide separating gel containing 1 mg/ml gelatin in the presence of sodium dodecylsulphate (SDS) under non-reducing conditions. After electrophoresis, the gels were washed twice with 2.5% Triton X-100, rinsed with water and incubated at 37 °C overnight in 50 mM Tris–HCl, 5 mM CaCl2 and 2 nM ZnCl2 (pH 8). The gels were stained with Coomassie blue and destained in a solution of 25% ethanol and 10% acetic acid. The matrix metalloproteinase (MMP)-2 and/or MMP-9 activities appeared as clear bands against the blue background. The molecular weights of the gelatinolytic bands were estimated using 30 μg of protein from a placental sample (Niu et al. 2000).
Western blotting
Aliquots of lung homogenates (30 μg protein) were subjected to electrophoresis through 8% acrylamide stacking gel–7% acrylamide separating gel in the presence of SDS under non-reducing conditions. After electrophoresis, the proteins were transferred to polyvinylidene difluoride (PVDF) membranes (Amersham Pharmacia Biotech, GE Healthcare Bio-Sciences Co., Piscataway, NJ, USA). Rainbow markers (Amersham Pharmacia Biotech) were run in parallel to estimate the molecular weights. The membranes were blocked with Tween–TBS (20 mM Tris–HCl, pH 7.5, 500 mM NaCl, 0.5% Tween-20) containing 2% bovine serum albumin and probed with a specific goat anti-mouse IL-6 primary antibody (1:1000) (Santa Cruz Biotechnology, Santa Cruz, CA, USA). After extensive washing in Tween-TBS, the PVDF membranes were incubated with biotin-conjugated donkey anti-goat IgG (1:1000) for 1 h and then incubated with horseradish peroxidase-conjugated streptavidin (1:1000) (Santa Cruz Biotechnology). The immunoreactive proteins were visualized using 3,3′-diaminobenzidine staining. The membranes were stained with Ponceau to estimate the total protein. No differences were identified among the groups.
Histology, morphometry and stereology
The left lung was ligated, and the right lung of each mouse was inflated by instilling 4% formalin buffer at 25 cm H2O pressure for 2 min to avoid formalin leaks; the lungs were then ligated and removed. The inflated lungs were fixed for 48 h before being embedded in paraffin. Serial sagittal sections were obtained for histological, stereological and morphometric analyses. Five-micron-thick tissue sections were stained with Giemsa and haematoxylin and eosin (H&E). For the immunohistochemistry, the primary antibody used was goat anti-mouse TNF-α (Santa Cruz Biotechnology). For detection, a biotinylated secondary antibody and an avidin–biotin peroxidase with 3,3′-diaminobenzidine were used according to the manufacturer’s instructions (Santa Cruz Biotechnology). After staining for TNF-α, the lung sections were counterstained with haematoxylin. Lung sections stained with an isotype control-matched primary antibody were used to confirm non-specific expression.
The total numbers of alveolar macrophages (AMs) and neutrophils (PMNs) were estimated by counting ten different fields in the Giemsa-stained sections (five random fields of two sections), which were analysed using a 40× objective lens on a video microscope (Carl Zeiss model Axiolab, Oberkochen, Germany) linked to a colour video camera (JVC model TK-C380, Tokyo, Japan) and a Sony Trinitron colour video monitor (model PVM-14N2U, London, UK). A total area of 0.77 mm2 was analysed to determine the numbers of AMs and PMNs in each lung section, as previously described (Valenca et al. 2004; Menegali et al. 2009). The number of macrophages that were positive for TNF-α was estimated by counting ten different fields, as described above. The AMs positive for TNF-α were counted and divided by the total number of AMs (negative and positive) to obtain an immunohistochemical index (IHI) (Valenca & Porto 2008).
The lung parenchymas were quantified stereologically using a test system composed of 42 points in a known test area delineated by the forbidden line to avoid overestimating the number of structures. The test system was attached to a monitor connected to a microscope. The points (PP) that intercepted the alveolar septa [Vv lung parenchyma (Vv[par]] were counted and compared with the total number of points of a test system (PT). Therefore, the volume density (Vv) is equal to the PP divided by the PT (Davies 1991). Ten fields (five non-overlapping fields in two different sections) were randomly analysed using a 20× objective lens on a video microscope, as described above. A total area of 1.54 mm2 was analysed to determine the Vv[par] values in the H&E-stained sections. Two investigators took all of the measurements by counting blinded sections.
Statistical analysis
The data are presented as the mean ± standard error of the mean (SEM). For continuous data, we used a one-way anova followed by the Student–Newman–Keuls post hoc test (for SOD, CAT, MDA, nitrite, OH-proline, protein, IL-6, TNF-α, BAL and morphometry results). For non-continuous data, we used the Kruskal–Wallis test followed by the Dunn’s post hoc test (for GSH/GSSG, MTT and stereology results). In all instances, the significance level was set at 5% (P < 0.05).
Results
The time course of hyperoxia in relation to biochemical analysis
The biochemical markers of redox balance (SOD and CAT), lung injury (MPO), oxidative stress (GSH/GSSG), oxidative damage (MDA), nitric oxide action (nitrite), collagen breakdown (OH-proline) and fluid extravasation (protein) were measured in BALs or lung tissue homogenates, and the results are shown in Table 1. SOD activity decreased by approximately 30% (P < 0.01) after 12 h of hyperoxia and by 22% (P < 0.01) after 24 and 48 h compared with the control group. CAT activity increased by approximately 50% after 48 h of hyperoxia when compared with the control group (P < 0.001). MPO activity increased by approximately 52% (P < 0.001) after 24 h and by 32% (P < 0.05) after 48 h of hyperoxia compared with the control group. The GSH/GSSG ratio decreased by approximately 23% after 12 h (P < 0.01) and by 21% (P < 0.05) after 24 h of hyperoxia compared with the control group. Malondialdehyde increased by approximately 92% after 12 h (P < 0.001) and by 50% (P < 0.05) after 24 h of hyperoxia compared with the control group. Nitrite increased by approximately 41% after 12 h and by 48% after 24 h of hyperoxia (P < 0.001) compared with the control group. Hydroxyproline increased by approximately 48% after 12 h and 24 h of hyperoxia (P < 0.001) compared with the control group. Finally, the level of total proteins in the BALs decreased by 30% (P < 0.05) after 12 h and by 20% (P < 0.05) after 24 h of hyperoxia but increased by approximately 20% (P < 0.05) after 48 h compared with the control group. The level of total proteins in lung homogenates increased by 18% (P < 0.05) after 12 h and by 22% (P < 0.01) after 24 h of hyperoxia compared with the control group.
Table 1.
Biochemical analysis of oxidative stress and inflammatory markers in BAL fluid or lung tissue homogenates from mice exposed to 100% oxygen for 12, 24 and 48 h
| Group | Control | 12 h | 24 h | 48 h |
|---|---|---|---|---|
| SOD activity (U/mg protein) | 64.43 ± 2.70 | 45.40 ± 2.14** | 50.20 ± 2.75** | 50.30 ± 0.60** |
| CAT activity (U/mg protein) | 0.68 ± 0.04 | 0.57 ± 0.03 | 0.64 ± 0.04 | 1.02 ± 0.06*** |
| MPO† activity (mU/mg protein) | 3.25 ± 0.05 | 3.43 ± 0.17 | 4.94 ± 0.27*** | 4.30 ± 0.24* |
| GSH/GSSG ratio | 1.25 ± 0.06 | 0.96 ± 0.04** | 0.98 ± 0.02* | 1.11 ± 0.03 |
| MDA (nM/mg protein) | 0.14 ± 0.01 | 0.27 ± 0.02*** | 0.21 ± 0.02* | 0.13 ± 0.01 |
| Nitrite† (mM/mg protein) | 86.48 ± 2.66 | 146.60 ± 5.39*** | 167.30 ± 11.83*** | 100.90 ± 2.96 |
| OH-proline (ng/mg protein) | 172.70 ± 11.15 | 255.10 ± 6.47*** | 257.4 ± 14.27*** | 160.70 ± 8.21 |
| Protein† (μg/μl) | 0.10 ± 0.00 | 0.07 ± 0.01* | 0.08 ± 0.01* | 0.12 ± 0.01* |
| Protein‡ (μg/μl) | 6.85 ± 0.28 | 8.07 ± 0.15* | 8.35 ± 0.20** | 6.96 ± 0.30 |
| IL-6 (ng/ml) | 0.99 ± 0.10 | 3.10 ± 0.21*** | 3.58 ± 0.17*** | 1.89 ± 0.19** |
| TNF-α (ng/ml) | 1.06 ± 0.06 | 1.29 ± 0.08 | 2.05 ± 0.09*** | 2.80 ± 0.13*** |
SOD, superoxide dismutase; CAT, catalase; MPO, myeloperoxidase; GSH, reduced glutathione; GSSG, oxidized glutathione; MDA, malondialdehyde; OH-proline, hydroxyproline; IL-6, interleukin 6; TNF-α, tumour necrosis factor alpha; BAL, bronchoalveolar lavage.
Measurements taken in BAL fluid.
Measurements taken in tissue homogenates.
Values are the means ± standard error of the mean. For statistical evaluation of SOD, CAT, MPO, MDA, nitrite, OH-proline, protein levels, IL-6 and TNF-α, we used a one-way anova followed by the Student–Newman–Keuls post hoc test. For the GSH/GSSG ratio, we used the Kruskal–Wallis test followed by the Dunn’s post hoc test. In all instances, the significance level was set at 5%. *P < 0.05 compared to the control group; **P < 0.01 compared to the control group; ***P < 0.001 compared to the control group. N = 10 per group.
A biochemical marker of cytotoxicity (MTT level) was assayed using inflammatory cells recovered from BAL fluid. MTT decreased by approximately 50% (P < 0.05) after 24 and 48 h of hyperoxia compared with the control group (Figure 1).
Figure 1.
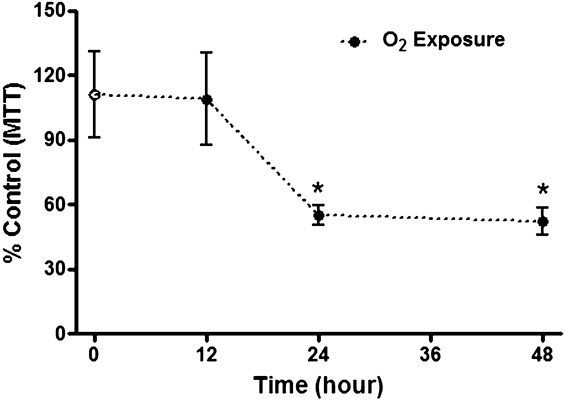
The cytotoxicity was evaluated using the MTT assay with the bronchoalveolar lavage cells cultured in DMEM. After incubation, the absorbance was measured at 540 nm. The cytotoxicity is represented by a black circle after 12, 24 and 48 h of hyperoxia or with a white circle after normoxia. The values are expressed as percentages relative to the control group by the mean ± standard error of the mean (SEM). The groups were tested for significance using the Kruskal–Wallis test followed by the Dunn post hoc test; the significance level was set as 5%. *P < 0.05 compared with the control group (N = 5 per group). This test was performed in the first experiment only.
The time course of hyperoxia in relation to MMP-2 and MMP-9 activities
MMP-2 and MMP-9 activities are shown in Figure 2. The lung homogenates from mice exposed to hyperoxia for 48 h exhibited increases in MMP-2 and MMP-9 activities compared with the control group.
Figure 2.
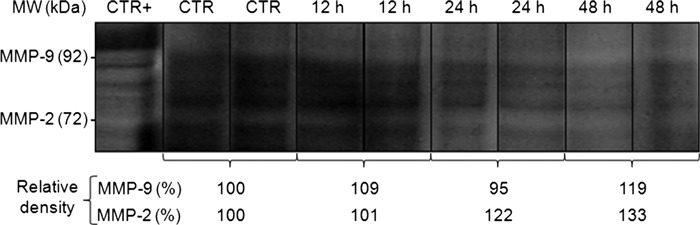
MMP-2 and MMP-9 activities in the lung tissue homogenates from mice exposed to normoxia (control group) or hyperoxia (12, 24 and 48 h). The samples (30 μg protein) were subjected to electrophoresis in a separating gel containing gelatin. After electrophoresis, the gel was stained with Coomassie blue, and the MMP-2 and/or MMP-9 activities appeared as clear bands against the blue background. The positive control was human placenta. The negative bands were assessed using densitometry (N = 2 per group). This test was performed in the first experiment only.
The time course of hyperoxia in relation to IL-6 and TNF-α
IL-6 expression by western blotting is shown in Figure 3. The lung homogenates from mice exposed to hyperoxia showed a progressive increase in IL-6 expression from 12 to 24 h, with a reduction at 48 h compared with the control group. IL-6 and TNF-α levels were determined using ELISA and are shown in Table 1. The lung homogenates from mice exposed to hyperoxia showed a progressive increase in IL-6 levels from 12 h (P < 0.001) to 24 h (P < 0.001), with a reduction at 48 h (P < 0.01) compared with the control group. We also observed a progressive increase in TNF-α levels from 24 h (P < 0.001) to 48 h (P < 0.001) compared with the control group.
Figure 3.
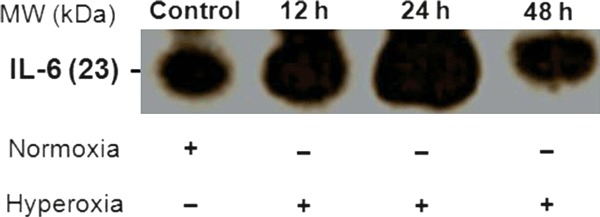
Western blotting for IL-6 expression in the lung tissue homogenates from mice exposed to normoxia (control group) or hyperoxia (12, 24 and 48 h). The samples were subjected to electrophoresis through a separating gel. After electrophoresis, the proteins were transferred to polyvinylidene difluoride membranes, and the specific primary antibody for IL-6 was incubated with the membrane overnight. After incubation with the secondary antibody, DAB was used to detect the immunoreactive bands. This procedure was repeated two times. The membrane was stained with Ponceau red as the control (N = 1 per group). This test was performed in the first experiment only.
The time course of hyperoxia in relation to lung histology, BAL, morphometry and stereology
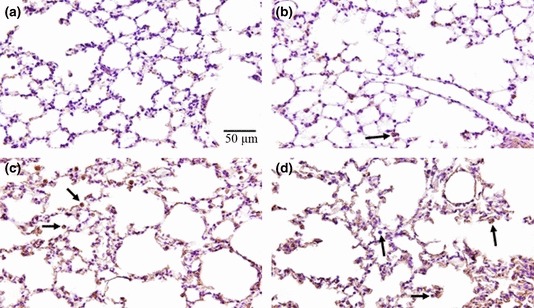
Table 2 presents a score for the evaluation of ALI in accordance with what we have observed in lung histology. The alveolar septa and pulmonary capillaries were preserved both in the control group and in the mice exposed to hyperoxia for 12 h, with no evidence of ALI (Figure 4a,b). However, at 12 h, we observed an increase in the interstitial cellularity, mainly in terms of leucocytes. After 24 h of hyperoxia, low levels of septal oedema were observed (Figure 4c), and infrequently after 48 h, red blood cells in the alveoli could be seen together with alveolar macrophages and neutrophils (Figure 4d). The TNF-α staining was negligible in lung parenchymas after 12 h (Figure 5b) and 24 h (Figure 5c) of hyperoxia, but the decrease was much more evident after 48 h (Figure 5d) compared with the control group (Figure 5a). In contrast, TNF-α was more evident in the bronchial epithelia after 12 h of hyperoxia (Figure 6b) than after 24 h (Figure 6c) and 48 h (Figure 6d) compared with the control group (Figure 6a). The macrophage influx into the BAL was increased by 90% after 24 h (P < 0.001) and by 36% after 48 h (P < 0.05) of hyperoxia compared with the control group (Table 3). Although there was a trend towards the reduction in macrophages after 48 h of hyperoxia, the influx of PMNs into the BAL increased progressively by eightfold in 24 h (P < 0.001) and by 11-fold in 48 h (P < 0.001) compared with the control group (Table 3). The number of AMs was approximately 37% (P < 0.05) lower after 12 h of hyperoxia compared with the control (P < 0.05); after 24 h of hyperoxia, the AM numbers had increased to approximately 87% (P < 0.001) of the control values (Table 3). The number of PMNs was approximately 78% (P < 0.001) lower after 12 h of hyperoxia compared with the control, whereas the number of PMNs increased by approximately 77% (P < 0.01) after 24 h and by 238% (P < 0.001) after 48 h of hyperoxia compared with the control group (Table 3). The IHI increased by 71% after 24 h and by 68% after 48 h of hyperoxia (P < 0.05) compared with the control group (Table 3). The volume density of the parenchyma (Vv[par]) increased by 28% (P < 0.05) after 48 h of hyperoxia compared with the control group (Table 3).
Table 2.
Inflammatory scores of mouse lungs exposed to 100% oxygen for 12, 24 and 48 h
| Groups | Alveolar congestion | Haemorrhage | Infiltration of leucocytes | Alveolar wall thickness |
|---|---|---|---|---|
| Control | – | – | – | – |
| 12 h | – | – | 2 | – |
| 24 h | 2 | – | 2 | – |
| 48 h | 2 | 3 | 3 | 2 |
Acute lung injury was scored in each sample (median of n = 5 for each group) according to the following four items: alveolar congestion, haemorrhage, infiltration of leucocytes in lung tissue and thickness of the alveolar wall/hyaline membrane formation. Each item was graded according to a 5-point scale: 0, minimal (little) damage; 1, mild damage; 2, moderate damage; 3, severe damage; and 4, maximal damage.
Figure 4.
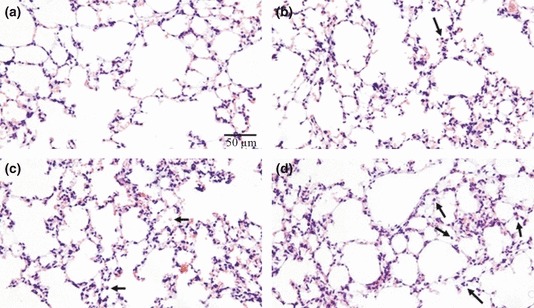
Lung histology in sections stained with haematoxylin and eosin. (a) Control mouse exposed to normoxia with alveolar septa and pulmonary capillaries preserved. (b) Mouse exposed to hyperoxia for 12 h with alveolar septa and pulmonary capillaries preserved, but with interstitial cellularity increased. (c) Mouse exposed to hyperoxia for 24 h with few alveolar macrophages and neutrophils. (d) Mouse exposed to hyperoxia for 48 h with alveolar macrophages and neutrophils. These images are representative of all mice analysed; N = 10 for all experiments. The arrows indicate leucocytes (alveolar macrophages or neutrophils). This test was performed in the first experiment only.
Figure 5.
Lung histology in sections immunostained for TNF-α. (a) Lung parenchyma from a control mouse exposed to normoxia with reduced TNF-α expression. (b) Lung parenchyma from a mouse exposed to hyperoxia for 12 h with reduced TNF-α expression. (c) Lung parenchyma from a mouse exposed to hyperoxia for 24 h with a high TNF-α expression level, mainly in alveolar cells. (d) Lung parenchyma from a mouse exposed to hyperoxia for 48 h, with cells expressing TNF-α. These images are representative of all mice analysed; N = 10 for all experiments. The arrows indicate leucocytes (alveolar macrophages or neutrophils) expressing TNF-α. This test was performed in the first experiment only.
Figure 6.
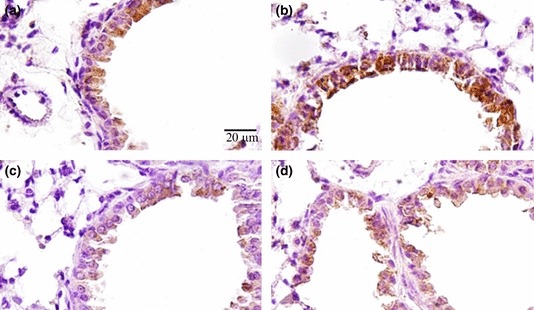
Lung histology in sections immunostained for TNF-α. (a) Bronchi from a control mouse exposed to normoxia with bronchial cells expressing TNF-α. (b) Bronchi from a mouse exposed to hyperoxia for 12 h with bronchial cells expressing TNF-α. (c) Bronchi from a mouse exposed to hyperoxia for 24 h with reduced TNF-α expression. (d) Bronchi from a mouse exposed to hyperoxia for 48 h with reduced TNF-α expression. These images are representative of all mice analysed; N = 10 for all experiments. This test was performed in the first experiment only.
Table 3.
BAL, morphometry and stereology of mouse lungs exposed to 100% oxygen for 12, 24 and 48 h
| Group | Control | 12 h | 24 h | 48 h |
|---|---|---|---|---|
| IHI (%) | 35.3 ± 2.9 | 47.7 ± 3.8 | 60.3 ± 2.3* | 59.3 ± 7.2* |
| Macrophages (×103/ml)† | 183.2 ± 7.6 | 205.8 ± 13.1 | 348.2 ± 14.4*** | 249.2 ± 14.8* |
| Neutrophils (×103/ml)† | 30.1 ± 4.4 | 57.2 ± 4.6 | 257.0 ± 5.1*** | 348.4 ± 12.2*** |
| Macrophages/mm2‡ | 197.5 ± 9.2 | 122.5 ± 11.9* | 370.0 ± 20.2*** | 180.0 ± 21.2 |
| Neutrophils/mm2‡ | 62.5 ± 3.2 | 13.7 ± 1.2*** | 111.0 ± 11.7** | 211.0 ± 23.6*** |
| Vv lung parenchyma (%) | 50.5 ± 2.9 | 49.0 ± 3.3 | 57.2 ± 1.9 | 64.7 ± 3.2* |
IHI, immunohistochemical index (AMs positive for TNF-α/total AMs) × 100; Vv, volume density; BAL, bronchoalveolar lavage.
Cell counts performed in BAL by using a Zi Coulter counter; differential cell counts were performed on cytospin preparations.
Cell counts were performed in lung tissue by using a 40× objective lens on a video microscope linked to a colour video camera and a colour video monitor. Vv was performed using a 20× objective lens as described above.
For more details, see the Materials and Methods section. Values are the means ± standard error of the mean. For macrophages and neutrophils, we used a one-way anova followed by the Student–Newman–Keuls post hoc test. For IHI and Vv, we used the Kruskal–Wallis test followed by the Dunn’s post hoc test. In all instances, significance levels were set at 5%. *P < 0.05 compared to the control group; **P < 0.01 compared to the control group; ***P < 0.001 compared to the control group. N = 10 per group.
Discussion
Here, we have demonstrated that the time course of hyperoxia-induced ALI is initiated coincident with inflammation and oxidative stress. We observed significant changes in the antioxidant system and markedly increased lipid peroxidation at 12 and 24 h of hyperoxia; however, at 48 h, all of these outcomes were normalized. This finding is unexpected because the majority of published data indicate that at high levels of hyperoxia, rodents exhibit high mortality by 72-96 h. The burden of inflammation and oxidative stress was progressive between 12 and 24 h of hyperoxic exposure, although a reduction in some parameters (e.g. SOD, MPO, GSH/GSSG ratio, MDA, nitrite, OH-proline, protein in the lung tissue, IL-6 and macrophage counts) was evident after 48 h. Interestingly, after 48 h of hyperoxia, we observed histological evidence of lung damage. Therefore, we suggest that lung tissue damage induced by hyperoxia, observed mainly at 48 h, is preceded by an inflammatory and oxidative response (observed moderately at 12 h and strongly at 24 h). The novel findings in this study are the antioxidant enzyme activities and the concomitant inflammatory response together with the oxidative response. We cannot say from the experiments conducted here whether the inflammatory or the oxidative response occurs first; however, owing to the inflammatory cell influxes in parallel with TNF-α and IL-6 detection after 24 h compared with early redox imbalance (SOD, CAT, MPO and MDA) and reduced cells (AMs and PMNs counted in the lung tissue) observed at 12 h, we suggest that the oxidative stress is present before any inflammatory cellular events.
Our study established that oxidative stress is already detectable after 12 h of hyperoxia. In these experiments, it was likely that ROS acted as inflammatory mediators and contributed to the lung damage via both lipid peroxidation and protein and DNA oxidation (Lee & Choi 2003). Reactive oxygen species accumulation was progressive within the endothelial cells of the lung capillaries during the exposure of the mice to hyperoxia (Brueckl et al. 2006). In this report, SOD and CAT activities were evaluated to understand their contributions to the redox imbalance during the time course of hyperoxia. A reduction in SOD activity results in lower levels of O2− dismutation; consequently, there is a greater amount of free O2− contributing to oxidative stress (Levy et al. 2001; Oury et al. 2002). Interestingly, there were no differences in CAT activities after 12 and 24 h in the hyperoxia group compared with the control group. A later increase in CAT activity, observed after 48 h, may be related to the influxes of PMNs because these cells express large amounts of CAT (Rister & Baehner 1977). Additionally, the increased MPO activity in the BAL fluid occurred concurrently with the high interstitial cellularity observed in the lung histology. However, the leucocytes in the alveolar interstitium were not discriminated here. Additionally, we observed a few AMs and PMNs in the BAL fluid at 12 h of hyperoxia, but this result is relevant only in the alveolar space and may represent an apoptosis mechanism of these cells during the first 12 h of hyperoxia exposure but not after. Finally, IL-6 expression and protein levels were increased after 12 and 24 h of hyperoxia, in parallel with the interstitial cellularity. The reduction in IL-6 expression and protein levels observed after 48 h of hyperoxia, with a concomitant reduction in several parameters of inflammatory and oxidative responses, could be related to lung damage processes (Powell et al. 1992). The MTT assay performed with bronchoalveolar cells highlighted a toxic effect of hyperoxia at 24 and 48 h; this result is also compatible with the lung damage observed mainly at 48 h. We did not discard cell deaths at 24 and 48 h as a direct effect of hyperoxia, but, in contrast, we counted BAL cells. MTT appears to indicate cytotoxicity rather than viability in this case.
We observed a thickening of the alveolar septa, which was already distinct at 24 and 48 h of hyperoxia. Nevertheless, after 48 h, we observed red blood cells in the alveoli; although we did not investigate the alveolar-capillary barrier, the level of total proteins in the BAL fluid increased over the same time period. We observed that the level of total proteins in the lung tissue increased at 12 and 24 h, whereas the level of total proteins in the BAL fluid decreased over the same time period of hyperoxia. However, at 48 h of hyperoxia, we observed a decrease in the level of total proteins in the lung tissue. These results confirm other reports of increased lung epithelial permeability (Bhandari 2008). Endothelial damage, alveolar oedema and haemorrhage are other hallmarks of ALI that have been reported in previous studies (Valenca Sdos et al. 2007; Bhandari 2008; Fisher & Beers 2008; Nagato et al. 2009); some of these pathologies were identified in this study in mice exposed to hyperoxia for 24 and 48 h. Interestingly, we observed a reduction in the GSH/GSSG ratio after 12 and 24 h of hyperoxia, when no histological evidence of lung damage was noted, although a high interstitial cellularity was already present. Reduced glutathione is the major cellular thiol antioxidant and redox recycler and is more concentrated in the epithelial lining fluid than in the plasma (Rahman et al. 2005). GSH has an important protective role in the alveoli and intracellularly in epithelial cells (Rahman 1999). Several studies have suggested that GSH homoeostasis may play a central role in the maintenance of the integrity of the lung airspace–epithelial barrier, an observation supported by the report that decreased levels of GSH in epithelial cells lead to the loss of the barrier function and an increased permeability (Rahman et al. 2001). In this sense, the protein content of the BAL fluid increased after 48 h of hyperoxia, in parallel with the histological evidence of ALI. Although the GSH/GSSG ratios in the hyperoxic and control groups were similar after 48 h, the mechanism of the cellular events culminating in lung tissue damage at 48 h was already detected at 12 h. Finally, the cytotoxicity caused by hyperoxia was noted at 24 and 48 h, with the BAL fluid cells from the hyperoxia-exposed mice exhibiting a 50% survival rate compared with the control cells.
We also evaluated the time course of hyperoxia relative to the oxidative damage parameters. The redox imbalance (SOD and CAT) associated with the subsequent PMN influxes occurred concomitantly with the increased levels of extracellular matrix MMP-2 and MMP-9 activities. We also observed lung immunostaining and the levels of TNF-α during the time course of hyperoxia. Surprisingly, TNF-α labelling in the bronchial epithelia was observed at a different time than TNF-α labelling in the lung parenchymas and AMs was observed. The discrepancy in the TNF-α labelling between the bronchi and lung parenchymas could be explained by the increase in the number of leucocytes in the alveolar space and the interstitium. Thus, TNF-α, acting as a pro-inflammatory cytokine, could be produced and released in the lung structures that are directly affected by the hyperoxia exposure. Moreover, we did not observe bronchial damage (Figure 6). The MDA content was already increased at 12 and 24 h after hyperoxia exposure. We suggest that inflammation, which is represented by TNF-α immunolabelling and protein levels, and oxidative stress, which is quantified using the GSH/GSSG ratio, contributed to the oxidative damage. Nevertheless, these findings are in accordance with the observation in rats that MDA levels increased gradually with the duration of exposure to 100% oxygen for 10, 30 and 90 min, concomitant with the levels of inflammatory cells (Valenca Sdos et al. 2007). Additionally, we demonstrated previously that oxidative damage is related to the oxygen concentration (50, 75 and 100%) at 90 min. Finally, the nitrite content (a product of the nitric oxide radical) was increased in the BAL fluid after 12 and 24 h of hyperoxia, as reported by another study that used nitrite as a marker of inflammation in ALI (Robbins et al. 1995).
Our study has some limitations. (i) Mice differ from humans in various aspects. Many results regarding inflammation and oxidative stress can be found in the literature, but it is unclear which are feasible to be realized in clinical practice in humans. Some analyses described here could be performed using the plasma (Smith et al. 1993; Garcia-de-la-Asuncion et al. 2011), in biopsies (Stellingwerff et al. 2005), using sputum (Takasaki & Ogawa 1999) and using samples from bronchoscopy (Mousavi et al. 2011). Future clinical studies that measure some of these parameters under the ALI + hyperoxia conditions analysed here can confirm (or refute) the findings of our manuscript and those of others, thus allowing a more effective treatment guidance. In contrast, other analyses related to inflammation and oxidative stress in experimental models of hyperoxia were not performed here such as a haeme oxygenase-1 (Siner et al. 2007), nitric oxide synthase 2 (iNOS) (Bhandari et al. 2011), NADPH oxidase (Carnesecchi et al. 2009), tumour growth factor beta (TGF-beta) (Alejandre-Alcazar et al. 2007) and NRF2 (Reddy et al. 2009). (ii) The decreases observed in most of the parameters measured in Table 1 are likely due to the changes in endothelial cell permeability and protein leakage into the lung tissues and alveolar spaces (as verified by the BAL protein contents). The fluid moving into the lung is ‘plasma-like’ in nature and affects the total protein contents of the lung tissues and the BALs. This fluid movement results in larger denominators for most of the parameters and thus smaller values at 48 h; however, this movement cannot be prevented. (iii) Western blotting and zymography were performed with only a few samples, and loading controls were not adequately provided (for western blots, we used Ponceau red staining). (iv) Although it is not exceptionally novel or mechanistic, the study of the time course–dependent endpoints in a single report increases our understanding of the complexity of hyperoxic injury.
In conclusion, oxygen is necessary and important for the treatment for illnesses associated with hypoxia. However, oxygen therapy can still be improved in terms of identifying safer exposure limits to avoid perpetuating and exacerbating ALI or becoming the cause of ALI. Although our study was performed in mice, the literature from human studies confirms our findings of the time course of hyperoxia-induced lung injury. Alterations in lung histology, such as alveolar size and thickening of the alveolar septa at 24 h, which subsequently increased by 48 h, appear to be temporary; however, these alterations are important evidence of damage after ALI. Because there are wide-ranging clinical uses for oxygen in the treatment of individuals worldwide, investigations of the time course of inflammation and oxidative stress prior to the histological evidence of ALI can help us to improve the safety of oxygen delivery to patients.
Acknowledgments
This work was supported by grants from FAPERJ and CNPq. ACN and ML received a bursary from CAPES. SSV was supported by a Visiting Professor Program from UERJ. The authors declare that they have no conflicts of interest or financial disclosures.
References
- Aebi H. Catalase in vitro. Methods Enzymol. 1984;105:121–126. doi: 10.1016/s0076-6879(84)05016-3. [DOI] [PubMed] [Google Scholar]
- Alejandre-Alcazar MA, Kwapiszewska G, Reiss I, et al. Hyperoxia modulates TGF-beta/BMP signaling in a mouse model of bronchopulmonary dysplasia. Am. J. Physiol. 2007;292:L537–L549. doi: 10.1152/ajplung.00050.2006. [DOI] [PubMed] [Google Scholar]
- Bannister JV, Calabrese L. Assays for superoxide dismutase. Methods Biochem. Anal. 1987;32:279–312. doi: 10.1002/9780470110539.ch5. [DOI] [PubMed] [Google Scholar]
- Bhandari V. Molecular mechanisms of hyperoxia-induced acute lung injury. Front. Biosci. 2008;13:6653–6661. doi: 10.2741/3179. [DOI] [PubMed] [Google Scholar]
- Bhandari V, Choo-Wing R, Lee CG, et al. Hyperoxia causes angiopoietin 2-mediated acute lung injury and necrotic cell death. Nat. Med. 2006;12:1286–1293. doi: 10.1038/nm1494. [DOI] [PMC free article] [PubMed] [Google Scholar]
- Bhandari V, Choo-Wing R, Harijith A, et al. Increased hyperoxia-induced lung injury in nitric oxide synthase 2 null mice is mediated via angiopoietin 2. Am. J. Respir. Cell Mol. Biol. 2011;182:918–928. doi: 10.1165/rcmb.2011-0074OC. [DOI] [PMC free article] [PubMed] [Google Scholar]
- Bradford MM. A rapid and sensitive method for the quantitation of microgram quantities of protein utilizing the principle of protein-dye binding. Anal. Biochem. 1976;72:248–254. doi: 10.1016/0003-2697(76)90527-3. [DOI] [PubMed] [Google Scholar]
- Brueckl C, Kaestle S, Kerem A, et al. Hyperoxia-induced reactive oxygen species formation in pulmonary capillary endothelial cells in situ. Am. J. Respir. Cell Mol. Biol. 2006;34:453–463. doi: 10.1165/rcmb.2005-0223OC. [DOI] [PubMed] [Google Scholar]
- Carnesecchi S, Deffert C, Pagano A, et al. NADPH oxidase-1 plays a crucial role in hyperoxia-induced acute lung injury in mice. Am. J. Respir. Crit. Care Med. 2009;180:972–981. doi: 10.1164/rccm.200902-0296OC. [DOI] [PMC free article] [PubMed] [Google Scholar]
- Davies P. Morphologic and morphometric techniques for the detection of drug- and toxin-induced changes in lung. Pharmacol. Ther. 1991;50:321–336. doi: 10.1016/0163-7258(91)90048-q. [DOI] [PubMed] [Google Scholar]
- Draper HH, Hadley M. Malondialdehyde determination as index of lipid peroxidation. Methods Enzymol. 1990;186:421–431. doi: 10.1016/0076-6879(90)86135-i. [DOI] [PubMed] [Google Scholar]
- Fisher AB, Beers MF. Hyperoxia and acute lung injury. Am. J. Physiol. 2008;295:L1066. doi: 10.1152/ajplung.90486.2008. author reply L1067. [DOI] [PMC free article] [PubMed] [Google Scholar]
- Garcia-de-la-Asuncion J, Barber G, Rus D, et al. Hyperoxia during colon surgery is associated with a reduction of xanthine oxidase activity and oxidative stress in colonic mucosa. Redox Rep. 2011;16:121–128. doi: 10.1179/174329211X13049558293632. [DOI] [PMC free article] [PubMed] [Google Scholar]
- Ghezzi P, Bonetto V, Fratelli M. Thiol-disulfide balance: from the concept of oxidative stress to that of redox regulation. Antioxid. Redox Signal. 2005;7:964–972. doi: 10.1089/ars.2005.7.964. [DOI] [PubMed] [Google Scholar]
- Green LC, Wagner DA, Glogowski J, Skipper PL, Wishnok JS, Tannenbaum SR. Analysis of nitrate, nitrite, and [15N]nitrate in biological fluids. Anal. Biochem. 1982;126:131–138. doi: 10.1016/0003-2697(82)90118-x. [DOI] [PubMed] [Google Scholar]
- Ho YS. Transgenic and knockout models for studying the role of lung antioxidant enzymes in defense against hyperoxia. Am. J. Respir. Crit. Care Med. 2002;166:S51–S56. doi: 10.1164/rccm.2206017. [DOI] [PubMed] [Google Scholar]
- Huang B, Fu H, Yang M, Fang F, Kuang F, Xu F. Neuropeptide substance P attenuates hyperoxia-induced oxidative stress injury in type II alveolar epithelial cells via suppressing the activation of JNK pathway. Lung. 2009;187:421–426. doi: 10.1007/s00408-009-9177-z. [DOI] [PubMed] [Google Scholar]
- Kuebler WM, Abels C, Schuerer L, Goetz AE. Measurement of neutrophil content in brain and lung tissue by a modified myeloperoxidase assay. Int. J. Microcirc. Clin. Exp. 1996;16:89–97. doi: 10.1159/000179155. [DOI] [PubMed] [Google Scholar]
- Lee PJ, Choi AM. Pathways of cell signaling in hyperoxia. Free Radical Biol. Med. 2003;35:341–350. doi: 10.1016/s0891-5849(03)00279-x. [DOI] [PubMed] [Google Scholar]
- Levy MA, Tsai YH, Reaume A, Bray TM. Cellular response of antioxidant metalloproteins in Cu/Zn SOD transgenic mice exposed to hyperoxia. Am. J. Physiol. 2001;281:L172–L182. doi: 10.1152/ajplung.2001.281.1.L172. [DOI] [PubMed] [Google Scholar]
- Menegali BT, Nesi RT, Souza PS, et al. The effects of physical exercise on the cigarette smoke-induced pulmonary oxidative response. Pulm. Pharmacol. Ther. 2009;22:567–573. doi: 10.1016/j.pupt.2009.08.003. [DOI] [PubMed] [Google Scholar]
- Mousavi S, Abdollahi M, Ahmadi A, et al. The dilemma of hyperoxia following positive pressure mechanical ventilation: role of iron and the benefit of iron chelation with deferasirox. Eur. Rev. Med. Pharmacol. Sci. 2011;15:1141–1148. [PubMed] [Google Scholar]
- Murray LA, Knight DA, McAlonan L, et al. Deleterious role of TLR3 during hyperoxia-induced acute lung injury. Am. J. Respir. Crit. Care Med. 2008;178:1227–1237. doi: 10.1164/rccm.200807-1020OC. [DOI] [PubMed] [Google Scholar]
- Nagato A, Silva FL, Silva AR, et al. Hyperoxia-induced lung injury is dose dependent in Wistar rats. Exp. Lung Res. 2009;35:713–728. doi: 10.3109/01902140902853184. [DOI] [PubMed] [Google Scholar]
- Niu R, Okamoto T, Iwase K, Nomura S, Mizutani S. Quantitative analysis of matrix metalloproteinases-2 and -9, and their tissue inhibitors-1 and -2 in human placenta throughout gestation. Life Sci. 2000;66:1127–1137. doi: 10.1016/s0024-3205(00)00416-1. [DOI] [PubMed] [Google Scholar]
- Ogawa Y, Tasaka S, Yamada W, et al. Role of Toll-like receptor 4 in hyperoxia-induced lung inflammation in mice. Inflamm. Res. 2007;56:334–338. doi: 10.1007/s00011-007-7052-z. [DOI] [PubMed] [Google Scholar]
- Oury TD, Schaefer LM, Fattman CL, Choi A, Weck KE, Watkins SC. Depletion of pulmonary EC-SOD after exposure to hyperoxia. Am. J. Physiol. 2002;283:L777–L784. doi: 10.1152/ajplung.00011.2002. [DOI] [PubMed] [Google Scholar]
- Owuor ED, Kong AN. Antioxidants and oxidants regulated signal transduction pathways. Biochem. Pharmacol. 2002;64:765–770. doi: 10.1016/s0006-2952(02)01137-1. [DOI] [PubMed] [Google Scholar]
- Papaiahgari S, Zhang Q, Kleeberger SR, Cho HY, Reddy SP. Hyperoxia stimulates an Nrf2-ARE transcriptional response via ROS-EGFR-PI3K-Akt/ERK MAP kinase signaling in pulmonary epithelial cells. Antioxid. Redox Signal. 2006;8:43–52. doi: 10.1089/ars.2006.8.43. [DOI] [PubMed] [Google Scholar]
- Powell PP, Wang CC, Jones R. Differential regulation of the genes encoding platelet-derived growth factor receptor and its ligand in rat lung during microvascular and alveolar wall remodeling in hyperoxia. Am. J. Respir. Cell Mol. Biol. 1992;7:278–285. doi: 10.1165/ajrcmb/7.3.278. [DOI] [PubMed] [Google Scholar]
- Putnam KP, Bombick DW, Doolittle DJ. Evaluation of eight in vitro assays for assessing the cytotoxicity of cigarette smoke condensate. Toxicol. In Vitro. 2002;16:599–607. doi: 10.1016/s0887-2333(02)00050-4. [DOI] [PubMed] [Google Scholar]
- Rahman I. Inflammation and the regulation of glutathione level in lung epithelial cells. Antioxid. Redox Signal. 1999;1:425–447. doi: 10.1089/ars.1999.1.4-425. [DOI] [PubMed] [Google Scholar]
- Rahman I, Mulier B, Gilmour PS, et al. Oxidant-mediated lung epithelial cell tolerance: the role of intracellular glutathione and nuclear factor-kappaB. Biochem. Pharmacol. 2001;62:787–794. doi: 10.1016/s0006-2952(01)00702-x. [DOI] [PubMed] [Google Scholar]
- Rahman I, Biswas SK, Jimenez LA, Torres M, Forman HJ. Glutathione, stress responses, and redox signaling in lung inflammation. Antioxid. Redox Signal. 2005;7:42–59. doi: 10.1089/ars.2005.7.42. [DOI] [PubMed] [Google Scholar]
- Rahman I, Kode A, Biswas SK. Assay for quantitative determination of glutathione and glutathione disulfide levels using enzymatic recycling method. Nat. Protoc. 2006;1:3159–3165. doi: 10.1038/nprot.2006.378. [DOI] [PubMed] [Google Scholar]
- Reddy NM, Kleeberger SR, Kensler TW, Yamamoto M, Hassoun PM, Reddy SP. Disruption of Nrf2 impairs the resolution of hyperoxia-induced acute lung injury and inflammation in mice. J. Immunol. 2009;182:7264–7271. doi: 10.4049/jimmunol.0804248. [DOI] [PMC free article] [PubMed] [Google Scholar]
- Rister M, Baehner RL. Effect of hyperoxia on superoxide anion and hydrogen peroxide production of polymorphonuclear leucocytes and alveolar macrophages. Br. J. Haematol. 1977;36:241–248. doi: 10.1111/j.1365-2141.1977.tb00645.x. [DOI] [PubMed] [Google Scholar]
- Robbins CG, Davis JM, Merritt TA, et al. Combined effects of nitric oxide and hyperoxia on surfactant function and pulmonary inflammation. Am. J. Physiol. 1995;269:L545–L550. doi: 10.1152/ajplung.1995.269.4.L545. [DOI] [PubMed] [Google Scholar]
- Rubenfeld GD, Herridge MS. Epidemiology and outcomes of acute lung injury. Chest. 2007;131:554–562. doi: 10.1378/chest.06-1976. [DOI] [PubMed] [Google Scholar]
- Sies H. Oxidative stress: oxidants and antioxidants. Exp. Physiol. 1997;82:291–295. doi: 10.1113/expphysiol.1997.sp004024. [DOI] [PubMed] [Google Scholar]
- Siner JM, Jiang G, Cohen ZI, et al. VEGF-induced heme oxygenase-1 confers cytoprotection from lethal hyperoxia in vivo. FASEB J. 2007;21:1422–1432. doi: 10.1096/fj.06-6661com. [DOI] [PubMed] [Google Scholar]
- Smith CV, Hansen TN, Martin NE, McMicken HW, Elliott SJ. Oxidant stress responses in premature infants during exposure to hyperoxia. Pediatr. Res. 1993;34:360–365. doi: 10.1203/00006450-199309000-00024. [DOI] [PubMed] [Google Scholar]
- Stellingwerff T, Glazier L, Watt MJ, LeBlanc PJ, Heigenhauser GJ, Spriet LL. Effects of hyperoxia on skeletal muscle carbohydrate metabolism during transient and steady-state exercise. J. Appl. Physiol. 2005;98:250–256. doi: 10.1152/japplphysiol.00897.2004. [DOI] [PubMed] [Google Scholar]
- Takasaki J, Ogawa Y. Interleukin 8 in the tracheobronchial aspirate of infants acts as a neutrophil chemotactic factor in the development of chronic lung disease. Pediatr. Int. 1999;41:78–81. doi: 10.1046/j.1442-200x.1999.01021.x. [DOI] [PubMed] [Google Scholar]
- Valenca SS, Porto LC. Immunohistochemical study of lung remodeling in mice exposed to cigarette smoke*. J. Bras. Pneumol. 2008;34:787–795. doi: 10.1590/s1806-37132008001000006. [DOI] [PubMed] [Google Scholar]
- Valenca Sdos S, Kloss ML, Bezerra FS, Lanzetti M, Silva FL, Porto LC. [Effects of hyperoxia on Wistar rat lungs] J. Bras. Pneumol. 2007;33:655–662. doi: 10.1590/s1806-37132007000600008. [DOI] [PubMed] [Google Scholar]
- Valenca SS, da Hora K, Castro P, Moraes VG, Carvalho L, Porto LC. Emphysema and metalloelastase expression in mouse lung induced by cigarette smoke. Toxicol. Pathol. 2004;32:351–356. doi: 10.1080/01926230490431466. [DOI] [PubMed] [Google Scholar]
- Whitehead GS, Burch LH, Berman KG, Piantadosi CA, Schwartz DA. Genetic basis of murine responses to hyperoxia-induced lung injury. Immunogenetics. 2006;58:793–804. doi: 10.1007/s00251-006-0147-9. [DOI] [PMC free article] [PubMed] [Google Scholar]
- Woessner JF., Jr The determination of hydroxyproline in tissue and protein samples containing small proportions of this imino acid. Arch. Biochem. Biophys. 1961;93:440–447. doi: 10.1016/0003-9861(61)90291-0. [DOI] [PubMed] [Google Scholar]