Abstract
Numerous genetic loci influence systolic blood pressure (SBP) and diastolic blood pressure (DBP) in Europeans 1-3. We now report genome-wide association studies of pulse pressure (PP) and mean arterial pressure (MAP). In discovery (N=74,064) and follow-up studies (N=48,607), we identified at genome-wide significance (P= 2.7×10⁻⁸ to P=2.3×10⁻¹³) four novel PP loci (at 4q12 near CHIC2/PDGFRAI, 7q22.3 near PIK3CG, 8q24.12 in NOV, 11q24.3 near ADAMTS-8), two novel MAP loci (3p21.31 in MAP4, 10q25.3 near ADRB1) and one locus associated with both traits (2q24.3 near FIGN) which has recently been associated with SBP in east Asians. For three of the novel PP signals, the estimated effect for SBP was opposite to that for DBP, in contrast to the majority of common SBP- and DBP-associated variants which show concordant effects on both traits. These findings indicate novel genetic mechanisms underlying blood pressure variation, including pathways that may differentially influence SBP and DBP.
High blood pressure is a major risk factor for coronary heart disease and stroke4. Large genome-wide association studies in Europeans have reported 29 novel loci for systolic and diastolic blood pressure (SBP and DBP) where alleles have effect sizes of up to 0.5-1mm Hg1-3. Even small increments in blood pressure levels have important effects on cardiovascular morbidity and mortality at the population level5. We undertook a genome-wide association study of two further blood pressure phenotypes, pulse pressure (PP, the difference between SBP and DBP), a measure of stiffness of the main arteries, and mean arterial pressure (MAP), a weighted average of SBP and DBP. Both PP and MAP are predictive of hypertension6 and cardiovascular disease7-9.
This study was undertaken by the International Consortium of Blood Pressure Genome-Wide Association Studies (ICBP-GWAS) which aims to further the understanding of the genetic architecture underlying blood pressure. The initial publication by this consortium1 studied SBP and DBP with discovery GWAS among 69,395 people and a combined sample of ~200,000 Europeans. The two blood pressure phenotypes reported here, namely PP and MAP, were not previously analysed. All but one study that was included in the discovery GWAS of the study of SBP and DBP were included in the discovery GWAS stage of this study. In addition, a further 6 studies not included in the previous study1 were included here bringing our discovery GWAS sample size to 74,064.
We first conducted a genome-wide association meta-analysis of PP and MAP in 74,064 individuals of European ancestry from 35 studies (Supplementary Table 1A). Genotypes were imputed using HapMap. To account for effects of anti-hypertensive treatments, we imputed underlying SBP and DBP by adding a constant to each2,3. Associations were adjusted for age, age2, sex and body mass index. We combined results across studies using an inverse variance weighted meta-analysis and, to correct for residual test statistic inflation, applied genomic control (GC) both to study-level association statistics and to the meta-analysis (λGC=1.08 for PP, λGC=1.12 for MAP)10. The QQ plots show an excess of extreme values largely accounted for by a modest number of genomic regions (Supplementary Figures 1 (a) – (b)). Independent follow-up analyses were performed in 48,607 individuals of European ancestry (Online Methods and Supplementary Note).
SNPs in 12 regions showed genome-wide significant association (P<5×10⁻⁸) with either PP or MAP in our discovery data (Stage 1) (Supplementary Figures 1 (c) – (d)), including two novel regions for PP (7q22.3 near PIK3CG, P=1.2×10⁻¹⁰ and 11q24.3 near ADAMTS8, P=8.5×10⁻¹¹; Table 1) and 10 regions previously associated with SBP and DBP (Supplementary Table 2A for PP, Supplementary Table 2B for MAP)1-3. For follow-up in a series of independent cohorts we selected 99 SNPs comprising those with P<1×10⁻⁵ for either PP or MAP and SNPs reported in recent large genome-wide association studies of SBP and DBP1-3 to evaluate their effects on PP and MAP (Stage 2: Online Methods, Supplementary Note).
Table 1.
Summary of Pulse Pressure (PP) and Mean Arterial Pressure (MAP) association results from Stages 1 and 2 and the combined analysis for all SNPs that showed genome-wide significant (P<5×10⁻⁸) association with PP and/or MAP on combined analysis and which had not previously been reported for Systolic (SBP) or Diastolic Blood Pressure (DBP). SBP and DBP combined Stage 1 and Stage 2 association results, based on the same sample set as for PP and MAP are also shown (full SBP and DBP results are in Supplementary Tables 2D and 2E). Genome-wide significant associations (P<5×10⁻⁸) are shown in bold.
| Locus | Coded allele & freq | Stage 1 | Stage 2 | Stage 1+ 2 | SBP Stage 1+2 | DBP Stage 1+2 | ||||||||
|---|---|---|---|---|---|---|---|---|---|---|---|---|---|---|
| N eff | Beta (Se) | P | N eff | Beta (Se) | P | N eff | Beta (Se) | P | Beta (Se) | P | Beta (Se) | P | ||
| Pulse Pressure | ||||||||||||||
| rs13002573 near FIGN chr2: 164623454 | G 0.203 | 73043 | -0.320 (0.07) | 5.43×10⁻⁶ | 43955 | -0.296 (0.089) | 8.58×10⁻⁴ | 116998 | -0.310 (0.055) | 1.76×10⁻⁸ | -0.416 (0.081) | 3.25×10⁻⁷ | -0.107 (0.052) | 4.02×20-2 |
| rs871606 near CHIC2 chr4: 54494002 | T 0.85 | 71444 | 0.428 (0.096) | 9.28×10-06 | 44082 | 0.431 (0.121) | 3.75×10⁻⁴ | 115525 | 0.429 (0.075) | 1.32×10⁻⁸ | 0.403 (0.112) | 3.04×10⁻⁴ | -0.010 (0.072) | 8.85×10⁻¹ |
| rs17477177 near PIK3CG chr7: 106199094 | T 0.717 | 72997 | -0.460 (0.071) | 1.19×10⁻¹⁰ | 39999 | -0.344 (0.094) | 2.72×10⁻⁴ | 112996 | -0.418 (0.057) | 2.27×10⁻¹³ | -0.552 (0.084) | 5.67×10⁻¹¹ | -0.081 (0.055) | 1.40×10⁻¹ |
| rs2071518 NOV (3’ UTR) chr8: 120504993 | T 0.167 | 73252 | 0.304 (0.067) | 5.72×10⁻⁶ | 45804 | 0.323 (0.086) | 1.60×10⁻⁴ | 119056 | 0.312 (0.053) | 3.66×10⁻⁹ | 0.181 (0.078) | 2.08×10⁻² | -0.145 (0.050) | 3.89×10⁻³ |
| rs11222084 near ADAMTS-8 chr11: 129778440 | T 0.375 | 67704 | 0.415 (0.064) | 8.45×10⁻¹¹ | 40391 | 0.211 (0.081) | 9.17×10⁻³ | 108095 | 0.337 (0.05) | 1.90×10⁻¹¹ | 0.263 (.074) | 4.00×10⁻⁴ | -0.101 (0.048) | 3.44×10⁻² |
| Mean Arterial Pressure | ||||||||||||||
| rs1446468 near FIGN chr2: 164671732 | T 0.534 | 69264 | -0.291 (0.061) | 1.68×10⁻⁶ | 39650 | -0.418 (0.082) | 3.80×10⁻⁷ | 108914 | -0.336 (0.049) | 6.46×10⁻¹² | -0.499 (0.071) | 1.82×10⁻¹² | -0.265 (0.046) | 6.88×10⁻⁹ |
| rs319690 MAP4 (intron) chr3: 47902488 | T 0.51 | 59137 | 0.306 (0.066) | 3.88×10⁻⁶ | 34359 | 0.280 (0.09) | 1.89×10⁻³ | 93496 | 0.297 (0.053) | 2.69×10⁻⁸ | 0.423 (0.077) | 4.74×10⁻⁸ | 0.282 (0.05) | 1.84×10⁻⁸ |
| rs2782980 near ADRB1 chr10: 115771517 | T 0.198 | 61284 | -0.345 (0.071) | 1.14×10⁻⁶ | 37788 | -0.326 (0.094) | 5.55×10⁻⁴ | 99072 | -0.338 (0.057) | 2.46×10⁻⁹ | -0.406 (0.082) | 7.66×10⁻⁷ | -0.283 (0.053) | 9.60×10⁻⁸ |
After meta-analysis of the Stage 1 and Stage 2 data (Supplementary Table 2C), the two novel regions showing genome-wide association with PP after Stage 1 (near PIK3CG and near ADAMTS8) remained genome-wide significant. In addition, we found genome-wide significant associations for SNPs at two further novel loci for PP (at 4q12 near CHIC2/PDGFRA and 8q24.12 in NOV), two novel loci for MAP (3p21.31 in MAP4, 10q25.3 near ADRB1), and one locus for both traits (2q24.3 near FIGN) (Table 1 and Figure 1) which has not previously shown an association with SBP or DBP in Europeans but which has recently been associated with SBP in east Asians (see Supplementary Note)11. Forest plots of the Stage 1 effect sizes and standard errors are shown in Supplementary Figure 2. The novel signals for MAP were strongly associated with both SBP and DBP (P=7.7×10⁻⁷ to P=1.8×10⁻¹²), reflecting the high inter-correlations among these three blood pressure traits12,13. For the sentinel SNPs in three of the novel PP loci, the estimated effects on SBP were in the opposite direction to the effects on DBP (Table 1, Figure 2, Supplementary Tables 2D and 2E). Our findings show that analyses of PP and MAP reveal loci influencing blood pressure phenotypes which may not be detectable by studying SBP and DBP separately. Identification of novel genetic associations could help inform understanding about possible distinct mechanisms underlying relationships of PP with vascular risk14,15.
Figure 1.
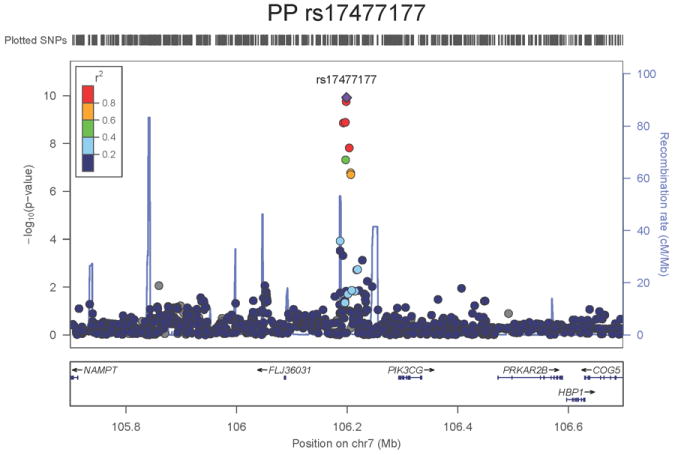
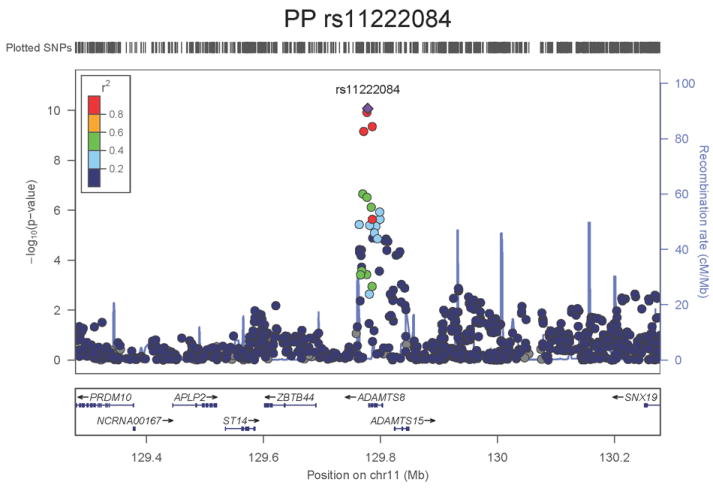
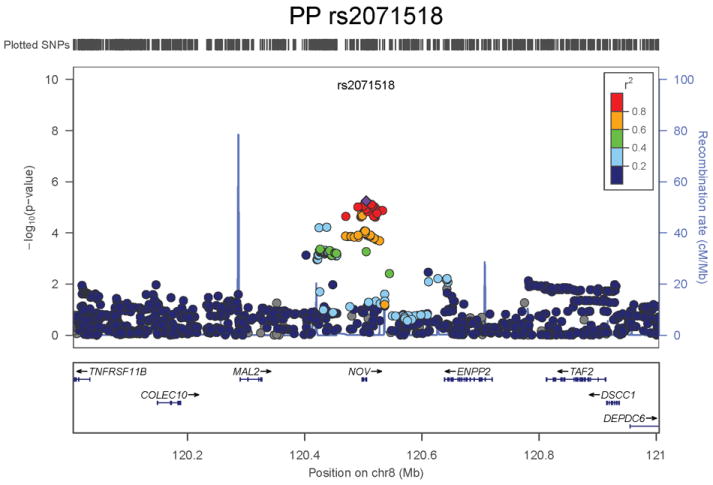
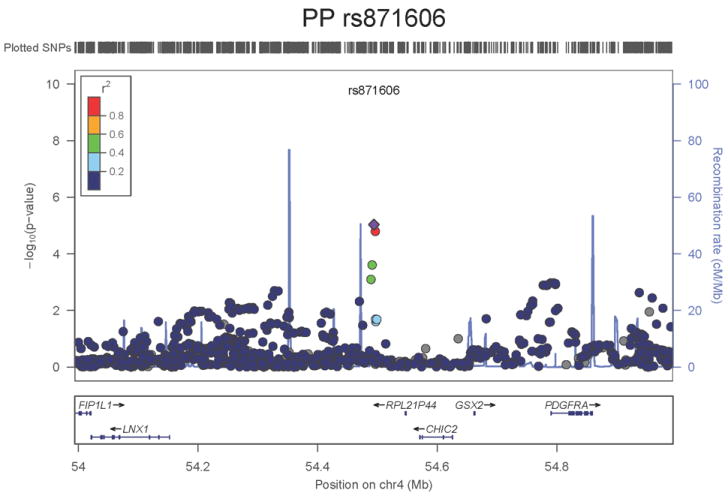
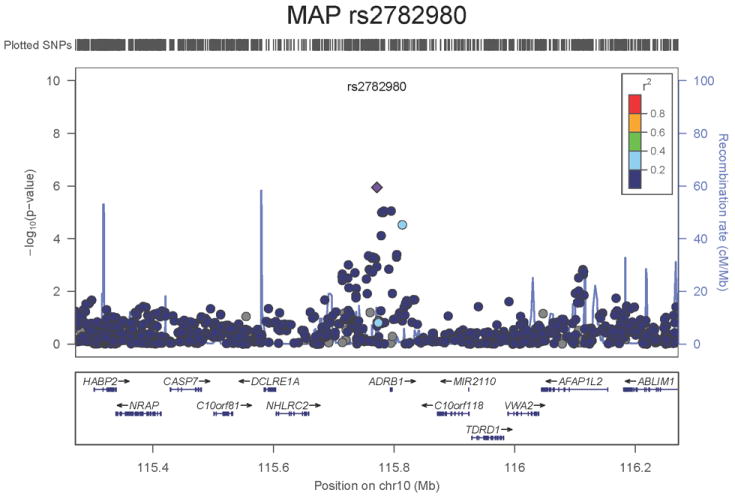
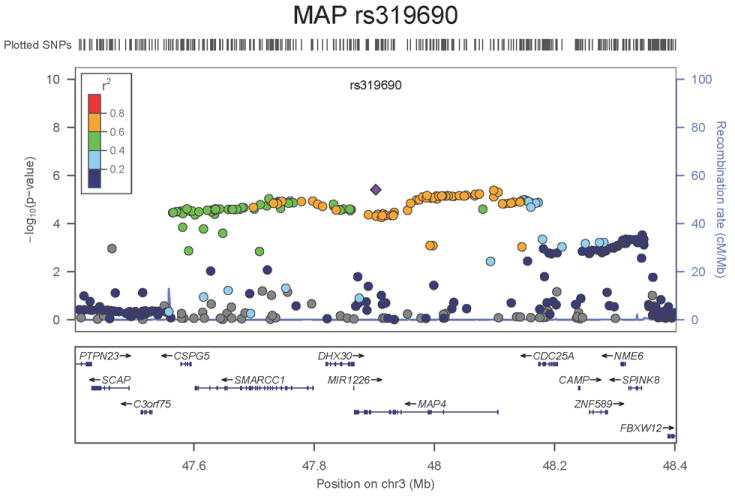
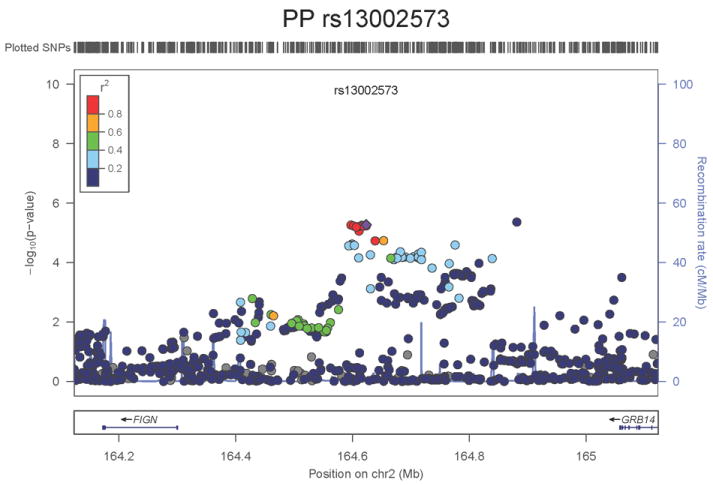
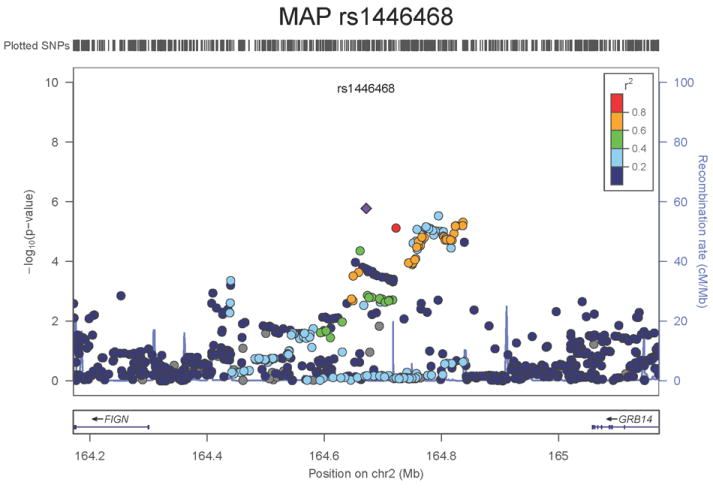
Regional association plots of the 8 SNPs at 7 loci showing genome-wide significant association (P<5×10⁻⁸) with pulse pressure and/or mean arterial pressure. Statistical significance of each SNP shown on the –log10 scale as a function of chromosome position (NCBI build 36) in the meta-analysis of stage 1 only. The sentinel SNP at each locus is shown in blue; the correlations (r2) of each of the surrounding SNPs to the sentinel SNP are shown in the colours indicated in the key. Fine –scale recombination rate is shown in blue. Gene positions are indicated at the bottom.
Figure 2.
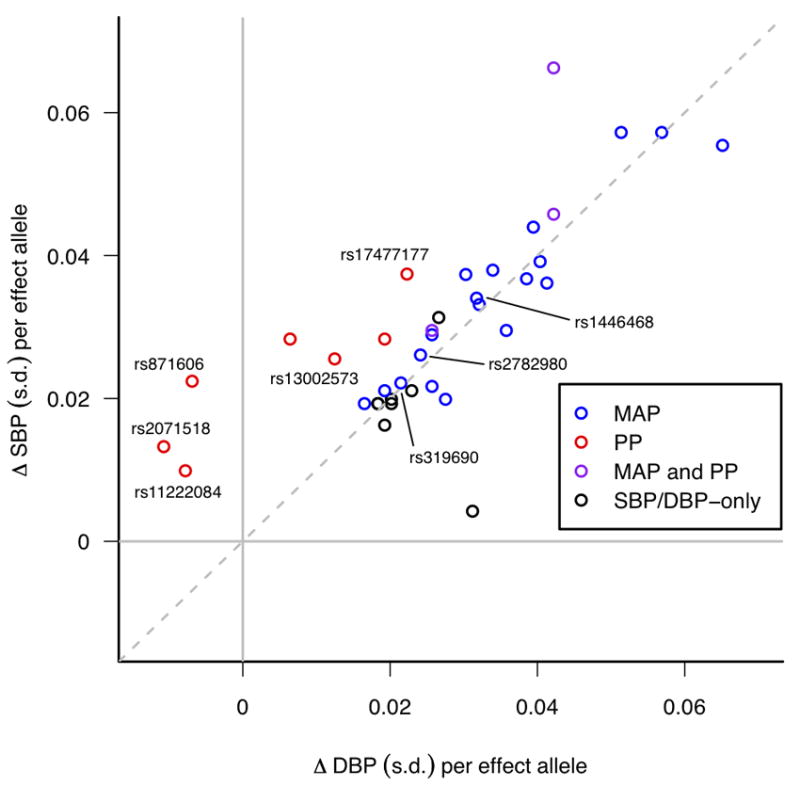
Systolic Blood Pressure (SBP) and Diastolic Blood Pressure (DBP) effect sizes (beta coefficients) for all BP SNPs identified in the present study and Ehret et al.1, obtained from follow-up samples only. Beta coefficients are shown as standard deviation (s.d.) differences so that SBP and DBP are measured on comparable scales. Points are colour-coded according to whether they are genome-wide significant (P<5×10⁻⁸) for Pulse Pressure (PP) (red), Mean Arterial Pressure (MAP) (blue) or both PP and MAP (purple) in stages 1 and 2 of the present study, while those that are significant only for SBP and/or DBP from Ehret et al.1 are shown in black. The novel SNPs found in the present study are labelled with their rs-numbers. For illustration purposes the effect allele for each SNP is defined such that the direction of the SBP effect is always positive.
Five additional loci for PP and 19 loci for MAP reaching genome-wide significance (P<5×10⁻⁸, Stage 1 and Stage 2 combined) were recently shown to be associated with SBP/DBP1-3 (Supplementary Tables 2A and 2B). We used sentinel SNPs from both the novel and known regions showing genome-wide significant associations with PP or MAP in the combined Stage 1 and 2 data to create weighted risk scores for: i) PP (10 independent SNPs) and; ii) MAP (22 SNPs) (Supplementary Table 2F). We studied the associations of both risk scores with hypertension and blood pressure related outcomes including coronary heart disease, heart failure, stroke, echocardiographic measures of left ventricular structure, pulse wave velocity, renal function and renal failure. Adjusting for multiple testing for the 12 traits evaluated (P=0.05/12=4.1×10-3), the PP SNP risk score was associated with prevalent hypertension (P=7.9×10⁻⁶), incident stroke (P=4.9×10⁻⁴) and coronary heart disease (P=4.3×10⁻⁴), and the MAP SNP risk score was associated with hypertension (P=5.1×10⁻¹⁶), coronary heart disease (P=4.0 ×10⁻²⁰), stroke (P=0.0019) and left ventricular wall thickness (P=2.1×10⁻⁴) (Supplementary Table 3A), confirming the clinical relevance of these measures of blood pressure phenotype8,9. For a range of blood pressure related outcomes (see Supplementary Note), we compared P values for the PP risk score and a series of 1000 permutations of SBP risk scores, each based on 10 of the 26 blood pressure SNPs associated with SBP but not PP, constraining the selection of SNPs to have similar sized effects for SBP as those of the 10 PP SNPs. The PP risk score had a significantly (P<0.05) greater association with risk of ischemic stroke than the SBP risk score (Supplementary Note and Supplementary Table 3B).
None of the genes in the identified novel regions is a strong candidate for blood pressure regulation, although several are implicated in mechanisms that may influence blood pressure. The most significant association with PP is within a putative mRNA clone (AF086203) spanning ~13.7kb at 7q22.3, 94kb upstream of PIK3CG (rs17477177, P=2.3×10⁻¹³, Table 1 and Figure 1a). PIK3CG encodes the phosphoinositide-3-kinase, catalytic, gamma polypeptide protein which phosphorylates phosphoinositides and modulates extracellular signals. This region was earlier associated with mean platelet volume, platelet count, and platelet aggregation16-18, but the sentinel SNPs reported in those studies are independent of SNP rs17477177 reported here (r2<0.01). Mice lacking the catalytic subunit of PI3Kγ have shown resistance to SBP-lowering effects of beta-adrenergic receptor agonists19; PI3Kγ activity is increased in the failing human heart and associated with down-regulation of beta-adrenergic receptors in the plasma membrane20. The second locus for PP located at 11q24.3 spans 35.5kb with the top-ranking SNP (rs11222084, P=1.9×10⁻¹¹, Figure 1b) lying 1.6kb downstream of ADAMTS-8. This gene is highly expressed in macrophage-rich areas of human atherosclerotic plaques and may affect extracellular matrix remodeling21. The third locus for PP spans 28.5kb at 8q24.12 with the sentinel SNP (rs2071518, P=3.7×10⁻⁹, Figure 1c) located in the 3’UTR of NOV which encodes the nephroblastoma overexpressed (CCN3) protein, associated with angiogenesis, proliferation, and inhibition of vascular smooth muscle cell growth and migration22, and with reduced neointimal thickening in mice null for CCN323. Mice with mutations in NOV that truncate the NOV protein exhibit abnormal cardiac development24. Of the genes evaluated for expression in human aortic samples at the novel PP loci, NOV showed by far the highest expression levels (Supplementary Note and Supplementary Figure 3). The fourth locus for PP is 4q12 with the top-ranking SNP (rs871606, P=1.3×10⁻⁸, Figure 1d) located 76.7kb downstream of CHIC2 which encodes a cysteine-rich hydrophobic domain containing protein associated with acute myeloid leukaemia25. This SNP is located 296kb upstream of PDGFRA which encodes platelet-derived growth factor receptor alpha, a cell surface receptor for members of the platelet-derived growth factor family involved in kidney development. Variants in PDGFRA have been associated with red blood cell count and other haematological indices26 but are independent (r2<0.3) of rs871606.
For MAP we identified two novel loci. The first locus for MAP is at 10q25.3, 22.3kb upstream of ADRB1 (rs2782980, P=2.5×10⁻⁹, Figure 1e). ADRB1 encodes the beta-1-adrenergic receptor, which mediates the effects of the stimulatory G protein and cAMP/protein kinase A pathway to increase heart rate and myocardial contraction. Polymorphisms in this gene have been associated with resting heart rate, response to beta-blockers27, and hypertension28. ADRB1 knockout mice have no difference in heart rate or blood pressure compared with the wild type but do exhibit a significant reduction in the response of both phenotypes to catecholamines29. SNP rs2782980 is associated with expression of an ADRB1 transcript in brain tissue (Supplementary Note and Supplementary Figure 4A). The second locus for MAP spans over 300kb at 3p21.31 with the top-ranking SNP (rs319690, P=2.7×10⁻⁸, Figure 1f) lying within an intron of the microtubule associated protein 4 gene, MAP4. Coating of microtubules by MAP4 may inhibit beta adrenergic receptor recycling and number, as seen in cardiac hypertrophy and failure30. MAP4 was detectably expressed in human aortic samples (Supplementary Note and Supplementary Figure 3).
The locus associated both with PP (SNP rs13002573, P=1.8×10⁻⁸, Figure 1g) and MAP (rs1446468, P= 6.5×10⁻¹², Figure 1h) is in an intergenic region spanning ~280kb at 2q24.3. Although the two signals are ~50kb apart and statistically independent (r2=0.075), rs13002573 is highly correlated (r2=1 in HapMap CEU population, r2=0.87 in HapMap JPT+CHB) with rs16849225 which has recently been reported as showing association with SBP in a GWAS of 19,608 subjects of east Asian origin with follow-up in a further 30,765 individuals (combined result: P=3.5×10⁻¹¹) 11 (see Supplementary Note). In our combined dataset in 116,998 Europeans, the association P value for rs13002573 with SBP was P=3.25×10⁻⁷. The top PP SNP lies ~320kb upstream of FIGN and ~430kb downstream of GRB14 (growth factor receptor-bound protein 14). Relatively little is known regarding FIGN (fidgetin).
We report six novel loci associated with PP and MAP based on genome-wide discovery and follow-up in over ~120,000 individuals, and a further locus (near FIGN) not previously reported in Europeans. Our results expand knowledge of the genetic architecture of blood pressure and PP regulation and may give clues as to possible novel targets for blood pressure therapies.
Online Methods
Pulse pressure was defined as systolic minus diastolic pressure and MAP as 2/3 diastolic plus 1/3 systolic pressure. A two-staged analysis was used to discover genes associated with PP and MAP.
Stage 1 samples and analyses
Stage 1 was a meta-analysis of directly genotyped and imputed SNPs from population-based or control samples from case-control studies, in the International Consortium of Blood Pressure Genome-wide Association Studies (ICBP-GWAS). The characteristics of the 35 studies, including demographics, genotyping arrays, quality control filters and statistical analysis methods used are listed in Supplementary Tables 1A and 1B. Imputation of allele dosage of ungenotyped SNPs in HapMap CEU v21a or v22 was carried out by each of the studies using MACH31, IMPUTE32 or BIMBAM33 with parameters and pre-imputation filters as specified in Supplementary Table 1B. SNPs were excluded from analysis if the study-specific imputation quality (r2.hat in MACH or .info in IMPUTE) was <0.3. In total, up to 2652054 genotyped or imputed autosomal SNPs were analyzed. Full details of the models, methods, and corrections for antihypertensive treatment are provided in the Supplementary methods. All analyses assumed an additive genetic model and were adjusted for sex, age, age2, body mass index and ancestry principal components. In related individuals, regression methods that account for relatedness were applied. All study-specific effect estimates and coded alleles were oriented to the forward strand of the HapMap release 22 with the alphabetically higher allele as the coded allele. To capture loss of power due to imperfect imputation, we estimated “N effective” as the sum of the study-specific products of the imputation quality metric and the sample size. No filtering on minor allele frequency was done. Genomic control was carried out on study-level data and inverse variance weighting was used for meta-analysis of Stage 1. The meta-analysis results were subject to genomic control. Lambda estimates are given in Supplementary Table 1A.
Selection of SNPs for Stage 2
We aimed in Stage 2 to follow up SNPs which had evidence of association with PP or MAP and, for completeness, to evaluate the effects on PP and MAP of SNPs reported in recent large genome-wide association studies of SBP and DBP1-3. All SNPs with P<1×10⁻⁵ for association with either PP or MAP (or both) were divided into independent regions based on LD and the most significant SNP was selected from each region. Within the FIGN region, different SNPs were associated with PP and with MAP and both SNPs were followed up in Stage 2. For SNPs with an N effective <75% of total N, a proxy was also included if it had P <1×10⁻⁵ and an r2>0.6 with the top SNP (this occurred for one SNP). For all regions that had previously shown association with SBP or DBP1-3, the sentinel SNP for PP and MAP and the previously reported SNP for SBP and DBP were followed up. In all, 99 SNPs were followed up in Stage 2 (Supplementary Note), comprising: 44 SNPs from 22 loci with PP or MAP associations (P<1×10⁻⁵) in Stage 1 data and with previously reported SBP or DBP associations; 47 SNPs from 45 loci with PP or MAP associations (P<1×10⁻⁵) in Stage 1 data only and; 8 SNPs from 7 loci with previously reported SBP or DBP associations and no association (P<1×10⁻⁵) with PP or MAP in the Stage 1 data.
Stage 2
The characteristics of the Stage 2 studies, including the genotyping and imputation approaches, are described in Supplementary Tables 1A and 1B and the details of corrections for treatment described in the Supplementary Note. For the 99 SNPs selected for follow-up, the Stage 2 studies followed the analysis approach adopted in the Stage 1 analyses. Meta-analysis was done using the inverse variance weights method.
Pooled analysis of first and second stage samples
Meta-analysis from stages 1 and 2 was conducted using inverse variance weighting and genomic control applied. A threshold of 5×10⁻⁸ was taken for genome-wide significance.
Calculation of risk scores
We calculated risk scores based on the most significantly associated SNP from all regions which were genome-wide significant after meta-analysis of Stages 1 and 2 for i) PP (10 SNPs) and ii) MAP (22 SNPs) (Supplementary Table 2F). Each risk score was constructed using an approach described in the Supplementary Note and was tested for association with hypertension, coronary artery disease, stroke, hypertension, chronic kidney disease, heart failure, microalbuminuria, and with continuous traits left ventricular mass, left ventricular wall thickness, pulse wave velocity, serum creatinine, eGFR and urinary albumin:creatinine ratio (Supplementary Table 3).
Additional analyses
Identification of potentially functional SNPs in LD with the reported sentinel SNPs, eQTL analyses and expression analyses in human aortic samples were also carried out as discussed in the Supplementary Note and Supplementary Figures 3 and 4.
Supplementary Material
Acknowledgments
A number of the participating studies and authors are members of the CHARGE and Global BPgen consortia. Many funding mechanisms by NIH/NHLBI, European, and private funding agencies contributed to this work and a full list is provided in the Supplementary Note.
Contributions
ICBP-GWAS PP/MAP Working and Writing Sub-Group (alphabetical order) M.J.C., P.E. (co-chair), T.J., P.B.M., P.F.O’R., M.D.T. (co-chair), C.M.V. (co-chair), G.C.V., L.V.W. ICBP-GWAS Steering Committee (alphabetical order) G.R.A., M.Bochud, M.Boehnke, MJ.C. (co-chair), A.C., G.B.E., P.E., T.B.H., M-R.J, A.D.J., T.J., M.G.L., L.L., D.L. (co-chair), P.B.M.(co-chair), C.N-C. (co-chair), B.M.P., K.M.R., A.V.S., M.D.T., C.M.V, G.C. V. Analysis L.V.W., G.C.V., P.F.O’R., T.J. Expression analyses V.E., P.H., A.D.J., D.L., J.H.L., C.P.N, A.Plump, P.A.C ’t H., K.W.V. Cohort contributions (alphabetical order): Study concept/design: AGES: T.A., V.G., T.B.H., L.L., A.V.S., AortaGen Consortium: G.F.M., ARIC: E.B., A.C., S.K.G., ASPS: H.Schmidt, R.S., BLSA: L.F., B58C-T1DGC: D.P.S., B58C-WTCCC: D.P.S., BHS: L.J.P., CardioGram Consortium: N.J.S., C4D Consortium: R.Clarke, R.Collins, CHS: J.C.B., N.L.G., B.M.P., K.M.R., K.D.T., CHARGE Consortium Heart Failure Working Group: N.L.S., CoLaus: V.M., P.Vollenweider, G.Waeber, CROATIA-Korcula: C.H., CROATIA-Split: M.Boban, I.R., CROATIA-Vis: A.F.W., DeCode Genetics: H.H., K.S., G.T., U.T., DGI controls: D.A., L.G., C.N-C., ENGAGE: J.E., I.R.K., EGCUT: H.A., A.M., EPIC: K-T.K., ERF: B.A.O., Fenland: N.J.W., FUSION: M.Boehnke, F.S.C., R.N.B., J.T., INGI CARL: A.P.d’A., P.Gasparini, INGI-FVG: A.P.d’A., P.Gasparini, INCHIANTI: S.Bandinelli., Y.M., KORA S3: C.G., M.Laan, E.O., KORA F4: T.M, H-E.W., LifeLines: R.P.S., M.M.V., LOLIPOP: J.C.C., P.E., J.S.K., LBC1921/LBC1936: I.J.D., J.M.S., MICROS: A.Pfeufer, MESA: X.G., W.P., MIGen controls: O.M., C.J.O., V.S., D.Siscovick, NESDA: B.W.P., H.Snieder, NEURO-CHARGE Consortium: M.Breteler M.Fornage, NFBC1966: M-R.J, P.Z, NSPHS: U.B.G., S.E.H., NTR: D.I.B., E. J.C. deG., ORCADES: H.C., J.F.W., PROCARDIS controls: M.Farrall, A.Hamsten, J.F.P., H.W., PROSPER/PHASE: B.B., J.W.J., D.Stott, RSI/RSII/RSIII: A.Hofman, C. M.V., J.C.M.W., SardiNIA: G.A., M.U., SHIP: M.D., H.K.K., R.R., U.V., H.V., SUVIMAX: P.Gilan, S.Hercberg, P.M., TwinsUK: T.D.S., WGHS: P.M.R., YFS: M.K., T.L., O.T.R., J.V. Phenotype data acquisition/QC: AGES: T.A., V.G., T.B.H., L.L., ARIC: A.C., S.K.G., A.C.M, D.C.R., ASPS: M.Loitfelder, R.S., BLSA: S.N., B58C-T1DGC: D.P.S., B58C-WTCCC: D.P.S., BHS: J.P.B., J.H., C4D Consortium: R.Clarke, R.Collins, J.C.H., CHS: B.M.P., CoLaus: M.Bochud, V.M., P.Vollenweider, CROATIA-Korcula: C.H., O.P., CROATIA-Split: M.Boban, I.R., DGI controls: L.G., C.N-C., EGCUT: H.A., A.K., A.M., M-L.T., EPIC: N.J.W., Fenland: N.J.W., FHS: S.-J.H., M.G.L., D.L., R.S.V., T.J.W., FUSION: J.T., INGI CARL: A.F., F.F., P.Gasparini, S.U., INGI FVG: A.F., F.F., P.Gasparini, S.U., INGI-Val Borbera: C.Masciullo, C.S., D.T., INCHIANTI: A.M.C., KORA S3: C.G., KORA F4: A.D., LifeLines: M.M.V., LOLIPOP: J.C.C., J.S.K., J.S., LBC1921/LBC1936: I.J.D., L.M.L., J.M.S., MICROS: M.Facheris, A.Pfeufer, MESA: X.G., W.P., MIGen controls: G.L., O.M., C.J.O., V.S., D.Siscovick, NESDA: : X.Lu, I.M.N., B.W.P., H.Snieder, NEURO-CHARGE Consortium: M.Breteler, S.D., A.L.D., M.Fornage, NFBC1966: P.E., M-R.J., J.Laitinen, A.Pouta, P.Z., NSPHS: J.A.C., U.B.G., S.E.H., P.J.T., NTR: D.I.B., E.J.C.deG., G.Willemsen, ORCADES: S.H.W., J.F.W., PROCARDIS controls: J.F.P., PROSPER/PHASE: D.Stott, S.T., RSI/RSII/RSIII: F.U.S.M.R., E.J.G.S., C.M.V., G.C.V., J.C.M.W., SardiNIA: M.O., M.U., SHIP: M.D., R.R., H.V., SUVIMAX: P.Gilan, M.Lathrop, TwinsUK: T.D.S., WGHS: D.I.C., A.N.P., YFS: M.K., T.L., O.T.R., J.V. Genotype data acquisition/QC: AGES: A.V.S., ARIC: A.C., G.B.E., S.K.G., A.C.M., D.C.R, G.S., ASPS: P.Gider, H. Schmidt, M.Z., BLSA: D.Hernandez, B58C-T1DGC: S.Heath, W.L.McA., B58C-WTCCC: W.L.McA., BHS: J.P.B., R.J.W., C4D Consortium: J.C.H., H.O., CHS: J.C.B., N.L.G., K.D.T., CoLaus: V.M., P.Vollenweider, CROATIA-Korcula: C.H., O.P., CROATIA-Split: I.R., CROATIA-Vis: V.V., DGI controls: D.A., B.F.V., EGCUT: T.E., T.H., EPIC: N.J.W., Fenland: R.J.F.L., J.Luan, N.J.W., FHS: S.-J.H., M.G.L., FUSION: F.S.C., INGI CARL: A.P.d’A., INGI FVG: A.P.d’A., INGI Val Borbera: C.Masciullo, C.S., D.T., INCHIANTI: A.S., KORA S3: C.G., M.Laan, E.O., KORA F4: T.M, H-E.W., LifeLines: B.Z.A., LOLIPOP: J.C.C., J.S.K., J.S., W.Z., LBC1921/LBC1936: G.D., I.J.D., MICROS: I.P., MESA: X.G., MIGen controls: G.L., O.M., C.J.O., V.S., D.S., NESDA: J.F., X.Lu, I.M.N., B.W.P., H.Snieder, NFBC1966: P.E., M-R.J., J.Laitinen, P.Z., NSPHS: J.P., P.J.T., NTR: D.I.B., E.J.C.deG., J-J.H., G.Willemsen, ORCADES: H.C., J.F.W., PROCARDIS controls: A.G., J.F.P., PROSPER/PHASE: S.T., RSI/RSII/RSIII: F.R., A.G.U., SardiNIA: G.A., SHIP: H.K.K., U.V., H.V., SUVIMAX: S.Heath, M.Lathrop, TwinsUK: M.M., S-Y.S, N.S., F.Z., WGHS: P.M.R., YFS: T.L., O.T.R. Data analysis: AGES: T.A., A.V.S, ARIC: A.C., G.B.E., A.C.M., V.P., D.C.R, G.S., ASPS: P.Gider, H. Schmidt, M.Z., BLSA: T.T. B58C-T1DGC: D.P.S., B58C-WTCCC: D.Hadley, D.P.S., BHS: W.A.M., L.J.P., R.J.W., C4D Consortium: J.C.H., H.O., CHS: J.C.B., N.L.G., K.M.R., CoLaus: S.Bergmann, M.Bochud, T.J., CROATIA-Korcula: C.H., O.P., CROATIA-Split: C.H., CROATIA-Vis: V.V., DGI controls: P.A., C.N-C., B.F.V., EchoGen Consortium: J.F.F., EGCUT: T.E., T.H., ENGAGE: M.P., EPIC: I.B., R.J.F.L., N.J.W., J.H.Z., ERF: A.C.J.W.J., Y.A., Fenland: R.J.F.L, J.Luan., FHS: S.-J.H., M.G.L., FUSION: A.U.J., INGI CARL: N.P., INGI FVG: N.P., INGI Val Borbera: T.C., G.P., C.S., D.T., KORA S3: S.E., S.S., KORA F4: B.K., LifeLines: B.Z.A., LOLIPOP: J.C.C., J.S.K., X.Li, J.S., W.Z., LBC1921/LBC1936: L.M.L., MICROS: F.D-G.M., MESA: X.G., W.P., MIGen controls: G.L., NESDA: J.F., X.Lu., NEURO-CHARGE Consortium: S.D., A.L.D, M.Fornage, NFBC1966: P.F.O’R., NSPHS: J.A.C., W.I., NTR: J-J.H., ORCADES: P.N., S.H.W., J.F.W., PROCARDIS controls: M.Farrall, A.G., J.F.P., PROSPER/PHASE: J.W.J., S.T., RSI/RSII/RSIII: N.A., S.K., C.M.V., G.C.V., SardiNIA: J.L.B-G., SHIP: U.V., SUVIMAX: T.J., P.M., TwinsUK: N.S., F.Z., WGHS: D.I.C., L.M.R., YFS: T.L., O.T.R.
Footnotes
Competing Financial Interests
A.C. is managed by Johns Hopkins Medicine. I.B. and spouse own stock in Incyte Ltd and GlaxoSmithKline. A.N.P is an employee of Amgen. G.F.M. is owner of Cardiovascular Engineering, Inc, a company that designs and manufactures devices that measure vascular stiffness. The company uses these devices in clinical studies that evaluate the effects of diseases and interventions on vascular stiffness. V.M. is an employee of GlaxoSmithKline plc. A.Plump is an employee of Merck and Co, Inc.
References
- 1.Ehret G, et al. Genetic Variants in Novel Pathways Influence Blood Pressure and Cardiovascular Disease Risk. Nature. 2011 doi: 10.1038/nature10405. [DOI] [PMC free article] [PubMed] [Google Scholar]
- 2.Levy D, et al. Genome-wide association study of blood pressure and hypertension. Nat Genet. 2009;41:677–87. doi: 10.1038/ng.384. [DOI] [PMC free article] [PubMed] [Google Scholar]
- 3.Newton-Cheh C, et al. Genome-wide association study identifies eight loci associated with blood pressure. Nat Genet. 2009;41:666–76. doi: 10.1038/ng.361. [DOI] [PMC free article] [PubMed] [Google Scholar]
- 4.Lawes CM, et al. Blood pressure and the global burden of disease 2000. Part II: estimates of attributable burden. J Hypertens. 2006;24:423–30. doi: 10.1097/01.hjh.0000209973.67746.f0. [DOI] [PubMed] [Google Scholar]
- 5.Rose G. Strategies of prevention: the individual and the population. In: Marmot M, E P, editors. Coronary heart disease epidemiology: From aetiology to Public health. Oxford University Press; Oxford: 2005. pp. 631–41. [Google Scholar]
- 6.Domanski MJ, et al. Independent prognostic information provided by sphygmomanometrically determined pulse pressure and mean arterial pressure in patients with left ventricular dysfunction. J Am Coll Cardiol. 1999;33:951–8. doi: 10.1016/s0735-1097(98)00679-2. [DOI] [PubMed] [Google Scholar]
- 7.Domanski M, et al. Pulse pressure and cardiovascular disease-related mortality: follow-up study of the Multiple Risk Factor Intervention Trial (MRFIT) Jama. 2002;287:2677–83. doi: 10.1001/jama.287.20.2677. [DOI] [PubMed] [Google Scholar]
- 8.Franklin SS, et al. Single versus combined blood pressure components and risk for cardiovascular disease: the Framingham Heart Study. Circulation. 2009;119:243–50. doi: 10.1161/CIRCULATIONAHA.108.797936. [DOI] [PMC free article] [PubMed] [Google Scholar]
- 9.Lewington S, Clarke R, Qizilbash N, Peto R, Collins R. Age-specific relevance of usual blood pressure to vascular mortality: a meta-analysis of individual data for one million adults in 61 prospective studies. Lancet. 2002;360:1903–13. doi: 10.1016/s0140-6736(02)11911-8. [DOI] [PubMed] [Google Scholar]
- 10.Devlin B, Roeder K. Genomic control for association studies. Biometrics. 1999;55:997–1004. doi: 10.1111/j.0006-341x.1999.00997.x. [DOI] [PubMed] [Google Scholar]
- 11.Kato N, et al. Meta-analysis of genome-wide association studies identifies common variants associated with blood pressure variation in east Asians. Nat Genet. 2011 May 15; doi: 10.1038/ng.834. published online. [DOI] [PMC free article] [PubMed] [Google Scholar]
- 12.Sesso HD, et al. Systolic and diastolic blood pressure, pulse pressure, and mean arterial pressure as predictors of cardiovascular disease risk in Men. Hypertension. 2000;36:801–7. doi: 10.1161/01.hyp.36.5.801. [DOI] [PubMed] [Google Scholar]
- 13.Darne B, Girerd X, Safar M, Cambien F, Guize L. Pulsatile versus steady component of blood pressure: a cross-sectional analysis and a prospective analysis on cardiovascular mortality. Hypertension. 1989;13:392–400. doi: 10.1161/01.hyp.13.4.392. [DOI] [PubMed] [Google Scholar]
- 14.Blacher J, Safar ME. Large-artery stiffness, hypertension and cardiovascular risk in older patients. Nat Clin Pract Cardiovasc Med. 2005;2:450–5. doi: 10.1038/ncpcardio0307. [DOI] [PubMed] [Google Scholar]
- 15.Dart AM, Kingwell BA. Pulse pressure--a review of mechanisms and clinical relevance. J Am Coll Cardiol. 2001;37:975–84. doi: 10.1016/s0735-1097(01)01108-1. [DOI] [PubMed] [Google Scholar]
- 16.Johnson AD, et al. Genome-wide meta-analyses identifies seven loci associated with platelet aggregation in response to agonists. Nat Genet. 2010;42:608–13. doi: 10.1038/ng.604. [DOI] [PMC free article] [PubMed] [Google Scholar]
- 17.Soranzo N, et al. A novel variant on chromosome 7q22.3 associated with mean platelet volume, counts, and function. Blood. 2009;113:3831–7. doi: 10.1182/blood-2008-10-184234. [DOI] [PMC free article] [PubMed] [Google Scholar]
- 18.Soranzo N, et al. A genome-wide meta-analysis identifies 22 loci associated with eight hematological parameters in the HaemGen consortium. Nat Genet. 2009;41:1182–90. doi: 10.1038/ng.467. [DOI] [PMC free article] [PubMed] [Google Scholar]
- 19.Oudit GY, et al. Phosphoinositide 3-kinase gamma-deficient mice are protected from isoproterenol-induced heart failure. Circulation. 2003;108:2147–52. doi: 10.1161/01.CIR.0000091403.62293.2B. [DOI] [PubMed] [Google Scholar]
- 20.Perrino C, et al. Dynamic regulation of phosphoinositide 3-kinase-gamma activity and beta-adrenergic receptor trafficking in end-stage human heart failure. Circulation. 2007;116:2571–9. doi: 10.1161/CIRCULATIONAHA.107.706515. [DOI] [PubMed] [Google Scholar]
- 21.Wagsater D, et al. ADAMTS-4 and -8 are inflammatory regulated enzymes expressed in macrophage-rich areas of human atherosclerotic plaques. Atherosclerosis. 2008;196:514–22. doi: 10.1016/j.atherosclerosis.2007.05.018. [DOI] [PubMed] [Google Scholar]
- 22.Ellis PD, Chen Q, Barker PJ, Metcalfe JC, Kemp PR. Nov gene encodes adhesion factor for vascular smooth muscle cells and is dynamically regulated in response to vascular injury. Arterioscler Thromb Vasc Biol. 2000;20:1912–9. doi: 10.1161/01.atv.20.8.1912. [DOI] [PubMed] [Google Scholar]
- 23.Shimoyama T, et al. CCN3 inhibits neointimal hyperplasia through modulation of smooth muscle cell growth and migration. Arterioscler Thromb Vasc Biol. 2010;30:675–82. doi: 10.1161/ATVBAHA.110.203356. [DOI] [PubMed] [Google Scholar]
- 24.Heath E, et al. Abnormal skeletal and cardiac development, cardiomyopathy, muscle atrophy and cataracts in mice with a targeted disruption of the Nov (Ccn3) gene. BMC Dev Biol. 2008;8:18. doi: 10.1186/1471-213X-8-18. [DOI] [PMC free article] [PubMed] [Google Scholar]
- 25.Cools J, et al. Fusion of a novel gene, BTL, to ETV6 in acute myeloid leukemias with a t(4;12)(q11-q12;p13) Blood. 1999;94:1820–4. [PubMed] [Google Scholar]
- 26.Kamatani Y, et al. Genome-wide association study of hematological and biochemical traits in a Japanese population. Nat Genet. 2010;42:210–5. doi: 10.1038/ng.531. [DOI] [PubMed] [Google Scholar]
- 27.Dorn GW., 2nd Adrenergic signaling polymorphisms and their impact on cardiovascular disease. Physiol Rev. 2010;90:1013–62. doi: 10.1152/physrev.00001.2010. [DOI] [PubMed] [Google Scholar]
- 28.Kitsios GD, Zintzaras E. Synopsis and data synthesis of genetic association studies in hypertension for the adrenergic receptor family genes: the CUMAGAS-HYPERT database. Am J Hypertens. 2010;23:305–13. doi: 10.1038/ajh.2009.251. [DOI] [PMC free article] [PubMed] [Google Scholar]
- 29.Rohrer DK, Chruscinski A, Schauble EH, Bernstein D, Kobilka BK. Cardiovascular and metabolic alterations in mice lacking both beta1- and beta2-adrenergic receptors. J Biol Chem. 1999;274:16701–8. doi: 10.1074/jbc.274.24.16701. [DOI] [PubMed] [Google Scholar]
- 30.Cheng G, Qiao F, Gallien TN, Kuppuswamy D, Cooper Gt. Inhibition of beta-adrenergic receptor trafficking in adult cardiocytes by MAP4 decoration of microtubules. Am J Physiol Heart Circ Physiol. 2005;288:H1193–202. doi: 10.1152/ajpheart.00109.2004. [DOI] [PubMed] [Google Scholar]
- 31.Li Y, Abecasis GR. Mach 1.0: Rapid haplotype reconstruction and missing genotype inference. Am J Hum Genet S. 2006;79:2290. [Google Scholar]
- 32.Marchini J, Howie B, Myers S, McVean G, Donnelly P. A new multipoint method for genome-wide association studies by imputation of genotypes. Nat Genet. 2007;39:906–13. doi: 10.1038/ng2088. [DOI] [PubMed] [Google Scholar]
- 33.Servin B, Stephens M. Imputation-based analysis of association studies: candidate regions and quantitative traits. PLoS Genet. 2007;3:e114. doi: 10.1371/journal.pgen.0030114. [DOI] [PMC free article] [PubMed] [Google Scholar]
Associated Data
This section collects any data citations, data availability statements, or supplementary materials included in this article.


