

Abstract
The nucleus of the solitary tract (NST), located in the dorsomedial medulla, is the site of visceral sensory modulation of a variety of homeostatic reflexes. Given recent advancements in the understanding of active regulation of synaptic information flow by astrocytes, we sought to determine whether afferent sensory inputs to NST neurons also activates NST astrocytes. Using confocal, live-cell calcium imaging of brainstem slices, we investigated the possibility that stimulation of vagal sensory afferents, the major sensory input into the NST, activated NST astrocytes, as indicated by increases in astrocytic intracellular calcium concentrations ([Ca2+]i). Astrocytes and neurons were preloaded with the calcium reporter dye Calcium Green, and astrocytes were selectively stained by sulforhodamine 101. Electrical stimulation of vagal afferent axons produced rapid increases in [Ca2+]i in NST astrocytes as well as neurons. Surprisingly, this effect on astrocytes was blocked by the AMPA receptor antagonist NBQX and was unaffected by antagonism of NMDA and metabotropic glutamate receptors. Bath application of AMPA also activated astrocytes. This activation was dependent on extracellular Ca2+ influx through both typical AMPA receptors and calcium-permeable AMPA receptors. This AMPA-mediated Ca2+ influx was further amplified by actions of the ryanodine receptor by way of calcium-induced calcium release. Our immunohistochemical staining of NST cells further verified the presence of the AMPAR subunit GluR1 on astrocytes. These observations suggest that NST astrocytes may be active participants in the regulation of autonomic reflexes even in the normal, healthy state.
Introduction
The nucleus of the solitary tract (NST), located in the dorsal medulla, plays a critical role in the autonomic regulation of a variety of homeostatic functions, such as heart rate, respiration, blood pressure, blood flow, and gastrointestinal motility. The NST receives visceral sensory input via the facial, glossopharyngeal, and vagus nerves, with the primary input coming from the vagus (Blessing, 1997). These visceral afferents synapse with second-order neurons within the NST and act at the level of the NST to control homeostatic functions as well as behavioral responses to changes in the internal environment. Recent observations in our laboratory have demonstrated a significant role for NST astrocytes in the modulation of homeostatic reflexes, in particular gastric reflexes (Hermann et al., 2009).
This expanded role of astrocytes in homeostatic reflex modulation is not completely unexpected given that, over the past decade, it has become clear that the relationship of glia to neurons is not merely supportive but potentially interactive. Astrocytes are currently gaining wide acceptance as functional modulators of synaptic plasticity and integration. Neuronally driven increases in astrocytic intracellular calcium ([Ca2+]i) can lead to modulation of synaptic strength presynaptically and postsynaptically (Haydon and Carmignoto, 2006; Nimmerjahn, 2009; Perea et al., 2009; Halassa and Haydon, 2010), as well as coordination of synaptic networks (Fellin et al., 2006). These effects are driven by the release of neuroactive compounds by astrocytes, often referred to as “gliotransmitters” (Bezzi and Volterra, 2001; Zhang and Haydon, 2005; Hamilton and Attwell, 2010). This relationship between glia and presynaptic as well as postsynaptic neural elements has been termed the “tripartite synapse”(Araque et al., 1999).
Recent work in our laboratory has suggested an additional role for brainstem astrocytes in the tripartite synapse model. We have shown that activation of protease-activated receptors (PARs) in the NST produces a profound gastric stasis in vivo, and these PAR receptors are localized to NST astrocytes (Hermann et al., 2009). Additionally, we demonstrated that in vitro activation of NST astrocytes by PAR agonists leads to a delayed activation of adjacent NST neurons, which is presumably mediated by glutamate signaling (Hermann et al., 2009) through gliotransmission (Shigetomi et al., 2008). These results suggest an expanded mechanism for astrocytic control of synaptic integration in the NST through the direct activation of the astrocytic component of the tripartite synapse via intrinsic chemosensation.
Our previous study (Hermann et al., 2009) demonstrated that NST astrocytes activate NST neurons via glutamate gliotransmission. Results from those studies also suggested that NST astrocytes may be receiving tonic glutamatergic input not unlike that received by NST neurons (Smith et al., 1998; Lin et al., 2000). Therefore, the aim of the present study was to examine whether NST astrocytes are activated directly by glutamatergic inputs from vagal afferents.
Materials and Methods
A total of 68 Long–Evans rats (150–350 g; either sex), obtained from the breeding colony located at Pennington Biomedical Research Center, were used in these studies. All animals were maintained in a room with a 12 h light/dark cycle with constant temperature and humidity and were given food and water ad libitum. All experimental protocols were performed according to the guidelines set forth by the National Institutes of Health and were approved by the Institutional Animal Care and Use Committees at the Pennington Biomedical Research Center.
Live-cell Ca2+ imaging
In vivo prelabeling of brainstem neurons and astrocytes and subsequent slice preparation.
Animals were deeply anesthetized with urethane (3 g/kg, i.p.; Sigma) and placed in a stereotaxic frame. Using aseptic technique, the scalp was opened and the occipital plate was removed along with the roof of the fourth ventricle to expose the medullary brainstem. A micropipette (30 μm tip diameter) filled with the calcium reporter dye [1% Calcium Green-1 AM (CAG); Invitrogen] and the fluorescent vital dye for astrocytes, sulforhodamine 101 (SR101) (0.3% SR101; Sigma) in a 10% pluronic DMSO (F-127; Invitrogen) solution was directed at multiple sites along the rostrocaudal extent of the NST. Three or four sites of injection were made bilaterally immediately adjacent to area postrema starting at 0.2 mm caudal of the calamus and extending 0.8 mm rostrally. The micropipette was lowered to 300 μm below the brain surface; 40 nl injections of the dyes were made at each site.
After a 30–45 min interval for dye uptake by neurons and astrocytes, the anesthetized rat was decapitated and the brainstem was quickly harvested. The caudal brainstem was glued to a ceramic block and placed in cold (4°C) carbogenated (95% O2, 5% CO2) cutting solution (see recipe below). Horizontal or coronal sections (300 μm thick) were cut through the medulla using a vibratome (Leica VT1200) equipped with a sapphire knife. Slices were incubated in carbogenated normal Krebs' solution at 29°C for at least 60 min before transfer to the imaging chamber.
In vitro drugs and solutions.
The cutting solution contained the following (in mm): 110 choline chloride, 25 NaHCO3, 2.5 KCl, 7 MgSO4–7H2O, 1.25 NaH2PO4, 10 glucose, and 0.5 CaCl2–2H2O. Normal Krebs' solution contained the following (in mm): 124 NaCl, 25 NaHCO3, 3.0 KCl, 1 MgSO4–7H2O, 1.5 NaH2PO4, 10 glucose, and 1.5 CaCl2–2H2O. Ca2+-free Krebs' solution contained the following (in mm): 124 NaCl, 25 NaHCO3, 3.0 KCl, 2.5 MgSO4–7H2O, 1.5 NaH2PO4, 10 glucose, and 5.0 EGTA. All solutions were bubbled with 95% O2/5%CO2, continuously; osmolality was 300 ± 5 mOsm, pH 7.3. As needed for the different experimental conditions, the following drugs were added to the normal Krebs' solution: d-AP-5 (50 μm), MPEP (50 μm), CPCCOet (100 μm), NBQX (30 μm), CNQX (20 μm), AMPA (50 μm), tetrodotoxin (TTX) (1 μm), philanthotoxin-433 (PhTx) (3 μm), thapsigargin (1 μm), and ryanodine (10 μm). Tetrodotoxin and philanthotoxin-433 were obtained from Sigma-Aldrich. All other drugs were obtained from Tocris Bioscience.
In vitro electrical stimulation of vagal afferent fibers.
The solitary tract (ST) contains vagal afferent fibers that convey sensory information from the viscera to the NST. This fiber tract is easily identifiable in horizontal brainstem slices (Doyle et al., 2004). Horizontal sectioning allows stimulation of vagal afferent axons but minimizes artifactual activation of cells via passive current spread within the NST. In vitro electrical stimulation of vagal afferents was accomplished with a tungsten, concentric bipolar electrode (tip diameter of 100 μm; World Precision Instruments) placed directly upon the ST, 2–4 mm posterior to caudal NST. The stimulus parameters were controlled by an S-900 stimulator (Dagan) and Model 305-1 stimulus isolator (World Precision Instruments). Electrical stimulation of vagal afferent fibers (parameters: 0.25 ms pulses, 200 μA, 20 Hz) were delivered over durations of 0.25, 1, 2, 5, or 10 s (Fig. 1). Optimal cellular responses were elicited with the 2 s train duration. Therefore, all subsequent experiments used the 2 s train stimulus for all comparisons. Three evenly spaced, equivalent stimulus trains were applied over the course of each electrical stimulation trial. Stimulating multiple times per trial allowed multiple responses from each cell to be assessed, thereby reducing sample bias and experimental failure attributable to imaging artifacts. The largest response of each cell measured during any given trial was subsequently used for analysis.
Figure 1.

Examples of NST astrocytic activation driven by stimulation of incoming vagal afferent fibers. In vivo injection of CAG labels both astrocytes (a) and neurons (n) (A), whereas coinjection of SR101 exclusively labels astrocytes (B). C, Overlay of both the CAG and SR101 signals allows for easy discrimination between the two cell types in vitro. Electrical stimulation of vagal afferent fibers in the solitary tract produces rapid increases in intracellular calcium levels in NST astrocytes as measured by changes in the intensity of the CAG staining. D, Responses to stimulus trains of 1, 2, 5, and 10 s are represented by the percentage change in the intensity of the fluorescence of the CAG signal [(ΔF/F)%] as a function of time, and each response represents the average of four cells. Compared with the intensity of the same cell before stimulation (E), an increase in the fluorescent intensity of the CAG signal after stimulation is clearly visible in an individual astrocyte (F).
In vitro fluorescence imaging and signal analysis.
Slices were imaged in a custom-made Plexiglas chamber in which they were held in place with a harp-type pressor foot. Prelabeled slices were imaged with a Carl Zeiss Axioskop upright microscope equipped with a PerkinElmer Life and Analytical Sciences CSU10 Ultraview spinning disk confocal illuminator and water-immersion objectives. CAG and SR101 fluorescent imaging was conducted using a 488 nm excitation/long-pass emission and a 568 nm excitation/600 nm emission filter sets, respectively. The direct injection of SR101 into the NST (in conjunction with CAG) allowed for easy discrimination of astrocytes from neurons. Before any experimental procedures being conducted, the field of interest was sequentially imaged with the 488 and 568 nm laser lines to excite the CAG and SR101 dyes, respectively. When these two images are pseudocolored green (488 nm) and red (568 nm) and overlaid, astrocytes are clearly distinguishable from neurons (Fig. 1A–C).
A ValveLink 8 (AutoMate Scientific) perfusion system was used to control the delivery of normal bath solution and experimental solutions. All solutions were delivered at a rate of 2.5 ml/min and heated to 34°C via an TC-324B in-line temperature controller (Warner Instruments). Similar experimental methods have been described previously (Rogers et al., 2006; Rogers and Hermann, 2008; Hermann et al., 2009).
Experimental design.
All experimental procedures used in the present study followed the same fundamental design. Mixed fields of prelabeled neurons and astrocytes in the NST were identified according to their fluorescence. Relative [Ca2+]i levels were monitored in response to electrical stimulation of vagal afferents or agonist activation (50 μm AMPA; 30 s exposure). After this initial stimulation, the slices were exposed to either normal Krebs' solution perfusion or to normal Krebs' solution plus a pharmacological agent (e.g., antagonist) for 10 min. Slices were not imaged during this intervening perfusion. These two conditions served as either “time control” or “pharmacological antagonist” preparation before the second stimulation. Subsequent to this 10 min incubation, the original stimulation procedure (electrical or chemical) was repeated while relative changes in [Ca2+]i were recorded in the same field of cells. This allowed each cell to act as its own control in statistical analysis of the experimental results.
Relative changes in [Ca2+]i in response to all stimulation paradigms were quantified as changes in fluorescence: (ΔF/F)%, where F is the baseline fluorescence intensity within an area of interest (e.g., the outline of an SR101-labeled astrocyte) before stimulation, and ΔF is the peak change from this value resulting from stimulus-induced cellular activity (Helmchen, 1999). Background fluorescence (i.e., nonresponsive areas in same field) was subtracted from both F and ΔF. Ultraview software (PerkinElmer Life and Analytical Sciences) was used to quantify changes in fluorescent intensity versus time for each region of interest, and these data were then imported into Excel for analysis.
Data analysis.
Statistical analyses were performed using GraphPad Prism software (GraphPad Software). In both the vagal stimulation and AMPA activation experimental paradigms, the responses of each individual cell measured before and after either time control or pharmacological antagonist were normalized to the response of each cell to the initial stimulation under basal conditions. In each experimental condition, a paired t test was used to compare these two sets of paired responses (p values <0.05 were considered statistically significant). Each experimental condition contained data obtained from a minimum of 10 cells from at least three different slices obtained from two to five different animals.
In a second set of analyses, the normalized astrocytic responses to bath-applied AMPA after experimental challenge or time control were compared across all groups. A one-way ANOVA was used to compare the responses after time control with those collected after pharmacological antagonist to assess whether a significant reduction in the response occurred after an experiment manipulation (p values <0.05 were considered statistically significant; Dunnett's post hoc test comparisons were performed).
Immunohistochemical studies
Colocalization of SR101 and glial immunostaining.
SR101 is a fluorescent dye that is selectively taken up by astrocytes (Nimmerjahn et al., 2004) without apparent effects on viability or function of these cells (Kerr et al., 2005; Hermann et al., 2009; Chuquet et al., 2010). Patch-clamp recording studies have demonstrated a close correlation between glial fibrillary acidic protein (GFAP) immunostaining and single fluorescently labeled SR101-positive (SR101+) cells in hippocampus (Kafitz et al., 2008), yet characterization of extensive populations of SR101-positive cells is hampered by the fact that SR101 staining is lost during standard histological techniques. To quantify the overlap between SR101 staining and the more commonly used astrocyte marker S100 calcium binding protein B (S100B) (Matus and Mughal, 1975; Ludwin et al., 1976) in NST, images of SR101-labeled cells were collected in fresh frozen cryostat sections before fixation and aligned to images of identical fields of cells after fixation and staining for S100B.
Urethane-anesthetized rats (n = 3) received NST injections of SR101 as described above. After a 30–45 min interval for dye uptake, the anesthetized rat was decapitated and the brainstem was quickly harvested and flash frozen using liquid nitrogen in FSC 22 embedding matrix (Surgipath). The brainstem was cut into 5 μm coronal sections on a Leica CM1950 cryostat, and representative sections of the entire rostrocaudal extent of NST were collected on Plus slides. Slides were dried for 5 min at room temperature, and images of SR101 positive-cells in NST were collected with a Carl Zeiss Axioplan 2 microscope equipped with a Photometrics CoolSnap HQ CCD camera. The brainstem slices affixed to the slides were then processed for 10 min in neutral buffered Formalin, followed by immunofluorescence (IF) staining for S100B (see below for details of IF staining protocol). Images of S100B+ staining were then subsequently collected in the same area of each section.
To determine the degree of colocalization between SR101 and S100B staining, the outline of each SR101-positive cell and anatomical references (e.g., blood vessels, perimeter of the cerebral aqueduct, etc.) in the initial SR101+ images were used to create a template. Using the anatomical references, the template was then realigned on the subsequent S100B+ images, and the number of SR101+ cells that were also S100B+ was quantified.
Phenotypic identification of NST astrocytes and their receptors.
Double IF staining techniques were used to locate and quantify the percentage of GFAP-positive processes and cells bodies in the NST that expressed S100B (Matus and Mughal, 1975; Ludwin et al., 1976) as well as the percentage of GFAP-positive processes and cells bodies in the NST that expressed the type 1 subunit of AMPA receptors (GluR1). Additionally, IF staining was also used to locate and quantify S100B-labeled processes and cell bodies in the NST that expressed GFAP (Table 1).
Table 1.
Reagents for immunohistochemical identification
| Reagent | Host | Vendor | Catalog # | Dilution |
|---|---|---|---|---|
| GluR1 | Rabbit | Abcam | AB31323 | 1:500 |
| GFAP | Chicken | Neuromics | CH22102 | 1:500 |
| S100B | Mouse | Abcam | AB66028 | 1:500 |
| Alexa Fluor 488, donkey anti-rabbit | Donkey | Invitrogen | A-21206 | 1:250 |
| Alexa Fluor 594, goat anti-chicken | Goat | Invitrogen | A-11042 | 1:250 |
| Alexa Fluor 594, donkey anti-mouse | Donkey | Invitrogen | A-21203 | 1:250 |
Urethane-anesthetized rats (n = 12) were transcardially perfused with PBS followed by 4% paraformaldehyde in PBS. Brains were removed, cryoprotected overnight in a 30% sucrose solution, and cut into 40 μm coronal sections on a freezing microtome. Heat-induced epitope-retrieval was then performed on the sections using a decloaking chamber (Biocare Medical; 80ο C for 30 min). The histological sections were placed in PBS before immunofluorescence staining. [Between each incubation step, the sections were triple rinsed in PBS (5 min per rinse).] The tissue sections were pretreated with 1% sodium borohydride to remove residual aldehyde fixative. The blocking step consisted of incubation of Rodent Block R (Biocare Medical) for 30 min. Sections were incubated (overnight at room temperature on a shaker table) in primary antibody in 0.3% Triton X-100 in PBS (Table 1). After PBS rinses, the tissue sections were placed in secondary antibody (Table 1). In a subset of sections, appropriate blocking controls, either epitope-blocking or IgG-negative controls, were performed to ensure the specificity of each primary antibody. Sections were incubated in secondary antibody for 2 h and then mounted on Plus slides and coverslipped with ProLongGold (Invitrogen). Sections were viewed on a Nikon E800 fluorescence microscope, and images were collected with a PerkinElmer Life and Analytical Sciences CSU21 Ultraview spinning disk confocal illuminator.
Colocalization analysis of IF staining was performed using Volocity software, version 5.5 (PerkinElmer Life and Analytical Sciences). Multiple images in the z-plane (1 μm step size) were collected in each field of cells with a CFI Plan Apochromat UW 60× objective (0.95 NA; Nikon). Registration errors between the 488 and 568 nm laser lines inherent to the objective lens were corrected using TetraSpeck fluorescent microspheres (Invitrogen) and the registration correction tool associated with the Volocity software. The z-stacks were rendered into a three-dimensional representation, and S100B+ and GFAP+ cellular processes and cell bodies were identified using the object recognition routines of Volocity. The thresholds of each fluorescent channel were objectively determined using an algorithm developed for the analysis of colocalization of fluorescent signals (Costes et al., 2004), and a statistical analysis of colocalization (Manders et al., 1993) was performed on the previously determined S100B+ or GFAP+ objects using the objectively determined channel thresholds.
Results
Stimulation of vagal afferents leads to activation of NST astrocytes in vitro
Electrical stimulation of the solitary tract produced rapid increases in intracellular calcium concentrations in SR101-labeled astrocytes as measured by the percentage increase in fluorescence observed in the calcium green signal after stimulation relative to baseline, i.e., (ΔF/F)% (Fig. 1D). The astrocytic activation in response to electrical stimulation of vagal afferent fibers was significantly reduced to 6.1 ± 2.2% of the basal response by bath application of TTX (n = 18 cells). Thus, the astrocytic effect was dependent on the induction of action potentials in the axons of vagal sensory afferents and not attributable to current spread from the stimulating electrode.
Activation of NST astrocytes via vagal afferent stimulation is mediated by AMPA receptors
Bath application of the AMPA receptor (AMPAR) antagonist [NBQX, 30 μm (Randle et al., 1992; Doyle et al., 2004)] reduced the astrocytic activation induced by vagal afferent stimulation to 10.3 ± 3.8% of basal levels (n = 30 cells; Fig. 2B). In contrast, the vagally mediated activation of astrocytes was unchanged by the bath application of excitatory metabotropic glutamate receptor (mGluR) antagonists [MPEP, 50 μm (Chapman et al., 2000; Young et al., 2007); CPCCOet, 100 μm (Litschig et al., 1999; Piet and Jahr, 2007)] compared with the activation elicited in the same cells before drug application (Fig. 2C,D). Similarly, bath application of a NMDA receptor antagonist [d-AP-5, 20 μm (Perea and Araque, 2005)] also had no influence on subsequent activation of NST astrocytes (Fig. 2E).
Figure 2.

The effect of different glutamatergic antagonists on the activation of NST astrocytes by vagal afferent stimulation. Under control conditions (A, time control; n = 45), two separate vagal stimulations (3 2-s trains) separated by 10 min produced similar responses in terms of normalized mean peak magnitude (left column) and response kinetics (right column) (A). The bath application of AMPAR antagonist NBQX produced a marked reduction in these two parameters compared with basal responses (B; n = 30 cells). However, peak magnitude and response kinetics were similarly unaffected by the 10 min bath application of the mGluR5 antagonist MPEP (C; n = 10 cells), the mGluR1 antagonist CPCCOet (D; n = 40 cells), and the NMDA receptor antagonist AP-5 (E; n = 36 cells). Raw traces in the right column represent the average response of four cells before and after experimental manipulation. *p < 0.05, paired t test.
Bath application of 50 μm AMPA, a potent AMPAR agonist, produced a robust increase in astrocytic intracellular calcium concentrations [average peak (ΔF/F)% = 15.9 ± 1.1 (n = 53 cells)]. Time control experiments were conducted with AMPA agonist; the response to second administration of AMPA was not statistically different from the first [106.4 ± 4.5% of basal levels (n = 53 cells); Fig. 3A]. To rule out the possibility that the astrocytic response to AMPA was mediated through a secondary signaling pathway initiated by activation of neuronal AMPARs, TTX was used to block action potential-mediated communication between neurons and astrocytes. Although bath application of TTX reduced the astrocytic response to 80.3% ± 4.5 of basal levels, it did not abolish the response (n = 31 cells; Fig. 3B). Conversely, bath application of NBQX reduced the response to AMPA to 16.9 ± 2.8% of basal levels (n = 28 cells; Fig. 3C).
Figure 3.
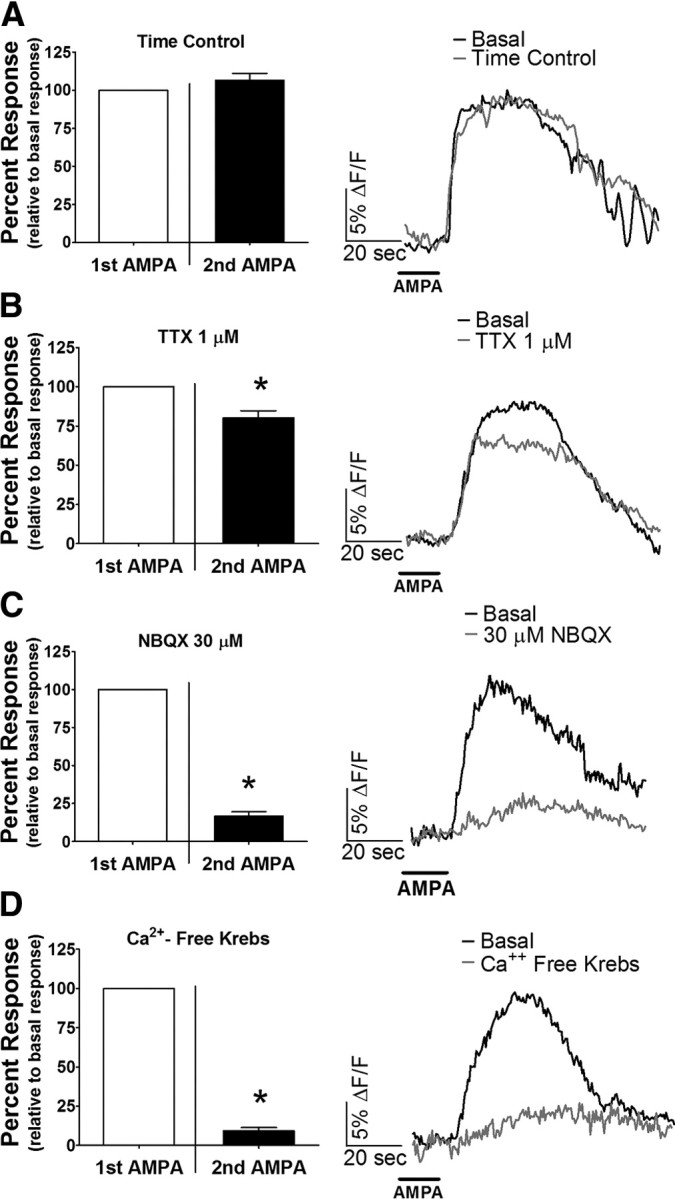
NST astrocytes are directly activated by calcium influx through AMPA receptors. A, Under time control conditions, similar increases in astrocytic [Ca2+]i are seen in response to repetitive bath application of the AMPAR agonist AMPA (n = 53 cells). B, Although treatment with TTX caused a reduction in the response to the second application of AMPA, the resulting response remained essentially intact (n = 31 cells). However, the response to the second application of AMPA was blocked by intervening treatment with either 30 μm NBQX, an AMPAR antagonist (C; n = 28 cells), or Ca2+-free Krebs' media (D; n = 60 cells). Raw traces on the right of each panel represent the average response of five cells before and after experimental manipulation. *p < 0.05, paired t test.
AMPA-mediated NST astrocytic calcium signaling is driven by calcium-induced calcium release
The elimination of AMPAR calcium conductance with Ca2+-free Krebs' media (Hermann et al., 2005) resulted in a reduction in the response to AMPA to 9.3 ± 2.0% of basal levels (n = 60 cells; Fig. 3D), suggesting that extracellular Ca2+ influx is necessary for the observed astrocytic activation. To test the involvement of calcium-permeable AMPARs (CP-AMPARs) in the response, we measured the AMPA-mediated activation of NST astrocytes after the bath application of a selective CP-AMPAR antagonist [philanthotoxin-433, 3 μm (Washburn and Dingledine, 1996)]. Although PhTx produced a statistically significant reduction of the response to 60.9 ± 2.0% of basal levels (n = 28 cells; Fig. 4A), the reduction was less than that seen with the overall antagonism of all AMPARs by NBQX (Fig. 3C). In contrast, the bath application of ryanodine, an antagonist of Ca2+ release from the endoplasmic reticulum (ER) via the ryanodine receptor, produced a larger reduction in the AMPA-mediated astrocytic response [45.6 ± 5.5% of basal levels (n = 11 cells); Fig. 4B]. The combined application of ryanodine and PhTx further reduced the response to 25.2 ± 7.5% of basal levels (n = 14 cells; Fig. 4C). Bath application of thapsigargin, an inhibitor of ER Ca2+ ATPases (Thastrup et al., 1990), also robustly decreased the response to 57.1 ± 3.1% of basal levels (n = 34 cells; Fig. 4D).
Figure 4.

AMPA-mediated NST astrocytic activation is driven by calcium influx through AMPA receptors leading to CICR from intracellular stores. A, Pharmacological blockade of calcium-permeable AMPA receptors by PhTx leads to a statistically significant reduction in the normalized response magnitude of the astrocytic response to bath-applied AMPA when compared with the responses of the same cells under basal conditions, i.e., the initial AMPA application (n = 56 cells). A dependence on intracellular calcium release from the ER is suggested by a similar decrease in the response (B) by blocking ryanodine receptor-mediated CICR with ryanodine (n = 24 cells). C, An additional reduction in the response was achieved by the combined application of ryanodine and philanthotoxin (n = 14 cells). D, Application of thapsigargin, an inhibitor of ER calcium ATPases (n = 34 cells), also produced a statistically significant reduction in the response compared with basal responses. *p < 0.05, paired t test. E shows a comparison of the magnitude of the normalized responses to the second application of AMPA after different pharmacological interventions versus time control responses. All drugs produced a statistically significant reduction in the response relative to time control (one-way ANOVA, F(4,237) = 39.57, p < 0.0001; Dunnett's post hoc comparison, +p < 0.05).
NST astrocytes possess AMPA receptors
To confirm the astrocytic specificity of SR101 in the NST, we used fluorescence immunohistochemical (IHC) staining to demonstrate the colocalization of SR101 and the astrocyte marker S100B. The overwhelming majority of SR101+ cells counted in NST were also S100B+ (96.4%; Table 2; Fig. 5A–C). The extent of colocalization between S100B and GFAP in NST was also measured, specifically 97.7% of S100B+ cell cellular processes and cell bodies were also GFAP+, whereas 98.3% of GFAP+ cellular processes and cell bodies were also S100B+ (Table 2; Fig. 6A–C). IHC staining for GFAP identification tends to be most robust in the distal processes of NST astrocytes (Fig. 6B,E). Therefore, given the nearly identical overlap of expression of GFAP and S100B, we chose to pursue the demonstration of AMPAR on NST astrocytes through colocalization of GFAP and GluR1 immunostaining. Objective analysis of this colocalization (Manders et al., 1993; Costes et al., 2004) demonstrated that 70.7% of GFAP+ cellular processes and cell bodies were GluR1+ (Table 2; Fig. 7A–F). Not unexpectedly, our GluR1 staining was not confined exclusively to GFAP+ cells and processes, because it labeled neuronal GluR1 subunit expression as well (Fig. 7A–F).
Table 2.
Cellular immune fluorescent colocalization of SR101, S100B, GFAP, and GluR1
| Markers | % Colocalization | Colocalized cells | Total cells counted |
|---|---|---|---|
| SR101 versus S100B | 96.4 | 1288 | 1336 |
| S100B versus GFAP | 97.7 | 1243 | 1272 |
| GFAP versus S100B | 98.3 | 1187 | 1208 |
| GFAP versus GluR1 | 70.7 | 1032 | 1460 |
Figure 5.

Direct injection of SR101 into NST exclusively stains astrocytes. After in vivo injection of SR101 into NST, images of fresh frozen coronal sections (5 μm) through NST demonstrate fluorescent cellular staining (A). After Formalin fixation and immunostaining for the astrocyte marker S100B, images of the same regions of NST produces a similar staining pattern (B). C, When the images are aligned using anatomical references, such as blood vessels, the SR101 and S100B staining pattern is nearly identical.
Figure 6.

S100B and GFAP immunostaining in NST labels similar cell populations. Under low magnification, fluorescent immunostaining in NST for both the astrocytic markers S100B (A) and GFAP (B) label an extensive population of cells. C, When the two signals are overlaid, significant overlap is seen between these two populations of labeled cells. Under higher magnification, one can appreciate the qualitatively different staining characteristics that S100B (D) and GFAP (E) immunostaining produces in identifying the same astrocytes. S100B readily labels the soma and the larger processes, whereas GFAP labeling is predominantly seen in the processes. This is most clearly visualized in the merged image (F), in which the more complete cytoplasmic staining characteristic of S100B is evident, whereas GFAP yields a more pronounced staining of fine cellular processes. Furthermore, objective analysis of the colocalization of S100B and GFAP demonstrates a nearly complete overlap of these two IHC phenotypes in NST, which is readily apparent under higher magnification (E). Each panel represents a maximum projection of z-stacks imaged through ∼20 μm of depth.
Figure 7.

NST astrocytes express AMPA receptors. Immunofluorescent staining for the type 1 subunit of AMPA receptors (GluR1) labels cell bodies as well as discrete puncta (A), whereas GFAP stains astrocytic processes (B). Objective analysis of colocalization of the two fluorescent signals demonstrates that GluR1 and GFAP are colocalized in NST. C, When areas of colocalization are pseudocolored yellow, it becomes clear that a subpopulation of the observed GluR1 puncta are located on astrocytic processes. D–F, A higher magnification of an individual astrocyte demonstrates numerous GluR1 puncta located on its distal processes. Each panel represents a maximum projection of z-stacks imaged through ∼20 μm of depth.
Discussion
The present study demonstrates that stimulation of vagal afferent inputs into the NST activates NST astrocytes. This vagal afferent activation is driven by a signaling mechanism not typically found in astrocytes, i.e., mediated by activation of ionotropic receptors as opposed to metabotropic neurotransmitter receptors (Perea et al., 2009; Halassa and Haydon, 2010; Hamilton and Attwell, 2010). Our IHC staining of NST cells further verified the presence of the AMPAR subunit GluR1 on astrocytes. Although a similar phenomenon has been described in cultured hippocampal astrocytes (Sharma and Vijayaraghavan, 2001), to the best of our knowledge, our results represent the only reported instance of neuronally mediated astrocytic increases in [Ca2+]i driven solely by activation of ionotropic receptors and calcium-induced calcium release (CICR) in situ.
The vagally mediated activation of NST astrocytes was blocked by the AMPAR antagonist NBQX, as well as by the use of Ca2+-free extracellular media, thus indicating a dependence on extracellular Ca2+ influx through AMPARs. This AMPA-mediated activation of NST astrocytes is driven by both typical AMPARs and CP-AMPARs, because the response of NST astrocytes to bath application of AMPA was only moderately blocked by the CP-AMPAR antagonist PhTx. In addition, activation of NST astrocytes by bath application of AMPA remained primarily intact in the presence of TTX. It is conceivable that bath application of AMPA could lead to neurotransmitter release by second-order neurons in NST in the presence of TTX through direct activation their presynaptic terminals. However, given our IHC data demonstrating AMPAR on NST astrocytes, the most parsimonious interpretation of our data is that the AMPA induced activation of NST astrocytes is a direct effect of stimulation of astrocytic AMPARs as opposed to an indirect activation of NST astrocytes by neurons that are themselves activated by AMPA. The slight reduction in the response produced by TTX is likely attributable to the loss of tonic vagal inputs to NST astrocytes, which would normally sum with the AMPA-induced response in control conditions (Hermann et al., 2009). Given that bath application of either thapsigargin or ryanodine produced a significant reduction in the response, it appears that the AMPAR-mediated Ca2+ influx leads to additional Ca2+ release from intracellular stores via ryanodine receptors.
Our data are unable to directly address the relative contribution of AMPAR Ca2+ conductance and CICR to the overall activation induced in NST astrocytes, but several lines of evidence support a nearly equal contribution. When CICR was blocked by ryanodine, an increase in [Ca2+]i was still maintained with a magnitude equal to 46% of the control response (Fig. 4E). Similarly, when CP-AMPAR were blocked with PhTx, the residual response magnitude was equal to 61% of the control response (Fig. 4E). When both CP-AMPAR and CICR were blocked simultaneously, the magnitude of the residual response was further decreased to 25% of control responses (Fig. 4E). This modulated response was larger than the magnitude of the residual response recorded under Ca2+-free Krebs' media (Fig. 4E) and, therefore, was presumably attributable to Ca2+ conductance through typical AMPAR. It should be noted that, although patch-clamp studies have reported that typical AMPAR have little or no Ca2+ conductance attributable to the presence of the GluR2 subunit (Hollmann et al., 1991), a calcium imaging study has demonstrated robust AMPAR-mediated increases in [Ca2+]i in HEK293 cells, regardless of GluR2 subunit expression (Utz and Verdoorn, 1997).
The results of the present study are unique when compared with other investigations of afferent activation of astrocytes. Previous studies have demonstrated that stimulation of neuronal afferents leads to similar activation of astrocytes in hippocampus (Pasti et al., 1997; Araque et al., 2002), nucleus accumbens (D'Ascenzo et al., 2007), and myenteric plexus (Gulbransen and Sharkey, 2009), as well as in cerebellar Bergmann glia (Beierlein and Regehr, 2006; Piet and Jahr, 2007) and retinal Müller cells (Newman, 2005). However, in contrast to our results, these studies demonstrate astrocytic activation via metabotropic receptors, regardless of the specific neurotransmitter involved. Indeed, ionotropic receptor-mediated calcium signaling has only been reported previously in Bergmann glia in which the initial phase of the calcium signal induced by stimulation of the cerebellar molecular layer was driven by activation of AMPARs. This rapid phase of the response was followed by a much larger and sustained increase in [Ca2+]i that was driven by metabotropic purinergic receptors (Piet and Jahr, 2007).
Other studies have shown that similar neuronally driven increases in astrocytic [Ca2+]i lead to modulation of synaptic strength. Direct neuronal activation of astrocytes has been reported to, in turn, cause astrocytes to regulate synaptic strength in the hypothalamus (Theodosis, 2002), hippocampus (Fellin et al., 2004; Perea and Araque, 2007; Henneberger et al., 2010), nucleus accumbens (D'Ascenzo et al., 2007), and retina (Newman, 2003, 2005), as well as modulate network plasticity in the hippocampus (Zhang et al., 2003; Pascual et al., 2005). These modulations in synaptic strength are driven by the release of gliotransmitters, such as ATP, glutamate, d-serine, TNFα, and GABA, which then act either presynaptically or postsynaptically to affect synaptic transmission (Fellin et al., 2006; Haydon and Carmignoto, 2006; Perea et al., 2009; Halassa and Haydon, 2010). Our previous studies (Hermann et al., 2009) demonstrated that agonist-induced activation of NST astrocytes led to subsequent activation of adjacent neurons. Those studies also demonstrated an agonist-mediated change in gastric transit (Hermann et al., 2009). Together, these studies suggest multiple possible sequences in which neuronal activation of glia or vice versa may modulate homeostatic reflex control at the level of second-order neurons within the NST.
Our IHC observations that essentially all SR101-positive cells in the NST also expressed the astrocytic marker S100B, and the extensive overlap in S100B and GFAP staining classifies SR101+ cells as typical stellate astrocytes (Kimelberg, 2004). However, results from our live-cell imaging studies demonstrated that these NST astrocytes do not use the same signaling mechanism(s) as other stellate astrocytes (i.e., ionotropic rather than metabotropic glutamate receptors). Thus, it is clear that similarities in expression of astrocytic markers does not equate to similarities in physiology. Rather, these observations support the principle of astrocyte heterogeneity. That is, astrocytes that share several phenotypic markers can differ greatly in their physiology and functions (Wilkin et al., 1990; Kimelberg, 2004; Wang and Bordey, 2008; Matyash and Kettenmann, 2010).
Although stellate astrocytes have classically been defined by a lack of AMPAR expression (Nishiyama et al., 2005; Wang and Bordey, 2008; Matyash and Kettenmann, 2010), patch-clamp technology indicates the presence of functional AMPARs (i.e., AMPA-mediated inward currents) on subpopulations of these astrocytes in the hippocampus (Zhou and Kimelberg, 2000), rabbit retina (Clark and Mobbs, 1992), as well as in cerebellar Bergmann glia (Iino et al., 2001; Piet and Jahr, 2007). In contrast to hippocampus (Zhou and Kimelberg, 2000; Zhou and Kimelberg, 2001), AMPAR-mediated currents are common in brainstem astrocytes (Akopian et al., 1997; Grass et al., 2004). The present observations that NST astrocytes use AMPAR signaling to increase astrocytic [Ca2+]i provides a link to active glial–neural signaling. The AMPAR-mediated activation of astrocytes would produce a more rapid response relative to the metabotropic receptor activation reported previously. Therefore, AMPAR-mediated activation of astrocytes may induce gliotransmitter release that is time-locked to bursts of local vagal afferent input. The result could be rapid glial amplification or attenuation of vago-vagal reflex sensitivity.
Clearly, it still remains to be determined whether this neural–glial activation of NST astrocytes leads directly to the release of gliotransmitter and, ultimately, modulates information processing at the NST similar to that reported in other brain nuclei (Zhang et al., 2003; Pascual et al., 2005; Perea and Araque, 2007). However, our previous study on glial–neural interactions in the NST (Hermann et al., 2009) demonstrated that stimulation of proteinase-activated receptors on NST astrocytes mediated increases in astrocytic [Ca2+]i that lead to glutamate gliotransmission and subsequent increases in NST neuronal [Ca2+]i.
Recent work on brainstem astrocytes suggests that they may be important chemodetectors for autonomic control. The present results suggest that any astrocytes functioning as a chemosensor in the NST could have its chemosensitivity significantly modulated by vagal sensory input. Astrocytes integrating both chemosensory and visceral afferent inputs could dramatically alter the function of homeostatic processes dependent on vago-vagal reflex mechanisms. That is, one might envision the possibility that vagal afferent input (e.g., gastric mechanoreception) could modulate the chemosensory properties of the NST astrocytes (e.g., blood glucose levels) such that the sensitivity to blood-borne agonists may be dynamically influenced by changes in the internal milieu during feeding or fasting.
Footnotes
This work was supported by NIH Grants NS55866, NS60664, DK52142, and HD47643. In addition, this work used the facilities of the Cell Biology and Bioimaging Core, which is supported in part by Center of Biomedical Research Excellence (Grant P20-RR021945) and Nutrition Obesity Research Center (Grant 1P30-DK072476) grants from the National Institutes of Health. We thank Montina J. Van Meter for her outstanding technical immunohistological skills and expertise.
References
- Akopian G, Kuprijanova E, Kressin K, Steinhüser C. Analysis of ion channel expression by astrocytes in red nucleus brain stem slices of the rat. Glia. 1997;19:234–246. [PubMed] [Google Scholar]
- Araque A, Parpura V, Sanzgiri RP, Haydon PG. Tripartite synapses: glia, the unacknowledged partner. Trends Neurosci. 1999;22:208–215. doi: 10.1016/s0166-2236(98)01349-6. [DOI] [PubMed] [Google Scholar]
- Araque A, Martín ED, Perea G, Arellano JI, Buño W. Synaptically released acetylcholine evokes Ca2+ elevations in astrocytes in hippocampal slices. J Neurosci. 2002;22:2443–2450. doi: 10.1523/JNEUROSCI.22-07-02443.2002. [DOI] [PMC free article] [PubMed] [Google Scholar]
- Beierlein M, Regehr WG. Brief bursts of parallel fiber activity trigger calcium signals in Bergmann glia. J Neurosci. 2006;26:6958–6967. doi: 10.1523/JNEUROSCI.0613-06.2006. [DOI] [PMC free article] [PubMed] [Google Scholar]
- Bezzi P, Volterra A. A neuron-glia signalling network in the active brain. Curr Opin Neurobiol. 2001;11:387–394. doi: 10.1016/s0959-4388(00)00223-3. [DOI] [PubMed] [Google Scholar]
- Blessing WW. The lower brainstem and bodily homeostasis. New York: Oxford UP; 1997. [Google Scholar]
- Chapman AG, Nanan K, Williams M, Meldrum BS. Anticonvulsant activity of two metabotropic glutamate group I antagonists selective for the mGlu5 receptor: 2-methyl-6-(phenylethynyl)-pyridine (MPEP), and (E)-6-methyl-2-styryl-pyridine (SIB 1893) Neuropharmacology. 2000;39:1567–1574. doi: 10.1016/s0028-3908(99)00242-7. [DOI] [PubMed] [Google Scholar]
- Chuquet J, Quilichini P, Nimchinsky EA, Buzsáki G. Predominant enhancement of glucose uptake in astrocytes versus neurons during activation of the somatosensory cortex. J Neurosci. 2010;30:15298–15303. doi: 10.1523/JNEUROSCI.0762-10.2010. [DOI] [PMC free article] [PubMed] [Google Scholar]
- Clark B, Mobbs P. Transmitter-operated channels in rabbit retinal astrocytes studied in situ by whole-cell patch clamping. J Neurosci. 1992;12:664–673. doi: 10.1523/JNEUROSCI.12-02-00664.1992. [DOI] [PMC free article] [PubMed] [Google Scholar]
- Costes SV, Daelemans D, Cho EH, Dobbin Z, Pavlakis G, Lockett S. Automatic and quantitative measurement of protein-protein colocalization in live cells. Biophys J. 2004;86:3993–4003. doi: 10.1529/biophysj.103.038422. [DOI] [PMC free article] [PubMed] [Google Scholar]
- D'Ascenzo M, Fellin T, Terunuma M, Revilla-Sanchez R, Meaney DF, Auberson YP, Moss SJ, Haydon PG. mGluR5 stimulates gliotransmission in the nucleus accumbens. Proc Natl Acad Sci U S A. 2007;104:1995–2000. doi: 10.1073/pnas.0609408104. [DOI] [PMC free article] [PubMed] [Google Scholar]
- Doyle MW, Bailey TW, Jin YH, Appleyard SM, Low MJ, Andresen MC. Strategies for cellular identification in nucleus tractus solitarius slices. J Neurosci Methods. 2004;137:37–48. doi: 10.1016/j.jneumeth.2004.02.007. [DOI] [PubMed] [Google Scholar]
- Fellin T, Pascual O, Gobbo S, Pozzan T, Haydon PG, Carmignoto G. Neuronal synchrony mediated by astrocytic glutamate through activation of extrasynaptic NMDA receptors. Neuron. 2004;43:729–743. doi: 10.1016/j.neuron.2004.08.011. [DOI] [PubMed] [Google Scholar]
- Fellin T, Pascual O, Haydon PG. Astrocytes coordinate synaptic networks: balanced excitation and inhibition. Physiology (Bethesda) 2006;21:208–215. doi: 10.1152/physiol.00161.2005. [DOI] [PubMed] [Google Scholar]
- Grass D, Pawlowski PG, Hirrlinger J, Papadopoulos N, Richter DW, Kirchhoff F, Hülsmann S. Diversity of functional astroglial properties in the respiratory network. J Neurosci. 2004;24:1358–1365. doi: 10.1523/JNEUROSCI.4022-03.2004. [DOI] [PMC free article] [PubMed] [Google Scholar]
- Gulbransen BD, Sharkey KA. Purinergic neuron-to-glia signaling in the enteric nervous system. Gastroenterology. 2009;136:1349–1358. doi: 10.1053/j.gastro.2008.12.058. [DOI] [PubMed] [Google Scholar]
- Halassa MM, Haydon PG. Integrated brain circuits: astrocytic networks modulate neuronal activity and behavior. Annu Rev Physiol. 2010;72:335–355. doi: 10.1146/annurev-physiol-021909-135843. [DOI] [PMC free article] [PubMed] [Google Scholar]
- Hamilton NB, Attwell D. Do astrocytes really exocytose neurotransmitters? Nat Rev Neurosci. 2010;11:227–238. doi: 10.1038/nrn2803. [DOI] [PubMed] [Google Scholar]
- Haydon PG, Carmignoto G. Astrocyte control of synaptic transmission and neurovascular coupling. Physiol Rev. 2006;86:1009–1031. doi: 10.1152/physrev.00049.2005. [DOI] [PubMed] [Google Scholar]
- Helmchen F. Calibration of fluorescent calcium indicators. In: Yuste R, Lanni F, Konnerth A, editors. Imaging neurons: a laboratory manual. Cold Spring Harbor, NY: Cold Spring Harbor Laboratory; 1999. pp. 32.31–32.39. In: Imaging neurons. [Google Scholar]
- Henneberger C, Papouin T, Oliet SH, Rusakov DA. Long-term potentiation depends on release of d-serine from astrocytes. Nature. 2010;463:232–236. doi: 10.1038/nature08673. [DOI] [PMC free article] [PubMed] [Google Scholar]
- Hermann GE, Nasse JS, Rogers RC. Alpha-1 adrenergic input to solitary nucleus neurones: calcium oscillations, excitation and gastric reflex control. J Physiol. 2005;562:553–568. doi: 10.1113/jphysiol.2004.076919. [DOI] [PMC free article] [PubMed] [Google Scholar]
- Hermann GE, Van Meter MJ, Rood JC, Rogers RC. Proteinase-activated receptors in the nucleus of the solitary tract: evidence for glial-neural interactions in autonomic control of the stomach. J Neurosci. 2009;29:9292–9300. doi: 10.1523/JNEUROSCI.6063-08.2009. [DOI] [PMC free article] [PubMed] [Google Scholar]
- Hollmann M, Hartley M, Heinemann S. Ca2+ permeability of KA-AMPA-gated glutamate receptor channels depends on subunit composition. Science. 1991;252:851–853. doi: 10.1126/science.1709304. [DOI] [PubMed] [Google Scholar]
- Iino M, Goto K, Kakegawa W, Okado H, Sudo M, Ishiuchi S, Miwa A, Takayasu Y, Saito I, Tsuzuki K, Ozawa S. Glia-synapse interaction through Ca2+-permeable AMPA receptors in Bergmann glia. Science. 2001;292:926–929. doi: 10.1126/science.1058827. [DOI] [PubMed] [Google Scholar]
- Kafitz KW, Meier SD, Stephan J, Rose CR. Developmental profile and properties of sulforhodamine 101-labeled glial cells in acute brain slices of rat hippocampus. J Neurosci Methods. 2008;169:84–92. doi: 10.1016/j.jneumeth.2007.11.022. [DOI] [PubMed] [Google Scholar]
- Kerr JN, Greenberg D, Helmchen F. Imaging input and output of neocortical networks in vivo. Proc Natl Acad Sci U S A. 2005;102:14063–14068. doi: 10.1073/pnas.0506029102. [DOI] [PMC free article] [PubMed] [Google Scholar]
- Kimelberg HK. The problem of astrocyte identity. Neurochem Int. 2004;45:191–202. doi: 10.1016/j.neuint.2003.08.015. [DOI] [PubMed] [Google Scholar]
- Lin LH, Emson PC, Talman WT. Apposition of neuronal elements containing nitric oxide synthase and glutamate in the nucleus tractus solitarii of rat: a confocal microscopic analysis. Neuroscience. 2000;96:341–350. doi: 10.1016/s0306-4522(99)00560-6. [DOI] [PubMed] [Google Scholar]
- Litschig S, Gasparini F, Rueegg D, Stoehr N, Flor PJ, Vranesic I, Prézeau L, Pin JP, Thomsen C, Kuhn R. CPCCOEt, a noncompetitive metabotropic glutamate receptor 1 antagonist, inhibits receptor signaling without affecting glutamate binding. Mol Pharmacol. 1999;55:453–461. [PubMed] [Google Scholar]
- Ludwin SK, Kosek JC, Eng LF. The topographical distribution of S-100 and GFA proteins in the adult rat brain: an immunohistochemical study using horseradish peroxidase-labelled antibodies. J Comp Neurol. 1976;165:197–207. doi: 10.1002/cne.901650206. [DOI] [PubMed] [Google Scholar]
- Manders EM, Verbeek FJ, Aten JA. Measurement of colocalization of objects in dual-color confocal images. J Microsc. 1993;169:375–382. doi: 10.1111/j.1365-2818.1993.tb03313.x. [DOI] [PubMed] [Google Scholar]
- Matus A, Mughal S. Immunohistochemical localisation of S-100 protein in brain. Nature. 1975;258:746–748. doi: 10.1038/258746a0. [DOI] [PubMed] [Google Scholar]
- Matyash V, Kettenmann H. Heterogeneity in astrocyte morphology and physiology. Brain Res Rev. 2010;63:2–10. doi: 10.1016/j.brainresrev.2009.12.001. [DOI] [PubMed] [Google Scholar]
- Newman EA. Glial cell inhibition of neurons by release of ATP. J Neurosci. 2003;23:1659–1666. doi: 10.1523/JNEUROSCI.23-05-01659.2003. [DOI] [PMC free article] [PubMed] [Google Scholar]
- Newman EA. Calcium increases in retinal glial cells evoked by light-induced neuronal activity. J Neurosci. 2005;25:5502–5510. doi: 10.1523/JNEUROSCI.1354-05.2005. [DOI] [PMC free article] [PubMed] [Google Scholar]
- Nimmerjahn A. Astrocytes going live: advances and challenges. J Physiol. 2009;587:1639–1647. doi: 10.1113/jphysiol.2008.167171. [DOI] [PMC free article] [PubMed] [Google Scholar]
- Nimmerjahn A, Kirchhoff F, Kerr JN, Helmchen F. Sulforhodamine 101 as a specific marker of astroglia in the neocortex in vivo. Nat Methods. 2004;1:31–37. doi: 10.1038/nmeth706. [DOI] [PubMed] [Google Scholar]
- Nishiyama A, Yang Z, Butt A. Astrocytes and NG2-glia: what's in a name? J Anat. 2005;207:687–693. doi: 10.1111/j.1469-7580.2005.00489.x. [DOI] [PMC free article] [PubMed] [Google Scholar]
- Pascual O, Casper KB, Kubera C, Zhang J, Revilla-Sanchez R, Sul JY, Takano H, Moss SJ, McCarthy K, Haydon PG. Astrocytic purinergic signaling coordinates synaptic networks. Science. 2005;310:113–116. doi: 10.1126/science.1116916. [DOI] [PubMed] [Google Scholar]
- Pasti L, Volterra A, Pozzan T, Carmignoto G. Intracellular calcium oscillations in astrocytes: a highly plastic, bidirectional form of communication between neurons and astrocytes in situ. J Neurosci. 1997;17:7817–7830. doi: 10.1523/JNEUROSCI.17-20-07817.1997. [DOI] [PMC free article] [PubMed] [Google Scholar]
- Perea G, Araque A. Properties of synaptically evoked astrocyte calcium signal reveal synaptic information processing by astrocytes. J Neurosci. 2005;25:2192–2203. doi: 10.1523/JNEUROSCI.3965-04.2005. [DOI] [PMC free article] [PubMed] [Google Scholar]
- Perea G, Araque A. Astrocytes potentiate transmitter release at single hippocampal synapses. Science. 2007;317:1083–1086. doi: 10.1126/science.1144640. [DOI] [PubMed] [Google Scholar]
- Perea G, Navarrete M, Araque A. Tripartite synapses: astrocytes process and control synaptic information. Trends Neurosci. 2009;32:421–431. doi: 10.1016/j.tins.2009.05.001. [DOI] [PubMed] [Google Scholar]
- Piet R, Jahr CE. Glutamatergic and purinergic receptor-mediated calcium transients in Bergmann glial cells. J Neurosci. 2007;27:4027–4035. doi: 10.1523/JNEUROSCI.0462-07.2007. [DOI] [PMC free article] [PubMed] [Google Scholar]
- Randle JC, Guet T, Cordi A, Lepagnol JM. Competitive inhibition by NBQX of kainate/AMPA receptor currents and excitatory synaptic potentials: importance of 6-nitro substitution. Eur J Pharmacol. 1992;215:237–244. doi: 10.1016/0014-2999(92)90033-z. [DOI] [PubMed] [Google Scholar]
- Rogers RC, Hermann GE. Mechanisms of action of CCK to activate central vagal afferent terminals. Peptides. 2008;29:1716–1725. doi: 10.1016/j.peptides.2008.06.023. [DOI] [PMC free article] [PubMed] [Google Scholar]
- Rogers RC, Nasse JS, Hermann GE. Live-cell imaging methods for the study of vagal afferents within the nucleus of the solitary tract. J Neurosci Methods. 2006;150:47–58. doi: 10.1016/j.jneumeth.2005.05.020. [DOI] [PubMed] [Google Scholar]
- Sharma G, Vijayaraghavan S. Nicotinic cholinergic signaling in hippocampal astrocytes involves calcium-induced calcium release from intracellular stores. Proc Natl Acad Sci U S A. 2001;98:4148–4153. doi: 10.1073/pnas.071540198. [DOI] [PMC free article] [PubMed] [Google Scholar]
- Shigetomi E, Bowser DN, Sofroniew MV, Khakh BS. Two forms of astrocyte calcium excitability have distinct effects on NMDA receptor-mediated slow inward currents in pyramidal neurons. J Neurosci. 2008;28:6659–6663. doi: 10.1523/JNEUROSCI.1717-08.2008. [DOI] [PMC free article] [PubMed] [Google Scholar]
- Smith BN, Dou P, Barber WD, Dudek FE. Vagally evoked synaptic currents in the immature rat nucleus tractus solitarii in an intact in vitro preparation. J Physiol. 1998;512:149–162. doi: 10.1111/j.1469-7793.1998.149bf.x. [DOI] [PMC free article] [PubMed] [Google Scholar]
- Thastrup O, Cullen PJ, Drøbak BK, Hanley MR, Dawson AP. Thapsigargin, a tumor promoter, discharges intracellular Ca2+ stores by specific inhibition of the endoplasmic reticulum Ca2+-ATPase. Proc Natl Acad Sci U S A. 1990;87:2466–2470. doi: 10.1073/pnas.87.7.2466. [DOI] [PMC free article] [PubMed] [Google Scholar]
- Theodosis DT. Oxytocin-secreting neurons: a physiological model of morphological neuronal and glial plasticity in the adult hypothalamus. Front Neuroendocrinol. 2002;23:101–135. doi: 10.1006/frne.2001.0226. [DOI] [PubMed] [Google Scholar]
- Utz AL, Verdoorn TA. Recombinant AMPA receptors with low Ca2+ permeability increase intracellular Ca2+ in HEK 293 cells. NeuroReport. 1997;8:1975–1980. doi: 10.1097/00001756-199705260-00036. [DOI] [PubMed] [Google Scholar]
- Wang DD, Bordey A. The astrocyte odyssey. Prog Neurobiol. 2008;86:342–367. doi: 10.1016/j.pneurobio.2008.09.015. [DOI] [PMC free article] [PubMed] [Google Scholar]
- Washburn MS, Dingledine R. Block of alpha-amino-3-hydroxy-5-methyl-4-isoxazolepropionic acid (AMPA) receptors by polyamines and polyamine toxins. J Pharmacol Exp Ther. 1996;278:669–678. [PubMed] [Google Scholar]
- Wilkin GP, Marriott DR, Cholewinski AJ. Astrocyte heterogeneity. Trends Neurosci. 1990;13:43–46. doi: 10.1016/0166-2236(90)90065-i. [DOI] [PubMed] [Google Scholar]
- Young RL, Page AJ, O'Donnell TA, Cooper NJ, Blackshaw LA. Peripheral versus central modulation of gastric vagal pathways by metabotropic glutamate receptor 5. Am J Physiol Gastrointest Liver Physiol. 2007;292:G501–G511. doi: 10.1152/ajpgi.00353.2006. [DOI] [PubMed] [Google Scholar]
- Zhang JM, Wang HK, Ye CQ, Ge W, Chen Y, Jiang ZL, Wu CP, Poo MM, Duan S. ATP released by astrocytes mediates glutamatergic activity-dependent heterosynaptic suppression. Neuron. 2003;40:971–982. doi: 10.1016/s0896-6273(03)00717-7. [DOI] [PubMed] [Google Scholar]
- Zhang Q, Haydon PG. Roles for gliotransmission in the nervous system. J Neural Transm. 2005;112:121–125. doi: 10.1007/s00702-004-0119-x. [DOI] [PubMed] [Google Scholar]
- Zhou M, Kimelberg HK. Freshly isolated astrocytes from rat hippocampus show two distinct current patterns and different [K+]o uptake capabilities. J Neurophysiol. 2000;84:2746–2757. doi: 10.1152/jn.2000.84.6.2746. [DOI] [PubMed] [Google Scholar]
- Zhou M, Kimelberg HK. Freshly isolated hippocampal CA1 astrocytes comprise two populations differing in glutamate transporter and AMPA receptor expression. J Neurosci. 2001;21:7901–7908. doi: 10.1523/JNEUROSCI.21-20-07901.2001. [DOI] [PMC free article] [PubMed] [Google Scholar]