

Abstract
Magnetic resonance imaging (MRI) techniques, such as magnetic resonance microscopy (MRM), diffusion tensor imaging (DTI), and magnetic resonance spectroscopy (MRS), have recently been applied to the study of both normal and abnormal structure and neurochemistry in small animals. Herein, findings from studies in which these methods have been used for the examination of animal models of Fetal Alcohol Spectrum Disorder (FASD) are discussed. Emphasis is placed on results of imaging studies in fetal and postnatal mice that have highlighted the developmental stage dependency of prenatal ethanol exposure-induced CNS defects. Consideration is also given to the promise of methodological advances to allow in vivo studies of aberrant brain and behavior relationships in model animals and to the translational nature of this work.
Keywords: Alcohol, prenatal, FASD, mouse, MRI, DTI, MRS
Introduction
Studies employing animal models of prenatal alcohol (ethanol) exposure have been key to defining how factors such as dosage, timing and pattern of consumption influence the range of ethanol-induced functionalal and central nervous system (CNS) outcomes and to elucidating ethanol's teratogenic mechanisms (reviewed by Goodlett et al., 2005; reviewed by Cudd et al., 2005). Additionally, the establishment of fetal alcohol spectrum disorder (FASD) animal models has provided the foundation needed for testing the effectiveness of agents that may reduce ethanol-mediated birth defects (e.g. Ryan et al., 2008; Thomas et al., 2000; 2004; 2007; 2009; 2010; Parnell et al., 2007; Serrano et al., 2010; reviewed by Hannigan et al., 2007; Sari & Gozez, 2006; Klintsova et al., 2000).
FASD researchers have used many different model species, including zebrafish (e.g. Bilotta et al., 2004), chicks (e.g. Marshall et al., 2009), guinea pigs (e.g. Green et al, 2005), sheep (e.g. Ramadoss et al., 2007; Littner et al., 2008), non-human primates (e.g. Schneider et al., 2001; 2002; Papia et al., 2010), and rodents (eg. Chernoff, 1977; Light et al., 1998; Sherwin et al., 1979; West 1993). Of these, rodents have been most commonly employed (reviewed by Cudd et al., 2005). This is in part, because of their short gestational period, relatively low cost, and well-characterized behavior and physiology. Mice have been particularly useful for defining the stage-dependent teratogenic effects of ethanol (e.g. Webster et al., 1983, reviewed by Sulik, 2005). As further described below, this is exemplified by the studies of Sulik and her colleagues that have focused on discrete stages of embryonic development (e.g. Godin et al., 2010; O'Leary-Moore et al., 2010; Parnell et al., 2009; Sulik et al., 1981; Sulik & Johnson, 1982).
As early as 1981, Sulik et al. demonstrated that ethanol treatment limited to just the 7th day of pregnancy in mice results in facial dysmorphology in the offspring that is consistent with that in fetal alcohol syndrome (FAS) (see figure 1; Sulik et al., 1981). As shown in figure 1, this includes microcephaly, an elongated upper lip, a deficient philtrum, a small nose and short palpebral fissures. Gestational day (GD) 7 mouse embryos are at a stage in development that is equivalent to that occurring early in the third week of human pregnancy; a time when many women might not recognize that they are pregnant. It is at this early stage of embryogenesis that gastrulation begins and the formation of the neural plate is initiated. That exposure to ethanol during early gastrulation induces a spectrum of dysmorphology most notably affecting the median aspects of the developing face and forebrain, including holoprosencephaly (HPE) at the severe end of the spectrum, is now well-established (reviewed by Lipinski et al., 2010; Higashiyama et al., 2007; Schambra et al., 1990; Stockard, 1910; Sulik & Johnson, 1982; Sulik et al., 1984; Webster et al., 1983).
Figure 1.

Shown in (a) is a child with the characteristic facial features of FAS. These features include microcephaly, small palpebral fissures, small nose, an indistinct philtrum and a thin vermillion border. In (b), a mouse fetus that had been exposed to ethanol on gestational day 7 shows similar features to the child with FAS. For comparison, a normal mouse fetus is pictured in c. Modified with permission from KK Sulik et al. Fetal alcohol syndrome: embryogenesis in a mouse model. Science 214:936–938, Copyright © 1981 American Association for the Advancement of Science; and KK Sulik, Genesis of Alcohol-Induced Craniofacial Dysmorphism Exp Biol Med, 230(6):366-375, Copyright © 2005 The Royal Society of Medicine Press.
HPE is now recognized to be the most prevalent human birth defect occurring in as many as 1/250 conceptuses (Matsunaga & Shiota 1977). With most HPE-affected conceptuses being lost prior to birth, this condition is reported in approximately 1/10,000 live births (Croen et al., 1996; Leoncini et al., 2008; Shiota et al., 2007). HPE is known to result from a variety of genetic abnormalities, as well as several different environmental factors. Among the latter is ethanol, as evidenced in mice as described above, humans (Majewski, 1981; Peiffer et al., 1979), and non-human primates (Astley et al., 1999; Siebert et al., 1991). Anomalies consistent with those in the HPE spectrum are shown in figure 2. Illustrated are ethanol-exposed mouse embryos with varying degrees of median tissue loss involving both the face and brain (Sulik et al., 1984). This tissue deficiency is reflected in the abnormally close proximity of the nostrils and loss of portions of the medial nasal prominences, accompanied by closely approximated ganglionic eminences and a reduction in the size of the septal region of the forebrain (figure 2). Other notable forebrain abnormalities following GD7 ethanol exposure in this model include hypoplasia or agenesis of the corpus callosum, as well as deficiencies in the basal ganglia, hippocampus and anterior cingulate cortex (Sulik & Johnston, 1982; Schambra et al., 1990; Sulik et al., 1984).
Figure 2.

The face and brain of a normal gestational day (GD) 11 mouse embryo (a, b), as compared to the faces and the brains of two ethanol-exposed embryos (c d; e f ), illustrate the range of defects induced by GD7 ethanol insult. In the ethanol-exposed embryos, loss of midline tissue is notable. Abnormally close apposition of the nostrils (circles) and absence of portions of the medial nasal prominences (m) can be seen in the faces of the ethanol-affected embryos. Similar abnormal proximity of the ganglionic eminences (arrows) can be appreciated (d, f), as can reduction and absence of the septal region (s; d, f). Modified with permission from Sulik KK, Lauder JM, Dehart DB. Brain malformations in prenatal mice following acute maternal ethanol administration. Int J Dev Neurosci 2:203–214, Copyright © 1984 Elsevier and Sulik, Genesis of Alcohol-Induced Craniofacial Dysmorphism Exp Biol Med, 230(6):366-375, Copyright © 2005 The Royal Society of Medicine Press.
Recently, a number of studies utilizing state-of the art neuroimaging techniques to further characterize brain anomalies associated with prenatal alcohol exposure in rodents have been conducted. As reviewed herein, magnetic resonance imaging (MRI) and diffusion tensor imaging (DTI) have been used to show stage-dependent alterations in brain structure. In addition, magnetic resonance spectroscopy (MRS) studies have shown alterations in neurochemistry following perinatal ethanol exposure. The results of this work have both confirmed and extended previous observations. Clearly these animal-based studies have significant translational potential, particularly regarding guidance of ongoing neuroimaging investigations of individuals with FASD.
Magnetic Resonance Microscopy
Background
MRI is an imaging technique that provides a window into the anatomy of a developing animal (reviewed by Driehuys et al., 2008). Aided by the development of high field strength magnets (7 Tesla and above), custom coils, and the use of agents to enhance tissue contrast, the assessment of specimens using MRI at very high resolution (approaching 10 microns) is now possible. This high resolution imaging is referred to as magnetic resonance microscopy (MRM) (Driehuys et al., 2008; Petiet et al., 2007; Turnbull and Mori, 2007). MRM is distinguished from more routine MRI by the spatial resolution of the scans (~1mm3 for MRI vs. < 100 microns for MRM), by the diameter of the bore of the magnet (~5 cm) limiting the size of the specimens that can be imaged, and by the amount of scanning time needed. MRI can typically be completed within minutes when used for routine clinical assessments. Until recently, MRM has required several hours of scanning time for a single specimen, a factor that has limited its application to fixed tissue and to studies employing relatively small numbers of samples. Technological advances now provide for 21-43 micron isotropic resolution with scanning time in the order of 30-120 minutes per specimen. This speaks to MRM's potential as a high-throughput analysis technique (eg. Johnson et al, 2007).
Recently, MRM has been successfully used to study the development of both prenatal and postnatal animals and 3-dimensional atlases of mouse brain development are now published (e.g. Chuang et al., 2011; Dhenain et al., 2001; Ma, Hof, et al., 2005, 2008; Petiet et al., 2008). As shown in figure 3, MRM allows the imaging of embryos as young as 10.5 days postfertilization (Petiet et al., 2008) and offers distinct advantages over traditional histological techniques, including the ability to view the images in all three planes simultaneously to assess morphology. From individual MRM scans, specific anatomical regions can be segmented, i.e. parcellated either automatically or manually, using imaging analysis software such as ITK-SNAP (Yushkevich et al.,2006) This allows accurate 3D reconstruction (figure 4). While there has been an emphasis on MRM-based assessment of the developing CNS, similar analyses of other organs such as the heart and kidneys (e.g., Petiet et al., 2008; Badea et al., 2006) and of specific regions such as the face are also possible.
Figure 3.

Detailed examination of prenatal development in the mouse beginning at GD10.5 through GD19.5 is possible utilizing high-resolution MRM. Modified with permission from AE Petiet, et al., High-resolution magnetic resonance histology of the embryonic and neonatal mouse: a 4D atlas and morphologic database, Proc Natl Acad Sci U S A. 105(34):12331-12336, 2008; Copyright © 2008, National Academy of Sciences, U.S.A.
Figure 4.

MRM scans of GD17 fetuses allow for assessment of the brain in three planes simultaneously (a, sagittal; b, coronal; c, horizontal) and for the creation of three-dimensional reconstructions (d). Color-coded regions illustrate brain areas that were manually segmented for volumetric analyses. In d, the upper right portion of the brain image was removed to allow for visualization of the interior structures. From SK O'Leary-Moore et al., 2010, Magnetic resonance microscopy-based analyses of the brains of normal and ethanol-exposed fetal mice, Birth Defects Research Part A: Clinical and Molecular Teratology; Copyright © John Wiley & Sons, Inc.; modified from Parnell et al. 2009 & Godin et al. 2010.
In order to characterize the stage-dependent effects of prenatal ethanol exposure on the fetal brain more fully, Sulik and colleagues have recently initiated MRM-based analyses of fetal and postnatal mice (Godin et al., 2010; O'Leary-Moore et al., 2010; Parnell et al., 2009). In their studies, timed pregnant dams were treated with high doses of ethanol on single early gestational days. Typically, treatment has entailed twice daily intraperitoneal injections of 2.8-2.9 g/kg ethanol administered 4 hours apart on either GD 7, 8, 9, 10 or 11. This treatment results in blood ethanol concentrations approaching 350-420 mg/dl and models acute high ethanol intake as occurs in an individual who is alcohol dependent. Because ethanol-induced deficits at the severe end of the spectrum are often not compatible with postnatal viability, many of the initial studies have focused on late fetal stages, i.e. GD17. To date, GD17 brain dysmorphology resulting from acute high dose ethanol exposure on GD 7, 8, and 10 has been characterized (Godin et al., 2010; O'Leary-Moore et al., 2010; Parnell et al., 2009). Additionally, to ascertain the normal developmental trajectory at the time of interest, the brains of GD 16, 16.5 and 17 fetuses have been assessed. As shown in figure 5, and as determined from volumetric analyses, during this period in mice an increase in overall brain size (38% increase in volume) is accompanied by a relative decrease in the size of the ventricles. Because prenatal exposure to ethanol is known to result in generalized growth retardation, recognition of these normal time-dependent changes is particularly important as it provides for identification of appropriate control groups.
Figure 5.

Three dimensional brain and ventricular reconstructions from control GD16, GD16.5, and GD17 mouse fetuses are illustrated. Dorsal (a, e, i) and lateral (b, f, j) aspects of the brain are shown, as are dorsal ventricular (c, g, k) and lateral third/fourth & mesencephalic ventricular (d, h, l) reconstructions. The increase in brain volume during development is apparent and the changing morphology of the olfactory bulbs is particularly evident. In contrast, the relative size of the ventricles to total brain volume actually decrease with age (c, d, g, h, k, l). Alterations are particularly pronounced in the lateral magnetic resonance microscopy reconstructions of the third, mesencephalic and fourth ventricle reconstructions (d, h, l). Specifically, the dorsal part of the third ventricle (arrow in d) is wider and gets progressively smaller with age. From O'Leary-Moore et al., Magnetic resonance microscopy-based analyses of the brains of normal and ethanol-exposed fetal mice, Birth Defects Research Part A: Clinical and Molecular Teratology; Copyright © 2010 John Wiley & Sons, Inc
Qualitative analyses of acute early ethanol exposure-induced brain and facial defects in mice
Consistent with earlier studies described above (Sulik & Johnston, 1982; Sulik et al., 1984), MRM scans and subsequent 3D reconstructions of the brains as well as of the faces of fetal mice have illustrated that acute GD7 ethanol exposure results in a spectrum of facial and CNS effects that commonly includes HPE in the most severely affected fetuses (Godin et al., 2010). As shown in figure 6, affected fetuses having varying degrees of median facial anomalies typically also present with forebrain deficiencies. The facial abnormalities range from a slight narrowing of the nose (i.e. nostrils that are somewhat closely approximated) and an upper lip that has a slightly diminished central notch, to extreme narrowing of the snout and absence of the nostrils. The lower jaw is also commonly involved and often appears narrow and short as compared to controls. In general, the brains of animals with the more severe facial dysmorphia are more affected. In mildly affected ethanol-exposed fetuses, the overall form of the brain appears fairly normal, though the olfactory bulbs appear smaller and the space between the cerebral hemispheres is somewhat narrow as compared to controls. As the severity of teratogenesis increases, the olfactory bulbs may be absent, accompanied by cerebral hemispheres that are united across the midline. In severely affected specimens the cerebral tissue can be quite minimal, while the more caudal aspects of the brain appear relatively normal. In addition to these defects, GD7 ethanol exposure-induced abnormalities identified with MRM include cleft palate, aglossia, pituitary dysgenesis, aqueductal stenosis, and eye anomalies ranging from slight microphthalmia to bilateral anophthalmia (Godin et al., 2010).
Figure 6.

Illustrated are a spectrum of facial and brain anomalies that result from GD7 ethanol exposure. As compared to the control (a), those animals exposed to ethanol prenatally (b-e) show varying degrees of facial dysmorphology characterized by an elongated upper lip with a diminished philtral region, closely spaced nostrils, and a small mandible. Brain anomalies also fall along a spectrum of effect and are shown from least to most severe in MRI-based 3D reconstructions. Note that in the animal with the most subtle facial dysmorphology (b), the brain (g), appears to be relatively normal. In the animals where facial dysmorphology is more pronounced, the brains are more affected (h, i), and have malformations consistent with holoprosencephaly. The animal whose brain depicted in (j), is missing most of its telencephalon and has a severe facial phenotype, with only one nostril and no lower jaw (e). Pink: olfactory bulbs, Red: cerebral cortex, lime green: diencephalon, magenta: midbrain, blue: cerebellum, light blue: mesencephalic/ 4th ventricle, green: hindbrain.
The ability to accurately reconstruct the MRM scans of the face and brain of individual specimens allows correlative analyses with outcomes that should be indicative of the value of facial dysmorphology assessments in affected children to predict the involvement of the brain. That useful translational data will be forthcoming from these studies is supported by the fact that sophisticated 3D shape analysis and dense surface modeling has been applied to identification of human craniofacial changes in autism (Hammond et al., 2008) and in a variety of genetic conditions (e.g. Hammond et al., 2005). These shape analysis techniques have also recently been applied in an FASD study and have identified facial asymmetry in some affected individuals (Klingenberg et al., 2010). Other recently reported human morphometric and 3D analysis data regarding abnormalities in the shape of the face have provided for the classification of children with FAS (e.g. Mutsvangwa & Douglas, 2007; Mutsvangwa et al., 2010). Facial morphometric techniques have also been applied to a mouse model to define strain-dependent ethanol-induced alterations with results indicating deficiencies in facial depth measures following GD7 exposure (Anthony et al., 2010), a finding that is consistent with the “flattened midface” associated with FAS (Moore et al., 2007). Additionally, recent work by Sowell and colleagues (Roussotte et al, in press) describes face/forebrain correlations that are consistent with patterns of face and forebrain deficits that result from GD7 ethanol exposure in the mouse (Godin et al, 2010). Recognizing that acute ethanol exposure at times other than GD7 does not result in the HPE-related facial phenotype and that later exposure times yield different patterns of facial and brain anomalies in the mouse (Sulik et al., 1986; Kotch & Sulik, 1992), it will be of interest to include discrete exposure times as a critical variable in face/brain correlation outcomes. The results of such studies hold particular promise in informing clinical FASD investigations and diagnoses.
Importantly, in addition to being useful in demonstrating severe dysmorphology resulting from ethanol exposure-induced teratogenesis, MRM has facilitated the discovery of subtle brain defects in mice. These could easily have been missed with conventional histological techniques. As shown in figure 7, 3D reconstructions of the brains of fetuses that had been exposed to ethanol on GD7 revealed cerebro-cortical surface irregularities that have been confirmed as leptomeningial heterotopias (Godin et al., 2010). Recognition that such early ethanol exposure can result in heterotopias is of considerable clinical significance. Errors in cell migration, the basis for heterotopia formation, have been implicated in seizures. Recent clinical reports have revealed heightened rates of both seizures and epilepsy among individuals with FASD (Bell et al., 2010; Sun et al., 2009), with first trimester ethanol exposure being most commonly involved (Bell et al., 2010). A recent case report of an individual with FAS described seizure activity and the detection of polymicrogyria with MRI (Reinhardt et al., 2010). Interestingly, ethanol exposure on GD10 in the mouse also resulted in heterotopic tissue formation. However, rather than being localized to the cortex, the heterotopia extended into the third ventricular space (O'Leary-Moore et al., 2010).
Figure 7.

A 3D brain reconstruction (a), coronal MRI scan (b) and a histological section (c) illustrate the presence of cortical heterotopias resulting from GD7 ethanol exposure in a mouse fetus and demonstrate the utility of MRM in identifying such malformations. Modified with permission from EA Godin et al., Magnetic resonance microscopy defines ethanol-induced brain abnormalities in prenatal mice: effects of acute insult on gestational day 7. Alcoholism: Clinical and Experimental Research, 34(1), 98-111. Copyright © 2010 John Wiley & Sons, Inc.
While MRM-based studies of acute GD8 ethanol exposure-induced defects have identified neither HPE nor heterotopia formation, other morphological changes involving the brain, eyes and facial structures have been found (Parnell et al., 2009; O'Leary-Moore et al., 2010). Included are optic nerve coloboma, choanal atresia, narrowing of the cerebral aqueduct, and third ventricle enlargement (Parnell et al., 2009). Third ventricular dilation has also been noted in MRM scans of fetuses that had been exposed to ethanol on GD10 (O'Leary-Moore et al., 2010). 3D reconstructions of the ventricular system of these specimens are illustrated in figure 8. These results suggest that the tissue surrounding the third ventricle, including the thalamus and hypothalamus are deficient (O'Leary-Moore et al., 2010) and studies to examine this possibility are currently underway.
Figure 8.

3D reconstructions of the third and mesencephalic/4th ventricles of a control (a) and 6 GD10 ethanol-exposed mouse fetuses (b-g). Third ventricular dilation is evident in all subjects particularly in regions surrounded by the thalamus (arrow) and hypothalamus (arrowhead). Enlargement of the mesencephalic ventricle was also apparent (dashed arrow, G). From O'Leary-Moore et al., in press, Magnetic resonance microscopy-based analyses of the brains of normal and ethanol-exposed fetal mice, Birth Defects Research Part A: Clinical and Molecular Teratology; Copyright 2010 © John Wiley & Sons, Inc
Quantitative analyses of acute early ethanol exposure-induced brain defects in mice
One of the major advantages of MRM is that it allows regional brain segmentation and subsequent characterization of region-specific alterations including volumetric changes. Indeed, volumetric changes have been reported in human FASD imaging-based brain studies (Norman et al., 2009; Spadoni et al., 2007; Riley et al., 2004). Among these findings are volume deficits in various cortical (e.g. Archibald et al., 2001; Sowell, Thompson, et al., 2001; 2002; Bjorkquist et al., 2010) and subcortical structures (Mattson et al., 1992; 1994; 1996; Cortese et al., 2006), and the cerebellum (Sowell et al., 1996; O'Hare et al., 2005), along with alterations in cortical thickness (e.g. Sowell, Mattson, et al., 2008) and changes in the shape and size of the corpus callosum (e.g. Bookstein, Streissguth et al., 2002; Sowell et al., 2001). In the acute early gestational exposure mouse model, expected volume reduction in telencephalic structures accompanied by increased lateral ventricular volume was apparent in holoprosencephalic fetuses that had been exposed to ethanol on GD7. As previously noted, in these fetuses there is relative sparing of mesencephalic and rhombencephalic brain regions (Godin et al., 2010). Among less severely affected fetuses (those without apparent facial dysmorphology) from this exposure time, larger third ventricle volumes were found (Godin et al., 2010). Acute GD8 ethanol exposure caused disproportionate reductions in the volume of the olfactory bulbs, hippocampus and cerebellum while the septal region and pituitary volumes were disproportionally increased (Parnell et al., 2009). A global effect on total brain volume was found following GD10 ethanol exposure. In order to distinguish a global developmental delay from true ethanol-induced dysmorphology, ethanol-exposed subjects were compared to developmental stage-matched controls that were chronologically half a day younger. As compared to these morphologically matched controls, third ventricular volume enlargement was particularly evident; a finding consistent with visual inspection of the 3D third ventricle renderings (figure 8; O'Leary-Moore et al., 2010).
Linear measurements are also readily ascertained from MRM scans of fetal mouse brains and provide data that can be easily compared to that from human fetal ultrasounds (figure 9). Comparable findings from human fetuses (Kfir et al., 2009) and from fetal mice following GD7 ethanol exposure (Godin et al., 2010) include reductions in frontothalamic distances and biparietal diameter. Linear measurements from fetuses that had been exposed to ethanol on GD8 revealed reduction in the transverse cerebellar diameter and both GD8 and GD10 ethanol exposure preferentially increased third ventricular width (Parnell et al., 2009; O'Leary-Moore et al., 2010). The translational value of this type of quantitative analysis is evident with respect to potential FASD prenatal diagnosis.
Figure 9.

Brain linear measurements are readily ascertained from ultrasound images of the human fetus (a-c, represented in d-f) and from MRM images of the fetal mouse brain (g-i), highlighting the potential for translational FASD studies. TCD – transverse cerebellar diameter, OFD – orbitalfrontal distance, CCD – caval calvarial distance, FTD – frontothalamic distance, OOD – outer ocular diameter, IOD – inner ocular diameter. Reprinted with permission from Kfir et al., Can prenatal ultrasound detect the effects of in utero alcohol exposure? A pilot study. Ultrasound Obstet Gynecol, 33(6) 683-9, Copyright © 2009, ISUOG, Published by Wiley & Sons, Ltd.
Persistence of ethanol-induced brain dysmorphology
Both structural and functional studies assessing the impact of prenatal ethanol exposure on the adolescent and adult mouse have commenced. Consistent with data from fetal mice, a spectrum of ethanol-induced effects has been found in adolescent animals. As in prenatal specimens following GD7 ethanol exposure, HPE occurs. However, the viability of these severely affected animals is diminished so only a few adolescents or adults have been studied (Sulik, 2005). Additionally, hydrocephalus, a condition in which there is excessive accumulation of CSF in the ventricles causing the cortical tissue to thin and the skull to enlarge, has been recognized around the time of weaning among several GD7 ethanol-exposed animals (unpublished observations). MRM-based 3D reconstructions of the ventricles have shown marked narrowing of the isthmus of the cerebral aqueduct in some ethanol-exposed fetuses (Godin et al., 2010). This condition; i.e. aqueductal stenosis, is expected to play a significant role in the genesis of the hydrocephalic condition. Among the more subtle brain defects observed via MRM in postnatal animals are dilated ventricles in the absence of macrocephaly, abnormal striatum and hippocampi, and partial agenesis of the corpus callosum, all of which follow GD7 ethanol insult (figure 10). These findings are very similar to those in individuals with FASD (reviewed by Norman et al., 2009).
Figure 10.

Horizontal, midsagittal and coronal sections from MRI scans of a control (a–c) and a GD7 ethanol-exposed (d-f) adolescent male mouse illustrate significant brain anomalies that result from prenatal ethanol insult. As compared to the control (a), significantly enlarged lateral ventricles (black dashed arrow in d) and an abnormally shaped fornix (dashed white arrow) are apparent. The striatum and corpus callosum appear to be reduced in size after GD 7 ethanol exposure (d, stars and black arrow, respectively). Anomalies in the corpus callosum are especially apparent, where the middle part (body), is absent (e). Sections in the coronal plane also show dilation of the lateral ventricles (dashed arrow in f), as well as an abnormal corpus callosum (black arrow in d) and dysmorphic hippocampi (white arrow in d) in the ethanol-exposed subject as compared to the control subject (c). Modified from O'Leary-Moore et al., in press, Magnetic Resonance-Based Studies of Fetal Alcohol Spectrum Disorder in Animal Models. Alcohol Research & Health. National Institute of Alcohol Abuse and Alcoholism (NIAAA).
Diffusion tensor imaging
Background
Diffusion tensor imaging (DTI), as reviewed by others and Wozniak in this volume, is based on the diffusion properties of water and allows the assessment of the integrity of fiber tracts, even in the absence of gross dysmorphology (Chanraud et al., 2010; Wozniak & Muetzel, 2011). The application of DTI to the study of FASD has provided a plethora of information regarding various white matter regions of the brain that are particularly susceptible to ethanol teratogenesis. To date, a major human DTI focus has involved measures of Fractional Anisotropy (FA) and Mean Diffusivity (MD) to characterize ethanol-induced abnormalities of the corpus callosum (Ma, Coles et al., 2005; Sowell, Johnson et al., 2008; Fryer et al., 2009; Li et al., 2009, Wozniak et al., 2006; 2009; Lebel et al., 2008; 2010).
DTI is particularly effective for studies of brain development in both humans (Huppi & Dubois, 2006; Huang et al., 2006) and animals (Chahbourne et al., 2007; Chuang et al., 2011; Mori & Zhang, 2006; Zhang et al. 2006;). As opposed to traditional imaging techniques, high-resolution DTI scans in the developing mouse brain provide superb contrast, allowing visualization of fiber tracts even in regions of the brain where myelination has not yet begun (e.g. Zhang et al., 2003; 2006). From DTI data, specialized data analysis software such as DTIStudio (Jiang et al, 2006) and Slicer3 (Pieper et al, 2004; 2006) can be used to create color-coded anisotropy maps in which differing fiber orientations are represented by color-codes and in which the intensity of the signal represents the degree of diffusion anisotropy (i.e. FA; reviewed by Wozniak in this edition). As shown in figure 11, Zhang and colleagues (2003) applied DTI to the study of mouse prenatal brain development and the resulting images provide remarkable detail regarding the location and preferential direction of fiber tracts and cortical layers. In the DTI images from this study, various neuroepithelial layers including the cortical plate and intermediate zone, as well as the major fiber tracts are visible as early as GD12 in mice (see figure 11).
Figure 11.

Diffusion tensor imaging illustrates normal brain development during the prenatal period. In embryos as young as 12 days post-fertilization, cellular orientation in the neuroepithelium (NE) can be appreciated (A, blue arrowhead), and 24 hours later, the cortical plate (CP, pink arrowhead) and intermediate zone (IZ, yellow dot) can be distinguished. As development progresses, the cortical plate extends from its original lateral location, rostrally and towards the midline, where neurons are oriented perpendicular to the surface of the brain. The intermediate zone is also developing at this time, with its cellular orientation parallel to the surface of the brain as seen in A. The development of these layers can also be appreciated in the schematic depicted in the box in B. Also shows in B are developmental changes in the thickness of the cortical plate from embryonic day 8 through GD18. Commissural fibers, as shown in C, are readily appreciated by GD17 and include the optic chiasm (white arrowhead), hippocampal commissure (yellow arrowhead), anterior commissure (pink) and corpus callosum (blue arrowhead). Reprinted with permission from J. Zhang et al., Three-dimensional anatomical characterization of the developing mouse brain by diffusion tensor microimaging, NeuroImage, 20(3), 1639-1648. Copyright © 2003, Elsevier.
DTI-based studies of ethanol teratogenesis in a mouse model have recently been initiated. As shown in figure 12, non-diffusion weighted and color-coded anisotropy maps allow visualization of both normal and aberrant morphology of major fiber tracts in the fetal mouse brain. Consistent with MRM-based analyses, prenatal ethanol exposure on GD7 induces anomalies apparent with DTI that are within the HPE spectrum. Exemplary are differences in non-diffusion weighted images of a control mouse fetus where the septal region, olfactory bulbs, and distinct striatal regions and lateral ventricles can be appreciated, and of an ethanol-exposed animal in which the cerebral cortices are joined at the midline, the septal region and olfactory bulbs are absent, the striata are too closely approximated, and a single telencephalic ventricle is present. Color-coded anisotropy maps, which indicate the preferential orientation of diffusion, clearly show fiber tract anomalies in ethanol-affected fetal mice. Notable defects in the fetus shown in figure 12 involve the internal and external capsule, as well as the fimbria/fornix. Additionally, abnormal fibers projecting across the midline (as indicated by their red color-encoding) rostral to the thalamic region (figure 12 f), as well as abnormal fibers projecting in the superior/inferior direction (as indicated by their blue color-encoding) in the midline of the brain are present (figure 12 h). As opposed to traditional histological techniques where only the presence of the abnormal fibers can be confirmed, DTI provides information regarding the preferential orientation of these aberrant fibers.
Figure 12.

Non-diffusion weighted images and color-coded fractional anisotropy (FA) maps illustrate normal brain and fiber tract morphology of a control mouse (a-d) and aberrant morphology in a GD7 ethanol-exposed mouse (e-h). As compared to the non-diffusion weighted images of a control mouse (a, c) where the septal region (black arrow), olfactory bulbs (white arrow) and caudate nuclei (stars) appear normal, in the scans of the subject that had been exposed to ethanol (e, g), the olfactory bulbs and septal region are absent and the striatum are too closely approximated. Color-coded FA maps show fiber tract defects resulting from GD7 ethanol exposure (f, h). As compared to the normal appearance of the internal and external capsule in the control (b, yellow and green arrows, respectively), the subject exposed to ethanol prenatally has a significantly thickened internal capsule (yellow arrow) which appears to cross the midline (pink arrow in f). Similarly, the external capsule of the ethanol-exposed fetus also appears to be united across the midline of the brain (green arrows in f).
DTI has proven particularly informative for analysis of GD7-induced ethanol brain defects by illustrating that even in the absence of readily discernable facial abnormalities, fiber tract alterations occur. An example is shown in figure 13 in which a control and an ethanol-exposed subjects’ faces, 3D brain reconstructions and midsagittal sections of the color-coded anisotropy map are readily compared. Despite having a normal appearing face and a brain with two distinctly separate cerebral hemispheres, the corpus callosum of the affected fetus is diminished. Recent studies have been extended to characterize anomalies in the postnatal animal, with an initial emphasis on characterizing anomalies involving the midline. Preliminary data indicate that as compared to a control, in which the corpus callosum can be identified as a broad midline band (figures 14, 15 a), variable degrees of narrowing, particularly in the mid-region are apparent (figure 15 c & e). These findings are consistent with clinical reports of corpus callosum anomalies in humans (Bookstein, Sampson et al., 2002; Sowell, Mattson et al., 2001; Riley et al., 1995; Swayze et al., 1997).
Figure 13.

DTI reveals subtle dysmorphology in a GD 17 fetus following GD7 ethanol exposure. Like the control face (a) and brain (b), those of an ethanol-exposed subject (d, e) appear grossly normal. In the control fetus, color-coded FA maps show a midsagittal section of the brain where the corpus callosum (white arrow), hippocampal commissure (red arrow), fornix columns (orange arrow) and anterior commissure (yellow arrow) are apparent. However, in an ethanol-exposed fetus, the color-coded FA map shows that the corpus callosum of the ethanol-exposed animal (f) appears to be almost completely absent while other fiber tracts appear normal.
Figure 14.

Non-diffusion weighted (a), FA (b), and color-coded FA (c) images illustrate the normal morphology of the adolescent mouse brain in a midsagittal section. In (b), regions with high signal that appear white are white matter regions of the brain. The color-coded FA maps also show regions of white matter and the colors of the different fibers represent the preferential direction of diffusion of the various fibers. Fibers that are red such as the corpus callosum, project in the right/left direction, green fibers project in the anterior/posterior direction and blue fibers project in the inferior/superior direction. Shown in (d) is an enlarged region of the color-coded FA maps emphasizing midline regions of interest. The corpus callosum (CC), ventral and dorsal hippocampal commissures (HC,v and HC,d), anterior commissure (AC), fornix column (F,c) and cingulum (Cing) are readily distinguishable.
Figure 15.

Color-coded FA maps from a control mouse (a) and two GD 7 ethanol exposed mice (c, e) with varying degrees of brain dysmorphology. As compared to the control (a), the mouse in (c), has mild thinning of the corpus callosum in the middle section (star in c) and the mouse brain depicted in e has reduced size of the corpus callosum in the anterior and posterior sections (arrows) and the middle part of the corpus callosum is absent. The hippocampal commissure (yellow arrows) is also reduced in the more severely affected mouse (e). Dysmorphology of the corpus callosum in this mouse model is remarkably similar to that seen in individuals with FAS. As compared to a control individual (b), those with FAS (d, f) also have considerable dysmorphology of the corpus callosum. Human images courtesy of Dr. S. Mattson.
Expanding DTI's potential to inform FASD studies is the ability to develop 3D fiber tract reconstructions as shown in figure 16 (Mori & van Zijl, 2002; Jiang & Johnson, 2010) and as described by Wozniak in this publication. Not only does this technique provide for morphological assessments, it offers the potential for quantitative analyses of various properties of diffusion along the tracts of the reconstructed fibers. Ongoing studies in prenatal and postnatal mice are also employing this technology with preliminary data being most promising.
Figure 16.

Fiber tracking allows 3D reconstruction of major fiber tracts in the adult mouse brain. A lateral (a) and ventral view (b) of fiber tracts from an individual brain are overlaid on anatomical regions of a reference brain. Fiber tracts shown are: corpus callosum (red), cingulum (cyan), anterior commissure (blue), fimbria (white), optic tract (green), and habenular commissure (pink). Anatomical regions illustrated in transparent colors include the olfactory bulbs (light blue), anterior commissure (purple), fimbria (green), hippocampus (yellow), septal nuclei (brown), and cerebral cortex (dark blue). Reprinted with permission from Y. Jiang et al., Microscopic diffusion tensor imaging of the mouse brain, NeuroImage, 50(2), 465-471, Copyright © 2010, Elsevier.
Magnetic Resonance Spectroscopy
MRS is a non-invasive imaging technique that provides biochemical information about localized brain regions (reviewed by Moore & Galloway, 2002; van der Graaf, 2010). It has been widely applied to study brain maturation and disorders involving the CNS (e.g. Kreis et al., 2002; Vigneron 2006; Girard et al., 2006; Choi et al., 2007). MRS probes can be tuned to study a number of different molecular nuclei that are present in our bodies but among the most commonly studied with MRS is the hydrogen nucleus (proton - 1H). 1H MRS allows the quantification of various neurochemicals in the brain, including N-acetyl aspartate (NAA), a marker of neuronal integrity; choline, which is essential for the synthesis of acetylcholine and the cell membrane constituent phosphatidylcholine; and creatine, which is important for maintaining energy-dependent systems within the cell (reviewed by van der Graaf, 2010). With some higher field magnets and specialized pulse sequences, other neurochemicals such as myoinositol, glutamate and GABA can be measured. MRS data are expressed in a spectrum (e.g. see figure 17); the horizontal axis is called the chemical shift and each neurochemical has its own unique location(s). The vertical axis represents the strength of the signal and the area under it is proportional to the number of protons in the sample. MRS has been of interest for FASD research because of its potential to uncover a biomarker of prenatal alcohol exposure and, while results have generally been inconsistent, 1H MRS has been applied to the study of neurochemistry following prenatal ethanol exposure, (Astley et al., 1995; 2009; Cortese et al., 2006; Fagerlund et al., 2006).
Figure 17.
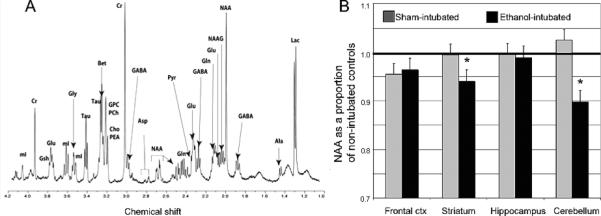
Illustrated in (A) is a representative spectra from an adult male rat striatum. Neurochemicals that can be resolved include (from left to right): mI — myo-inositol, Cre — creatine, GSH —glutathione, Glu — glutamate, Gly — glycine, Tau — taurine, Bet — betaine, GPC — glycerophosphorylcholine, PCh — phosphorylcholine, Cho — choline, PEA —phosphorylethanolamine, GABA — gamma-aminobutyric acid, Asp — aspartate, NAA — N-acetyl-aspartate, Gln — glutamine, Pyr — pyruvate, NAAG — N-acetylaspartyl glutamate,Ala — alanine, Lac — lactate. In (B), region-dependent alterations are shown in levels of NAA. Reprinted with permission from S. O'Leary-Moore et al., Neonatal alcohol-induced regions-dependent changes in rat brain neurochemistry measured by high-resolution magnetic resonance spectroscopy, Alcohol Clin Exp Res, 32(10), 1697-707, Copyright © 2008, Elsevier.
Utilizing an animal model of neonatal ethanol exposure, where ethanol was administered to the offspring early during postnatal life to imitate 3rd trimester exposure in the human, regional brain neurochemistry in developing rats was examined (O'Leary-Moore et al. 2008). Using a specialized MRS technique called high-resolution magic angle spinning (HR-MAS 1H MRS), neurochemical data from intact tissue biopsies was ascertained and quantified. Figure 17 illustrates the appearance of an HR-MAS 1H MRS spectrum as well as the chemicals that are readily quantified using this technique. Following neonatal ethanol exposure, region-specific alterations in a number of neurochemicals were found, with alterations in the cerebellum being most pronounced. This is consistent with the results of previous studies examining alterations in the cerebellum following binge ethanol exposure in the neonatal rat (e.g. Green et al, 2004). For both male and female ethanol-exposed rats, cerebellar levels of NAA and taurine (an antioxidant and inhibitory neuromodulator) were reduced and glutamate levels were lower in females as compared to controls. In addition, cerebellar myo-inositol (a glial marker) levels were elevated. Reductions in striatal NAA and taurine were also apparent following ethanol exposure (O'Leary-Moore et al., 2008). The potential for future studies to characterize neurochemical alterations induced by different periods of exposure, as well as to test the ability of various treatments to reverse these neurochemical effects, is promising.
Conclusions
A number of factors including genetics, maternal age, polydrug exposure, nutritional status, and the dose, timing and pattern of ethanol intake during gestation all interact to produce a range of effects on the developing offspring (e.g. Abel & Hannigan, 1995; Chiodo, et al., 2010; Keen et al., 2010; Warren & Li, 2005). Studies in animal models can control for these factors and have been instrumental in increasing our understanding of the mechanisms underlying ethanol teratogenesis, critical exposure periods, dose-response relationships and the pathology resulting from prenatal ethanol exposure. Regarding the latter, while imaging techniques such as MRI, DTI and MRS have only recently been applied to examination of pathology in FASD animal models, they have greatly facilitated new and important discoveries.
Expected technological imaging advances will undoubtedly facilitate the extension of existing basic FASD studies. Of particular interest will be the application of advanced imaging methods to assessment of potential low dose teratogenic effects, gene-environment interactions, and mitigation of the adverse consequences of ethanol insult. Additionally, in vivo high resolution imaging may become practical; an advance that will afford the ability to correlate prenatal ethanol-induced behavioral and morphological abnormalities in longitudinal studies of single experimental animals.
Acknowledgements
We gratefully acknowledge the contributions of Elizabeth Godin, whose dissertation work includes much of that reviewed herein, as well as the technical assistance of Deborah Dehart. Additionally, we would like to acknowledge the expertise in imaging and image processing provided by G. Allan Johnson and Yi Jiang from the Center for In Vivo Microscopy at Duke University as well as Martin Styner, Ipek Oguz and Francois Budin from Dept of Psychiatry, University of North Carolina at Chapel Hill. We would also like to thank Stephen Pecevich, Jacob Ament and Amber Khan for their expert manual segmentation of mouse MRM scans. This work is supported by National Institutes of Health NIAAA grants AA007573, P60 AA011605, U01 AA017124; NCRR/NCI grants P41 05959 and U24 CA0292656 and NICDH 03110 and was conducted in conjunction with the Collaborative Initiative on Fetal Alcohol Spectrum Disorders (CIFASD). More information about the CIFASD can be found at www.cifasd.org.
Acronyms
- CNS
central nervous system
- DTI
diffusion tensor imaging
- FAS
Fetal Alcohol Syndrome
- FA
fractional anisotropy
- MD
mean diffusivity
- FASD
Fetal Alcohol Spectrum Disorders
- HPE
holoprosencephaly
- HR-MAS MRS
high-resolution magic angle spinning magnetic resonance spectroscopy
- MRI
magnetic resonance imaging
- MRM
magnetic resonance microscopy
- MRS
magnetic resonance spectroscopy
- NAA
n-acetyl aspartate
Footnotes
Disclosure: The authors have no financial relationships to disclose.
References
- Abel EL, Hannigan JH. Maternal risk factors in fetal alcohol syndrome: provocative and permissive influences. Neurotoxicology and Teratology. 1995;17(4):445–462. doi: 10.1016/0892-0362(95)98055-6. [DOI] [PubMed] [Google Scholar]
- Anthony B, Vinci-Booher S, Wetherill L, Ward R, Goodlett C, Zhou FC. Alcohol-induced facial dysmorphology in C57BL/6 mouse models of fetal alcohol spectrum disorder. Alcohol. 2010;44(7-8):659–671. doi: 10.1016/j.alcohol.2010.04.002. [DOI] [PMC free article] [PubMed] [Google Scholar]
- Archibald SL, Fennema-Notestine C, Gamst A, Riley EP, Mattson SN, Jernigan TL. Brain dysmorphology in individuals with severe prenatal alcohol exposure. Developmental Medicine and Child Neurology. 2001;43(3):148–154. [PubMed] [Google Scholar]
- Astley SJ, Magnuson SI, Omnell LM, Clarren SK. Fetal alcohol syndrome: changes in craniofacial form with age, cognition, and timing of ethanol exposure in the macaque. Teratology. 1999;59(3):163–172. doi: 10.1002/(SICI)1096-9926(199903)59:3<163::AID-TERA8>3.0.CO;2-8. [DOI] [PubMed] [Google Scholar]
- Astley SJ, Richards T, Aylward EH, Olson HC, Kerns K, Brooks A, Coggins TE, Davies J, Dorn S, Gendler B, Jirikowic T, Kraegel P, Maravilla K. Magnetic resonance spectroscopy outcomes from a comprehensive magnetic resonance study of children with fetal alcohol spectrum disorders. Magnetic Resonance Imaging. 2009;27(6):760–778. doi: 10.1016/j.mri.2009.01.003. [DOI] [PMC free article] [PubMed] [Google Scholar]
- Astley SJ, Weinberger E, Shaw DW, Richards TL, Clarren SK. Magnetic resonance imaging and spectroscopy in fetal ethanol exposed Macaca nemestrina. Neurotoxicology and Teratology. 1995;17(5):523–530. doi: 10.1016/0892-0362(95)00012-g. [DOI] [PubMed] [Google Scholar]
- Badea CT, Bucholz E, Hedlund LW, Rockman HA, Johnson GA. Imaging methods for morphological and functional phenotyping of the rodent heart. Toxicologic Pathology. 2006;34(1):111–117. doi: 10.1080/01926230500404126. [DOI] [PubMed] [Google Scholar]
- Bell SH, Stade B, Reynolds JN, Rasmussen C, Andrew G, Hwang PA, Carlen PL. The remarkably high prevalence of epilepsy and seizure history in fetal alcohol spectrum disorders. Alcoholism, Clinical and Experimental Research. 2010;34(6):1084–1089. doi: 10.1111/j.1530-0277.2010.01184.x. [DOI] [PubMed] [Google Scholar]
- Bilotta J, Barnett JA, Hancock L, Saszik S. Ethanol exposure alters zebrafish development: a novel model of fetal alcohol syndrome. Neurotoxicolology and Teratology. 2004;26(6):737–743. doi: 10.1016/j.ntt.2004.06.011. [DOI] [PubMed] [Google Scholar]
- Bjorkquist OA, Fryer SL, Reiss AL, Mattson SN, Riley EP. Cingulate gyrus morphology in children and adolescents with fetal alcohol spectrum disorders. Psychiatry Research. 2010;181(2):101–107. doi: 10.1016/j.pscychresns.2009.10.004. [DOI] [PMC free article] [PubMed] [Google Scholar]
- Bookstein FL, Sampson PD, Connor PD, Streissguth AP. Midline corpus callosum is a neuroanatomical focus of fetal alcohol damage. The Anatomical Record. 2002;269(3):162–174. doi: 10.1002/ar.10110. [DOI] [PubMed] [Google Scholar]
- Bookstein FL, Streissguth AP, Sampson PD, Connor PD, Barr HM. Corpus callosum shape and neuropsychological deficits in adult males with heavy fetal alcohol exposure. Neuroimage. 2002;15(1):233–251. doi: 10.1006/nimg.2001.0977. [DOI] [PubMed] [Google Scholar]
- Chahboune H, Ment LR, Stewart WB, Ma X, Rothman DL, Hyder F. Neurodevelopment of C57B/L6 mouse brain assessed by in vivo diffusion tensor imaging. NMR in Biomedicine. 2007;20(3):375–382. doi: 10.1002/nbm.1130. [DOI] [PubMed] [Google Scholar]
- Chanraud S, Zahr N, Sullivan EV, Pfefferbaum A. MR diffusion tensor imaging: a window into white matter integrity of the working brain. Neuropsychology Review. 2010;20(20):209–225. doi: 10.1007/s11065-010-9129-7. [DOI] [PMC free article] [PubMed] [Google Scholar]
- Chernoff GF. The fetal alcohol syndrome in mice: an animal model. Teratology. 1977;15:223–230. doi: 10.1002/tera.1420150303. [DOI] [PubMed] [Google Scholar]
- Chiodo LM, da Costa DE, Hannigan JH, Covington CY, Sokol RJ, Jannise J, Greenwald M, Ager J, Delaney-Black V. The impact of maternal age on the effects of prenatal alcohol exposure on attention. Alcoholism, Clinical and Experimental Research. 2010;34(10):1813–1821. doi: 10.1111/j.1530-0277.2010.01269.x. [DOI] [PMC free article] [PubMed] [Google Scholar]
- Choi JK, Dedeoglu A, Jenkins BG. Application of MRS to mouse models of neurodegenerative illness. NMR in Biomedicine. 2007;20(3):216–237. doi: 10.1002/nbm.1145. [DOI] [PubMed] [Google Scholar]
- Chuang N, Mori S, Yamamoto A, Jiang H, Ye X, Xu X, Richards LJ, Nathans J, Miller MI, Toga AW, Sidman RL, Zhang J. An MRI-based atlas and database of the developing mouse brain. Neuroimage. 2011;54(1):80–89. doi: 10.1016/j.neuroimage.2010.07.043. [DOI] [PMC free article] [PubMed] [Google Scholar]
- Cortese BM, Moore GJ, Bailey BA, Jacobson SW, Delaney-Black V, Hannigan JH. Magnetic resonance and spectroscopic imaging in prenatal alcohol-exposed children: preliminary findings in the caudate nucleus. Neurotoxicolology and Teratology. 2006;28(5):597–606. doi: 10.1016/j.ntt.2006.08.002. [DOI] [PubMed] [Google Scholar]
- Croen LA, Shaw GM, Lammer EJ. Holoprosencephaly: epidemiologic and clinical characteristics of a California population. American Journal of Medical Genetics. 1996;64(3):465–472. doi: 10.1002/(SICI)1096-8628(19960823)64:3<465::AID-AJMG4>3.0.CO;2-O. [DOI] [PubMed] [Google Scholar]
- Cudd TA. Animal model systems for the study of alcohol teratology. Experimental Biology and Medicine, (Maywood) 2005;230(6):389–393. doi: 10.1177/15353702-0323006-06. [DOI] [PubMed] [Google Scholar]
- Dhenain M, Ruffins SW, Jacobs RE. Three-dimensional digital mouse atlas using high-resolution MRI. Developmental Biology. 2001;232(2):458–470. doi: 10.1006/dbio.2001.0189. [DOI] [PubMed] [Google Scholar]
- Driehuys B, Nouls J, Badea A, Bucholz E, Ghaghada K, Petiet A, Hedlund LW. Small animal imaging with magnetic resonance microscopy. ILAR Journal. 2008;49(1):35–53. doi: 10.1093/ilar.49.1.35. [DOI] [PMC free article] [PubMed] [Google Scholar]
- Fagerlund A, Heikkinen S, Autti-Ramo I, Korkman M, Timonen M, Kuusi T, Riley EP, Lundbom N. Brain metabolic alterations in adolescents and young adults with fetal alcohol spectrum disorders. Alcoholism, Clinical and Experimental Research. 2006;30(12):2097–2104. doi: 10.1111/j.1530-0277.2006.00257.x. [DOI] [PubMed] [Google Scholar]
- Fryer SL, Schweinsburg BC, Bjorkquist OA, Frank LR, Mattson SN, Spadoni AD, Riley EP. Characterization of white matter microstructure in fetal alcohol spectrum disorders. Alcoholism, Clinical and Experimental Research. 2009;33(3):514–521. doi: 10.1111/j.1530-0277.2008.00864.x. [DOI] [PMC free article] [PubMed] [Google Scholar]
- Girard N, Fogliarini C, Viola A, Confort-Gouny S, Fur YL, Viout P, Chapon F, Levrier O, Cozzone P. MRS of normal and impaired fetal brain development. European Journal of Radiology. 2006;57(2):217–225. doi: 10.1016/j.ejrad.2005.11.021. [DOI] [PubMed] [Google Scholar]
- Godin EA, O'Leary-Moore SK, Khan AA, Parnell SE, Ament JJ, Dehart DB, Johnson BW, Johnson GA, Styner MA, Sulik KK. Magnetic resonance microscopy defines ethanol-induced brain abnormalities in prenatal mice: effects of acute insult on gestational day 7. Alcoholism, Clinical and Experimental Research. 2010;34(1):98–111. doi: 10.1111/j.1530-0277.2009.01071.x. [DOI] [PMC free article] [PubMed] [Google Scholar]
- Goodlett CR, Horn KH, Zhou FC. Alcohol teratogenesis: mechanisms of damage and strategies for intervention. Experimental Biology and Medicine (Maywood) 2005;230(6):394–406. doi: 10.1177/15353702-0323006-07. [DOI] [PubMed] [Google Scholar]
- Green CR, Kobus SM, Ji Y, Bennett BM, Reynolds JN, Brien JF. Chronic prenatal ethanol exposure increases apoptosis in the hippocampus of the term fetal guinea pig. Neurotoxicology and Teratology. 2005;27(6):871–881. doi: 10.1016/j.ntt.2005.07.006. [DOI] [PubMed] [Google Scholar]
- Green JT. The effects of ethanol on the developing cerebellum and eyeblink classical conditioning. Cerebellum. 2004;3(3):178–187. doi: 10.1080/14734220410017338. [DOI] [PubMed] [Google Scholar]
- Hammond P, Forster-Gibson C, Chudley AE, Allanson JE, Hutton TJ, Farrell SA, McKenzie J, Holden JJ, Lewis ME. Face-brain asymmetry in autism spectrum disorders. Molecular Psychiatry. 2008;13(6):614–623. doi: 10.1038/mp.2008.18. [DOI] [PubMed] [Google Scholar]
- Hammond P, Hutton TJ, Allanson JE, Buxton B, Campbell LE, Clayton-Smith J, Donnai D, Karmiloff-Smith A, Metcalfe K, Murphy KC, Patton M, Pober B, Prescott K, Scambler P, Shaw A, Smith AC, Stevens AF, Temple IK, Hennekam R, Tassabehji M. Discriminating power of localized three-dimensional facial morphology. American Journal of Human Genetics. 2005;77(6):999–1010. doi: 10.1086/498396. [DOI] [PMC free article] [PubMed] [Google Scholar]
- Hannigan JH, O'Leary-Moore SK, Berman RF. Postnatal environmental or experiential amelioration of neurobehavioral effects of perinatal alcohol exposure in rats. Neuroscience and Biobehavioral Reviews. 2007;31(2):202–211. doi: 10.1016/j.neubiorev.2006.06.019. [DOI] [PubMed] [Google Scholar]
- Higashiyama D, Saitsu H, Komada M, Takigawa T, Ishibashi M, Shiota K. Sequential developmental changes in holoprosencephalic mouse embryos exposed to ethanol during the gastrulation period. Birth Defects Research Part A, Clinical and Molecular Teratology. 2007;79(7):513–523. doi: 10.1002/bdra.20367. [DOI] [PubMed] [Google Scholar]
- Huang H, Xue R, Zhang J, Ren T, Richards LJ, Yarowsky P, Miller MI, Mori S. Anatomical characterization of human fetal brain development with diffusion tensor magnetic resonance imaging. J Neurosci. 2009;29:4263–4273. doi: 10.1523/JNEUROSCI.2769-08.2009. [DOI] [PMC free article] [PubMed] [Google Scholar]
- Huang H, Zhang J, Wakana S, Zhang W, Ren T, Richards LJ, Yarowsky P, Donohue P, Graham E, van Zijl PC, Mori S. White and gray matter development in human fetal, newborn and pediatric brains. Neuroimage. 2006;33(1):27–38. doi: 10.1016/j.neuroimage.2006.06.009. [DOI] [PubMed] [Google Scholar]
- Huppi PS, Dubois J. Diffusion tensor imaging of brain development. Seminars in Fetal and Neonatal Medicine. 2006;11(6):489–497. doi: 10.1016/j.siny.2006.07.006. [DOI] [PubMed] [Google Scholar]
- Jiang H, van Zijl PC, Kim J, Pearlson GD, Mori S. DtiStudio: resource program for diffusion tensor computation and fiber bundle tracking. Computer Methods and Programs in Biomedicine. 2006;81(2):106–116. doi: 10.1016/j.cmpb.2005.08.004. [DOI] [PubMed] [Google Scholar]
- Jiang Y, Johnson GA. Microscopic diffusion tensor imaging of the mouse brain. Neuroimage. 2010;50(2):465–471. doi: 10.1016/j.neuroimage.2009.12.057. [DOI] [PMC free article] [PubMed] [Google Scholar]
- Johnson GA, Ali-Sharief A, Badea A, Brandenburg J, Cofer G, Fubara B, Gewalt S, Hedlund LW, Upchurch L. High-throughput morphologic phenotypinc of the mouse brain with magnetic resonance histology. Neuroimage. 2007;37(1):82–89. doi: 10.1016/j.neuroimage.2007.05.013. [DOI] [PMC free article] [PubMed] [Google Scholar]
- Keen CL, Uriu-Adams JY, Skalny A, Grabeklis A, Grabeklis S, Green K, Yevtushok L, Wertelecki WW, Chambers CD. The plausibility of maternal nutritional status being a contributing factor to the risk for fetal alcohol spectrum disorders: the potential influence of zinc status as an example. Biofactors. 2010;36(2):125–135. doi: 10.1002/biof.89. [DOI] [PMC free article] [PubMed] [Google Scholar]
- Kfir M, Yevtushok L, Onishchenko S, Wertelecki W, Bakhireva L, Chambers CD, Jones KL, Hull AD. Can prenatal ultrasound detect the effects of in-utero alcohol exposure? A pilot study. Ultrasound in Obstetrics and Gynecology. 2009;33(6):683–689. doi: 10.1002/uog.6379. [DOI] [PMC free article] [PubMed] [Google Scholar]
- Klingenberg CP, Wetherill L, Rogers J, Moore E, Ward R, Autti-Ramo I, Fagerlund A, Jacobson SW, Robinson LK, Hoyme HE, Mattson SN, Li TK, Riley EP, Foroud T. Prenatal alcohol exposure alters the patterns of facial asymmetry. Alcohol. 2010;44(7-8):649–657. doi: 10.1016/j.alcohol.2009.10.016. [DOI] [PMC free article] [PubMed] [Google Scholar]
- Klintsova AY, Goodlett CR, Greenough WT. Therapeutic motor training ameliorates cerebellar effects of postnatal binge alcohol. Neurotoxicology & Teratology. 2000;22(1):125–132. doi: 10.1016/s0892-0362(99)00052-5. [DOI] [PubMed] [Google Scholar]
- Kotch LE, Sulik KK. Experimental fetal alcohol syndrome: proposed pathogenic basis for a variety of associated facial and brain anomalies. American Journal of Medical Genetics. 1992;44(2):168–176. doi: 10.1002/ajmg.1320440210. [DOI] [PubMed] [Google Scholar]
- Kreis R, Hofmann L, Kuhlmann B, Boesch C, Bossi E, Huppi PS. Brain metabolite composition during early human brain development as measured by quantitative in vivo 1H magnetic resonance spectroscopy. Magnetic Resonance in Medicine. 2002;48(6):949–958. doi: 10.1002/mrm.10304. [DOI] [PubMed] [Google Scholar]
- Lebel C, Rasmussen C, Wyper K, Andrew G, Beaulieu C. Brain microstructure is related to math ability in children with fetal alcohol spectrum disorder. Alcoholism, Clinical and Experimental Research. 2010;34(2):354–363. doi: 10.1111/j.1530-0277.2009.01097.x. [DOI] [PubMed] [Google Scholar]
- Lebel C, Rasmussen C, Wyper K, Walker L, Andrew G, Yager J, Beaulieu C. Brain diffusion abnormalities in children with fetal alcohol spectrum disorder. Alcoholism, Clinical and Experimental Research. 2008;32(10):1732–1740. doi: 10.1111/j.1530-0277.2008.00750.x. [DOI] [PubMed] [Google Scholar]
- Leoncini E, et al. Frequency of holoprosencephaly in the International Clearinghouse Birth Defects Surveillance Systems: searching for population variations. Birth Defects Research Part A, Clinical and Molecular Teratology. 2008;82(8):585–591. doi: 10.1002/bdra.20479. [DOI] [PubMed] [Google Scholar]
- Li L, Coles CD, Lynch ME, Hu X. Voxelwise and skeleton-based region of interest analysis of fetal alcohol syndrome and fetal alcohol spectrum disorders in young adults. Human Brain Mapping. 2009;30(10):3265–3274. doi: 10.1002/hbm.20747. [DOI] [PMC free article] [PubMed] [Google Scholar]
- Light KE, Kane CJ, Pierce DR, Jenkins D, Ge Y, Brown G, Yang H, Nyamweya N. Intragastric intubation: important aspects of the model for administration of ethanol to rat pups during the postnatal period. Alcoholism, Clinical and Experimental Research. 1998;22(7):1600–1606. doi: 10.1111/j.1530-0277.1998.tb03954.x. [DOI] [PubMed] [Google Scholar]
- Lipinski RJ, Godin EA, O'Leary-Moore SK, Parnell SE, Sulik KK. Genesis of teratogen-induced holoprosencephaly in mice. American Journal of Medical Genetics Part C, Seminars in Medical Genetics. 2010;154C(1):29–42. doi: 10.1002/ajmg.c.30239. [DOI] [PMC free article] [PubMed] [Google Scholar]
- Littner Y, Cudd TA, O'Riordan MA, Cwik A, Bearer CF. Elevated fatty acid ethyl esters in meconium of sheep fetuses exposed in utero to ethanol--a new animal model. Pediatric Research. 2008;63(2):164–168. doi: 10.1203/PDR.0b013e31815f651e. [DOI] [PMC free article] [PubMed] [Google Scholar]
- Ma X, Coles CD, Lynch ME, Laconte SM, Zurkiya O, Wang D, Hu X. Evaluation of corpus callosum anisotropy in young adults with fetal alcohol syndrome according to diffusion tensor imaging. Alcoholism, Clinical and Experimental Research. 2005;29(7):1214–1222. doi: 10.1097/01.alc.0000171934.22755.6d. [DOI] [PubMed] [Google Scholar]
- Ma Y, Hof PR, Grant SC, Blackband SJ, Bennett R, Slatest L, McGuigan MD, Benveniste H. A three-dimensional digital atlas database of the adult C57BL/6J mouse brain by magnetic resonance microscopy. Neuroscience. 2005;135(4):1203–1215. doi: 10.1016/j.neuroscience.2005.07.014. [DOI] [PubMed] [Google Scholar]
- Ma Y, Smith D, Hof PR, Foerster B, Hamilton S, Blackband SJ, Yu M, Benveniste H. In Vivo 3D Digital Atlas Database of the Adult C57BL/6J Mouse Brain by Magnetic Resonance Microscopy. Frontiers in Neuroanatomy. 2008;2:1. doi: 10.3389/neuro.05.001.2008. [DOI] [PMC free article] [PubMed] [Google Scholar]
- Majewski F. Alcohol embryopathy: some facts and speculations about pathogenesis. Neurobehavioral Toxicology and Teratology. 1981;3(2):129–144. [PubMed] [Google Scholar]
- Marshall AG, McCarthy MM, Brishnehan KM, Rao V, Batia LM, Gupta M, Das S, Mitra NK, Chaudhuri JD. Effect of gestational ethanol exposure on parvalbumin and calretinin expressing hippocampal neurons in a chick model of fetal alcohol syndrome. Alcohol. 2009;43(2):147–161. doi: 10.1016/j.alcohol.2008.12.004. [DOI] [PubMed] [Google Scholar]
- Matsunaga E, Shiota K. Holoprosencephaly in human embryos: epidemiologic studies of 150 cases. Teratology. 1977;16(3):261–272. doi: 10.1002/tera.1420160304. [DOI] [PubMed] [Google Scholar]
- Mattson SN, Riley EP, Jernigan TL, Ehlers CL, Delis DC, Jones KL, Stern C, Johnson KA, Hesselink JR, Bellugi U. Fetal alcohol syndrome: a case report of neuropsychological, MRI and EEG assessment of two children. Alcoholism, Clinical and Experimental Research. 1992;16(5):1001–1003. doi: 10.1111/j.1530-0277.1992.tb01909.x. [DOI] [PubMed] [Google Scholar]
- Mattson SN, Riley EP, Jernigan TL, Garcia A, Kaneko WM, Ehlers CL, Jones KL. A decrease in the size of the basal ganglia following prenatal alcohol exposure: a preliminary report. Neurotoxicology and Teratology. 1994;16(3):283–289. doi: 10.1016/0892-0362(94)90050-7. [DOI] [PubMed] [Google Scholar]
- Mattson SN, Riley EP, Sowell ER, Jernigan TL, Sobel DF, Jones KL. A decrease in the size of the basal ganglia in children with fetal alcohol syndrome. Alcoholism, Clinical and Experimental Research. 1996;20(6):1088–1093. doi: 10.1111/j.1530-0277.1996.tb01951.x. [DOI] [PubMed] [Google Scholar]
- Moore ES, Ward RE, Wetherill LF, Rogers JL, Autti-Ramo I, Fagerlund A, Jacobson SW, Robinson LK, Hoyme HE, Mattson SN, Foroud T. Unique facial features distinguish fetal alcohol syndrome patients and controls in diverse ethnic populations. Alcoholism, Clinical and Experimental Research. 2007;31(10):1707–1713. doi: 10.1111/j.1530-0277.2007.00472.x. [DOI] [PubMed] [Google Scholar]
- Moore GJ, Galloway MP. Magnetic resonance spectroscopy: neurochemistry and treatment effects in affective disorders. Psychopharmacology Bulletin. 2002;36(2):5–23. [PubMed] [Google Scholar]
- Mori S, van Zijl PC. Fiber tracking: principles and strategies - a technical review. NMR Biomed. 2002;15:468–480. doi: 10.1002/nbm.781. [DOI] [PubMed] [Google Scholar]
- Mori S, Zhang J. Principles of diffusion tensor imaging and its applications to basic neuroscience research. Neuron. 2006;51:527–539. doi: 10.1016/j.neuron.2006.08.012. [DOI] [PubMed] [Google Scholar]
- Mutsvangwa TE, Meintjes EM, Viljoen DL, Douglas TS. Morphometric analysis and classification of the facial phenotype associated with fetal alcohol syndrome in 5- and 12-year-old children. American Journal of Medical Genetics Part A. 2010;152A(1):32–41. doi: 10.1002/ajmg.a.33137. [DOI] [PubMed] [Google Scholar]
- Mutsvangwa T, Douglas TS. Morphometric analysis of facial landmark data to characterize the facial phenotype associated with fetal alcohol syndrome. Journal of Anatomy. 2007;210(2):209–220. doi: 10.1111/j.1469-7580.2006.00683.x. [DOI] [PMC free article] [PubMed] [Google Scholar]
- Norman AL, Crocker N, Mattson SN, Riley EP. Neuroimaging and fetal alcohol spectrum disorders. Developmental Disabilities Research Review. 2009;15(3):209–217. doi: 10.1002/ddrr.72. [DOI] [PMC free article] [PubMed] [Google Scholar]
- O'Hare ED, Kan E, Yochii J, Mattson SN, Riley EP, Thompson PM, Toga AW, Sowell ER. Mapping cerebellar vermal morphology and cognitive correlates in prenatal alcohol exposure. Neuroreport. 2005;16(12):1285–1290. doi: 10.1097/01.wnr.0000176515.11723.a2. [DOI] [PubMed] [Google Scholar]
- O'Leary-Moore SK, McMechan AP, Galloway MP, Hannigan JH. Neonatal alcohol-induced region-dependent changes in rat brain neurochemistry measured by high-resolution magnetic resonance spectroscopy. Alcoholism, Clinical and Experimental Research. 2008;32(10):1697–1707. doi: 10.1111/j.1530-0277.2008.00747.x. [DOI] [PubMed] [Google Scholar]
- O'Leary-Moore SK, Parnell SE, Godin EA, Dehart DB, Ament JJ, Khan AA, Johnson GA, Styner MA, Sulik KK. Magnetic resonance microscopy-based analyses of the brains of normal and ethanol-exposed fetal mice. Birth Defects Research Part A, Clinical and Molecular Teratology. 2010;88(11):953–964. doi: 10.1002/bdra.20719. [DOI] [PMC free article] [PubMed] [Google Scholar]
- Papia MF, Burke MW, Zangenehpour S, Palmour RM, Ervin FR, Ptito M. Reduced soma size of the M-neurons in the lateral geniculate nucleus following foetal alcohol exposure in non-human primates. Experimental Brain Research. 2010;205(2):263–271. doi: 10.1007/s00221-010-2364-6. [DOI] [PubMed] [Google Scholar]
- Parnell SE, Chen SY, Charness ME, Hodge CW, Dehart DB, Sulik KK. Concurrent dietary administration of D-SAL and ethanol diminishes ethanol's teratogenesis. Alcoholism, Clinical and Experimental Research. 2007;31(12):2059–2064. doi: 10.1111/j.1530-0277.2007.00524.x. [DOI] [PubMed] [Google Scholar]
- Parnell SE, O'Leary-Moore SK, Godin EA, Dehart DB, Johnson BW, Johnson GA, Styner MA, Sulik KK. Magnetic resonance microscopy defines ethanol-induced brain abnormalities in prenatal mice: effects of acute insult on gestational day 8. Alcoholism, Clinical and Experimental Research. 2009;33(6):1001–1011. doi: 10.1111/j.1530-0277.2009.00921.x. [DOI] [PMC free article] [PubMed] [Google Scholar]
- Peiffer J, Majewski F, Fischbach H, Bierich JR, Volk B. Alcohol embryo- and fetopathy. Neuropathology of 3 children and 3 fetuses. Journal of the Neurological Sciences. 1979;41(2):125–137. doi: 10.1016/0022-510x(79)90033-9. [DOI] [PubMed] [Google Scholar]
- Petiet AE, Kaufman MH, Goddeeris MM, Brandenburg J, Elmore SA, Johnson GA. High-resolution magnetic resonance histology of the embryonic and neonatal mouse: a 4D atlas and morphologic database. Proceedings of the National Academy of Sciences of the United States of America. 2008;105(34):12331–12336. doi: 10.1073/pnas.0805747105. [DOI] [PMC free article] [PubMed] [Google Scholar]
- Petiet A, Hedlund L, Johnson GA. Staining methods for magnetic resonance microscopy of the rat fetus. Journal of Magnetic Resonance Imaging. 2007;25(6):1192–1198. doi: 10.1002/jmri.20932. [DOI] [PMC free article] [PubMed] [Google Scholar]
- Pieper S, Halle M, Kikinis R. 3D SLICER, Proceedings of the 1st IEEE International Symposium on Biomedical Imaging: From Nano to Macro.2004. pp. 632–635. [Google Scholar]
- Pieper S, Lorensen B, Screoder W, Kikinis R. The NA-MIC Kit: ITK, VTK, Pipelines, Grids and 3D Slicer as an Open Platform for the Medican Image Computing Community., Proceedings of the 3rd IEEE International Symposium on Biomedical Imaging: From Nano to Macro.2006. pp. 689–701. [Google Scholar]
- Ramadoss J, Lunde ER, Chen WJ, West JR, Cudd TA. Temporal vulnerability of fetal cerebellar Purkinje cells to chronic binge alcohol exposure: ovine model. Alcoholism, Clinical and Experimental Research. 2007;31(10):1738–1745. doi: 10.1111/j.1530-0277.2007.00477.x. [DOI] [PubMed] [Google Scholar]
- Reinhardt K, Mohr A, Gartner J, Spohr HL, Brockmann K. Polymicrogyria in fetal alcohol syndrome. Birth Defects Research Part A, Clinical and Molecular Teratology. 2010;88(2):128–131. doi: 10.1002/bdra.20629. [DOI] [PubMed] [Google Scholar]
- Riley EP, Mattson SN, Sowell ER, Jernigan TL, Sobel DF, Jones KL. Abnormalities of the corpus callosum in children prenatally exposed to alcohol. Alcoholism, Clinical and Experimental Research. 1995;19(5):1198–1202. doi: 10.1111/j.1530-0277.1995.tb01600.x. [DOI] [PubMed] [Google Scholar]
- Riley EP, McGee CL, Sowell ER. Teratogenic effects of alcohol: a decade of brain imaging. American Journal of Medical Genetics Part C, Seminars in Medical Genetics. 2004;127C(1):35–41. doi: 10.1002/ajmg.c.30014. [DOI] [PubMed] [Google Scholar]
- Roussotte F, Sulik KK, Mattson S, Riley E, Jones K, Adnams C, May PA, O'Connor M, Narr K, Sowell E. Regional brain volume reductions relate to facial dysmorphology and neurocognitive function in fetal alcohol spectrum disorders. Human Brain Mapping. doi: 10.1002/hbm.21260. in press. [DOI] [PMC free article] [PubMed] [Google Scholar]
- Ryan SH, Williams JK, Thomas JD. Choline supplementation attenuates learning deficits associated with neonatal alcohol exposure in the rat: effects of varying the timing of choline administration. Brain Research. 2008;1237:91–100. doi: 10.1016/j.brainres.2008.08.048. [DOI] [PMC free article] [PubMed] [Google Scholar]
- Sari Y, Gozes I. Brain deficits associated with fetal alcohol exposure may be protected, in part, by peptides derived from activity-dependent neurotropic factor and activity-dependent neuroprotective protein. Brain Research Reviews. 2006;52(1):107–118. doi: 10.1016/j.brainresrev.2006.01.004. [DOI] [PubMed] [Google Scholar]
- Schambra UB, Lauder JM, Petrusz P, Sulik KK. Development of neurotransmitter systems in the mouse embryo following acute ethanol exposure: a histological and immunocytochemical study. International Journal of Developmental Neuroscience. 1990;8(5):507–522. doi: 10.1016/0736-5748(90)90043-2. [DOI] [PubMed] [Google Scholar]
- Schneider ML, Moore CF, Becker EF. Timing of moderate alcohol exposure during pregnancy and neonatal outcome in rhesus monkeys (Macaca mulatta). Alcoholism, Clinical and Experimental Research. 2001;25(8):1238–1245. [PubMed] [Google Scholar]
- Schneider ML, Moore CF, Kraemer GW, Roberts AD, DeJesus OT. The impact of prenatal stress, fetal alcohol exposure, or both on development: perspectives from a primate model. Psychoneuroendocrinology. 2002;27(1-2):285–298. doi: 10.1016/s0306-4530(01)00050-6. [DOI] [PubMed] [Google Scholar]
- Serrano M, Han M, Brinez P, Linask KK. Fetal alcohol syndrome: cardiac birth defects in mice and prevention with folate. American Journal of Obstetrics and Gynecology. 2010;203(1):75, e77–75, e15. doi: 10.1016/j.ajog.2010.03.017. [DOI] [PubMed] [Google Scholar]
- Sherwin BT, Jacobson S, Troxell SL, Rogers AE, Pelham RW. A rat model (using a semipurified diet) of the fetal alcohol syndrome. Currents in Alcoholism. 1979;7:15–30. [PubMed] [Google Scholar]
- Shiota K, Yamada S, Komada M, Ishibashi M. Embryogenesis of holoprosencephaly. American Journal of Medical Genetics Part A. 2007;143A(24):3079–3087. doi: 10.1002/ajmg.a.32020. [DOI] [PubMed] [Google Scholar]
- Siebert JR, Astley SJ, Clarren SK. Holoprosencephaly in a fetal macaque (Macaca nemestrina) following weekly exposure to ethanol. Teratology. 1991;44(1):29–36. doi: 10.1002/tera.1420440106. [DOI] [PubMed] [Google Scholar]
- Sowell ER, Jernigan TL, Mattson SN, Riley EP, Sobel DF, Jones KL. Abnormal development of the cerebellar vermis in children prenatally exposed to alcohol: size reduction in lobules I-V. Alcoholism, Clinical and Experimental Research. 1996;20(1):31–34. doi: 10.1111/j.1530-0277.1996.tb01039.x. [DOI] [PubMed] [Google Scholar]
- Sowell ER, Johnson A, Kan E, Lu LH, Van Horn JD, Toga AW, O'Connor MJ, Bookheimer SY. Mapping white matter integrity and neurobehavioral correlates in children with fetal alcohol spectrum disorders. Journal of Neuroscience. 2008;28(6):1313–1319. doi: 10.1523/JNEUROSCI.5067-07.2008. [DOI] [PMC free article] [PubMed] [Google Scholar]
- Sowell ER, Mattson SN, Kan E, Thompson PM, Riley EP, Toga AW. Abnormal cortical thickness and brain-behavior correlation patterns in individuals with heavy prenatal alcohol exposure. Cerebral Cortex. 2008;18(1):136–144. doi: 10.1093/cercor/bhm039. [DOI] [PMC free article] [PubMed] [Google Scholar]
- Sowell ER, Mattson SN, Thompson PM, Jernigan TL, Riley EP, Toga AW. Mapping callosal morphology and cognitive correlates: effects of heavy prenatal alcohol exposure. Neurology. 2001;57(2):235–244. doi: 10.1212/wnl.57.2.235. [DOI] [PubMed] [Google Scholar]
- Sowell ER, Thompson PM, Mattson SN, Tessner KD, Jernigan TL, Riley EP, Toga AW. Voxel-based morphometric analyses of the brain in children and adolescents prenatally exposed to alcohol. Neuroreport. 2001;12(3):515–523. doi: 10.1097/00001756-200103050-00018. [DOI] [PubMed] [Google Scholar]
- Sowell ER, Thompson PM, Mattson SN, Tessner KD, Jernigan TL, Riley EP, Toga AW. Regional brain shape abnormalities persist into adolescence after heavy prenatal alcohol exposure. Cerebral Cortex. 2002;12(8):856–865. doi: 10.1093/cercor/12.8.856. [DOI] [PubMed] [Google Scholar]
- Spadoni AD, McGee CL, Fryer SL, Riley EP. Neuroimaging and fetal alcohol spectrum disorders. Neuroscience and Biobehavioral Reviews. 2007;31(2):239–245. doi: 10.1016/j.neubiorev.2006.09.006. [DOI] [PMC free article] [PubMed] [Google Scholar]
- Sulik KK. Genesis of alcohol-induced craniofacial dysmorphism. Experimental Biology and Medicine, (Maywood) 2005;230(6):366–375. doi: 10.1177/15353702-0323006-04. [DOI] [PubMed] [Google Scholar]
- Sulik KK, Johnston MC. Embryonic origin of holoprosencephaly: interrelationship of the developing brain and face. Scanning Electron Microscopy, Part. 1982;1:309–322. [PubMed] [Google Scholar]
- Sulik KK, Johnston MC, Daft PA, Russell WE, Dehart DB. Fetal alcohol syndrome and DiGeorge anomaly: critical ethanol exposure periods for craniofacial malformations as illustrated in an animal model. American Journal of Medical Genetics. 1986;2:97–112. doi: 10.1002/ajmg.1320250614. [DOI] [PubMed] [Google Scholar]
- Sulik KK, Johnston MC, Webb MA. Fetal alcohol syndrome: embryogenesis in a mouse model. Science. 1981;214(4523):936–938. doi: 10.1126/science.6795717. [DOI] [PubMed] [Google Scholar]
- Sulik KK, Lauder JM, Dehart DB. Brain malformations in prenatal mice following acute maternal ethanol administration. International Journal of Developmental Neuroscience. 1984;2(3):201–214. doi: 10.1016/0736-5748(84)90014-5. [DOI] [PubMed] [Google Scholar]
- Sun Y, Strandberg-Larsen K, Vestergaard M, Christensen J, Nybo Andersen AM, Gronbaek M, Olsen J. Binge drinking during pregnancy and risk of seizures in childhood: a study based on the Danish National Birth Cohort. American Journal of Epidemiology. 2009;169(3):313–322. doi: 10.1093/aje/kwn334. [DOI] [PubMed] [Google Scholar]
- Swayze VW, 2nd, Johnson VP, Hanson JW, Piven J, Sato Y, Giedd JN, Mosnik D, Andreasen NC. Magnetic resonance imaging of brain anomalies in fetal alcohol syndrome. Pediatrics. 1997;99(2):232–240. doi: 10.1542/peds.99.2.232. [DOI] [PubMed] [Google Scholar]
- Thomas JD, Abou EJ, Dominguez HD. Prenatal choline supplementation mitigates the adverse effects of prenatal alcohol exposure on development in rats. Neurotoxicology and Teratology. 2009;31(5):303–311. doi: 10.1016/j.ntt.2009.07.002. [DOI] [PMC free article] [PubMed] [Google Scholar]
- Thomas JD, Biane JS, O'Bryan KA, O'Neill TM, Dominguez HD. Choline supplementation following third-trimester-equivalent alcohol exposure attenuates behavioral alterations in rats. Behavioral Neuroscience. 2007;121(1):120–130. doi: 10.1037/0735-7044.121.1.120. [DOI] [PubMed] [Google Scholar]
- Thomas JD, Garrison M, O'Neill TM. Perinatal choline supplementation attenuates behavioral alterations associated with neonatal alcohol exposure in rats. Neurotoxicology and Teratology. 2004;26(1):35–45. doi: 10.1016/j.ntt.2003.10.002. [DOI] [PubMed] [Google Scholar]
- Thomas JD, Idrus NM, Monk BR, Dominguez HD. Prenatal choline supplementation mitigates behavioral alterations associated with prenatal alcohol exposure in rats. Birth Defects Research Part A, Clinical and Molecular Teratology. 2010;88(10):827–837. doi: 10.1002/bdra.20713. [DOI] [PMC free article] [PubMed] [Google Scholar]
- Thomas JD, La Fiette MH, Quinn VR, Riley EP. Neonatal choline supplementation ameliorates the effects of prenatal alcohol exposure on a discrimination learning task in rats. Neurotoxicology and Teratology. 2000;22(5):703–711. doi: 10.1016/s0892-0362(00)00097-0. [DOI] [PubMed] [Google Scholar]
- Turnbull DH, Mori S. MRI in mouse developmental biology. NMR in Biomedicine. 2007;20(3):265–274. doi: 10.1002/nbm.1146. [DOI] [PMC free article] [PubMed] [Google Scholar]
- van der Graaf M. In vivo magnetic resonance spectroscopy: basic methodology and clinical applications. European Biophysics Journal. 2010;39(4):527–540. doi: 10.1007/s00249-009-0517-y. [DOI] [PMC free article] [PubMed] [Google Scholar]
- Vigneron DB. Magnetic resonance spectroscopic imaging of human brain development. Neuroimaging Clinics of North America. 2006;16(1):75–85. viii. doi: 10.1016/j.nic.2005.11.008. [DOI] [PubMed] [Google Scholar]
- Warren KR, Li TK. Genetic polymorphisms: impact on the risk of fetal alcohol spectrum disorders. Birth Defects Research Part A, Clinical and Molecular Teratology. 2005;73(4):195–203. doi: 10.1002/bdra.20125. [DOI] [PubMed] [Google Scholar]
- Webster WS, Walsh DA, McEwen SE, Lipson AH. Some teratogenic properties of ethanol and acetaldehyde in C57BL/6J mice: implications for the study of the fetal alcohol syndrome. Teratology. 1983;27(2):231–243. doi: 10.1002/tera.1420270211. [DOI] [PubMed] [Google Scholar]
- West JR. Use of pup in a cup model to study brain development. Journal of Nutrition. 1993;123(2S):382–385. doi: 10.1093/jn/123.suppl_2.382. [DOI] [PubMed] [Google Scholar]
- Wozniak JR, Mueller BA, Chang PN, Muetzel RL, Caros L, Lim KO. Diffusion tensor imaging in children with fetal alcohol spectrum disorders. Alcoholism, Clinical and Experimental Research. 2006;30(10):1799–1806. doi: 10.1111/j.1530-0277.2006.00213.x. [DOI] [PMC free article] [PubMed] [Google Scholar]
- Wozniak JR, Muetzel RL. What does diffusion tensor imaging reveal about the brain and cognition in fetal alcohol spectrum disorders? Neuropsychology Review. 2011 doi: 10.1007/s11065-011-9162-1. in press. [DOI] [PubMed] [Google Scholar]