Abstract
Background
Long-term medication therapy for post myocardial infarction (MI) patients can prolong life. However, recent data on long-term adherence are limited, particularly among some subpopulations. We compared medication adherence among Medicare MI survivors, by disability status, race/ethnicity, and income.
Methods
We examined 100% of Medicare fee-for-service beneficiaries discharged post-MI in 2008. The outcomes were adherence to β-blockers, statins, and angiotensin-converting enzyme inhibitors (ACEIs)/angiotensin II receptor blockers (ARBs), for 1-year and 6-month post-discharge. Adherence was defined as having prescriptions in possession for ≥75% of days.
Results
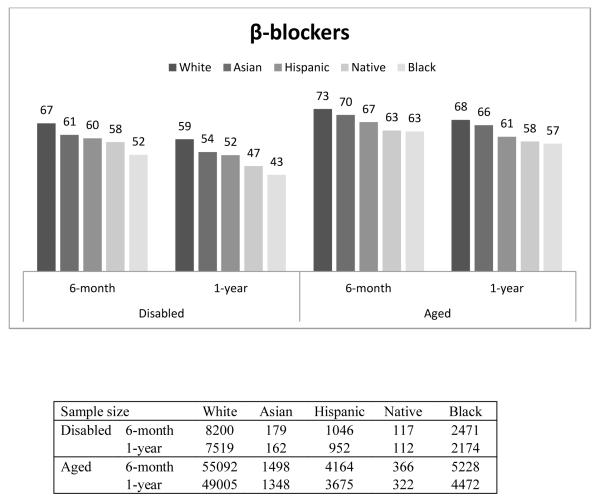
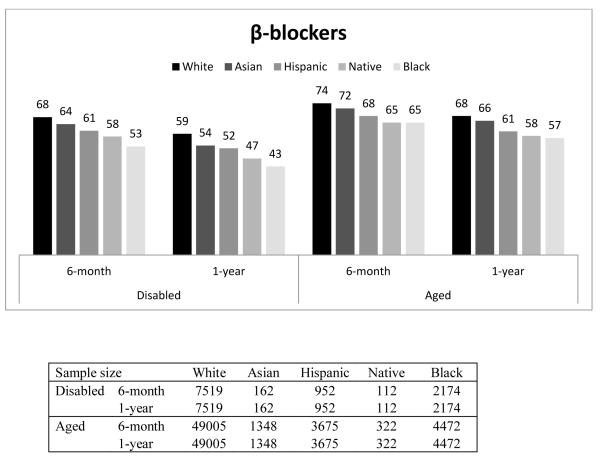
Among aged beneficiaries who survived 1-year, 1-year adherence to β-blockers were 68%, 66%, 61%, 58%, and 57% for Whites, Asians, Hispanics, Native Americans and Blacks, respectively; among the disabled, 1-year adherence was worse for each group: 59%, 54%, 52%, 47% and 43% respectively. The racial/ethnic difference persisted after adjustment for age, gender, income, drug coverage, location and health status. Patterns of adherence to statins and ACEs/ARBs were similar. Among beneficiaries with close-to full drug coverage, minorities were still less likely to adhere relative to Whites, OR=0.70 (95% CI 0.65-0.75) for Blacks and OR=0.70 (95% CI 0.55-0.90) for Native Americans.
Conclusions
Although β-blockers at discharge has improved since the National Committee for Quality Assurance implemented quality measures, long-term adherence remains problematic, especially among disabled and minority beneficiaries. Quality measures for long-term adherence should be created to improve outcomes in post-MI patients. Even among those with close-to full drug coverage, racial differences remain, suggesting that policies simply relying on cost reduction cannot eliminate racial differences.
Approximately 7.9 million Americans have a history of myocardial infarction (MI) or heart attacks according to the American Heart Association.1 About 450,000 deaths occur each year in the US because of new and recurrent heart attacks.1 Clinical guidelines recommend that all patients with an acute MI receive treatment with a β-blocker, a lipid-lowering agent, aspirin, and either an angiotensin-converting enzyme inhibitor (ACEI) or an angiotensin II receptor blockers (ARB).2 Clinical trials have demonstrated the efficacy of these drugs and they have become important components of lifelong medical therapy for these patients.3
Currently, close to 100 percent of AMI patients are given a prescription for a β-blocker at hospital discharge, 4 largely because the National Committee for Quality Assurance (NCQA) requires performance measures of these drugs from health plans. Although initiation of therapy is important, adherence to treatment is equally important. Nationally, the persistent rates of 6-month β-blocker treatment after heart attack, defined as having a β-blocker in possession over 135 days within 180 days after a heart attack, have improved by more than 34 percent since 1996 when NCQA started to require health plans to report the persistent rate of β-blocker use after MI.5 Among Medicare beneficiaries, the 6-month persistent rates of β-blocker treatment after a heart attack increased from 69.6% in 2006 to 82.6% in 2009.5
Despite recent improvements in the acute phase (≤6-month persistence of β-blocker adherence), adherence to β-blockers tends to decline significantly within the first year after a heart attack.6 In general, data on long-term adherence at the national level are quite limited and dated. Kramer and colleagues examined 1-year β-blocker adherence after MI in patients covered by one of 11 commercial health insurance plans in 2001-2002 and found that only 45% of patients were still adherent (defined as prescription claims covering ≥ 75% of days) to β-blockers one year after discharge.7 Choudhry and colleagues examined 1-year adherence to medications used post MI in a group of lower-income Medicare fee-for-services beneficiaries enrolled in Pennsylvania Pharmaceutical Assistance Contract for the Elderly (PACE) and the New Jersey Pharmaceutical Assistance to the Aged and Disabled (PAAD) from 1995 to 2003.8 They found that, among patients prescribed the trio of a statin, a β-blocker, and an ACEI or ARB, only 29.1% were fully adherent one year after discharge in 1995; the percentage increased to 46.4% in 2003.
Given the recent improvement in β-blocker prescribing at hospital discharge and adherence at the 6-month follow-up, it is important to assess whether 1-year adherence rates are also relatively high. It is also important to assess whether there are differences in adherence among different ethnic/racial groups and disability status because if there are, then physicians should be aware of this as they treat patients and policy-makers can target policy efforts for specific groups.
In this paper, using nationally-representative Medicare Part D data from 2008-2009, we examine 6-month and 1-year medication adherence among patients who survived a recent MI. Unlike other related studies we include disabled Medicare beneficiaries, so we can compare the difference in adherence between the disabled and aged as well as different racial groups, after adjusting for health risk and other patient level characteristics.
METHODS
Study population
We obtained 2008 and 2009 pharmacy and medical data for 100% of fee-for-service Medicare beneficiaries who had an MI in 2008 from the Centers for Medicare & Medicaid Services (CMS). CMS’s chronic condition warehouse defines an MI as having at least 1 inpatient claim with a primary or secondary diagnosis code as ICD9 410.X1. We identified those beneficiaries who were discharged alive after an MI in 2008 and who filled at least one outpatient prescription for the selected medications used to treat MI within 60 days after discharge (89.5% of patients filled a drug of interest within 60 days post-discharge and there is no substantial difference across racial/ethnic groups). The selected medications of interest included β-blockers, statins, and ACEIs/ARBs. We did not measure adherence for aspirins because pharmacy claims do not include aspirins because they are “over-the-counter” drugs.
We followed each beneficiary from the date of the first prescription (β-blocker, ACEI, ARB or statin) filled after discharge until they died or until December 31, 2009. We assumed that before the drug was prescribed, a physician evaluated whether it was appropriate. Thus, we excluded patients who had onset conditions that contradicted β-blockers which occurred after the initiation of the drug. A contraindication was defined as having 1 inpatient or 2 outpatient records of primary or secondary diagnosis of hypotension (ICD-9 code 458), bradycardia (ICD-9 code 427.81), heart block greater than first degree (ICD-9 codes 426.0, 426.12, 426.13, 426.2-426.4, 426.51-426.54, and 426.7), asthma (ICD-9 code 493), or COPD (ICD-9 codes 491.2, 496, 506.4).2, 7 We also excluded patients prescribed medications that might contraindicate β-blocker therapy (e.g., inhaled corticosteroids such as fluticasone, budesonide, triamcinolone, and bronchodilator combinations such as fluticasone-salmeterol, budesonide-formoterol) using drug list from the NCQA’s Healthcare Effectiveness Data and Information Set (HEDIS) technical specifications for health plans.9
The study design was approved by the Institutional Review Board at the University of Pittsburgh. The data were obtained through funding from the National Institute of Mental Health (No. RC1MH088510) and the study analyses were funded by the Agency for Healthcare Research and Quality (No. R01HS018657). The sponsors played no role in the study conduct, data analysis, or report generation. The authors are solely responsible for the design and conduct of this study, all analyses, the drafting and editing of the paper and its final contents.
Measurement of adherence
From the overall study populations, we identified two study cohorts: those who lived at least six months and those who lived at least one-year from the first prescription filled after discharge. We calculated both 6-month and 1-year medication possession ratios (MPR). MPR was defined as the proportion of days during which a patient had pills available in the relevant time period (6-month, 1-year) following the first filled prescription after discharge (index date).10 We excluded the days in the hospital from the denominator when calculating the MPR because medications used in the hospital cannot be observed in the Part D event data. We calculated an MPR for each therapeutic class (β-blockers, ACEIs/ARBs, and statins). For each specific MPR calculation, our sample only included those who used at least one drug in the therapeutic class within 60 days after discharge. Thus, the sample size varied across study groups. Finally, we created an indicator of good adherence (MPR≥75%) for each calculated MPR.
Racial and ethnical groups
Although self-reported race in the Medicare enrollment data is known to under-report certain races and ethnicities, the Medicare beneficiary summary file includes an enhanced race variable – the Research Triangle Institute Race Code - where first and last name algorithms have been used to verify race. This race variable has good sensitivity (minimum sensitivity 77 percent) and a Kappa of 0.79.11 The race categories include White (“Whites”), Blacks (“Blacks”), Hispanics, Asian/Pacific Islander (“Asians”), American Indian/Alaska Native (“Native Americans”), and others (missing or unable to determine). In our analysis, we focused on the first five categories and created indicators for Blacks, Hispanics, Asians, and Native Americans, all relative to Whites (reference group).
Drug coverage and income groups
Medicare beneficiaries have different drug benefits depending on their income.12 For example, those who are eligible for both Medicare and Medicaid (duals) have drug copayments as low as $1.05 for generics, and $3.10 for brand-name drugs (2008 numbers); and if they are institutionalized their copayment is $0. Those non-dual beneficiaries whose income is less than 150% of the Federal Poverty Line (FPL) who qualify for federal low-income subsidies (LIS) have drug copayments which range from $2.25 for generic and $5.60 for brand-name drugs (2008 numbers) to 15% of total drug costs. The majority of the rest have standard Part D coverage which has a small deductible, about 25% coinsurance in the initial coverage period, 100% copayment in the coverage gap, and 5% in the catastrophic period. A small number of beneficiaries choose plans that have some supplementary coverage in the coverage gap. Neither the LIS group nor the dual eligible group faces a coverage gap. Using dual eligibility and LIS status in the Medicare Part D data, we constructed a proxy income variable with three groups: duals (whose incomes are normally <75% FPL but may vary across states), non-duals who have incomes between 75% FPL and 150 % FPL, and those with incomes >150% FPL.12
Statistical analysis
We separated the Medicare populations into aged and disabled groups. We conducted logistic regressions to model the probability of good adherence (MPR≥0.75) and reported odds ratios of good adherence for each racial/ethnic group relative to Whites. The unit of analysis was the patient. We reported odds ratios of good adherence in two ways: unadjusted and fully adjusted.
We calculated the prospective prescription drug hierarchical condition category (RxHCC) as a proxy for health status.13 The RxHCC is the beneficiary risk adjuster used by CMS to adjust payment to plans for expected pharmacy costs. In a sensitivity analysis, we used the Elixhauser comorbidity for the risk adjustments and the results are very similar, so we present only the RxHCC-adjusted model.14, 15
In the fully-adjusted model, we adjusted for the following individual-level variables: age, gender, income (dual eligible, ≤150% FPL, and >150% FPL), type of drug coverage (having supplementary coverage in the coverage gap), RxHCC, whether the patient lived in Metropolitan Statistical Area (MSA), whether the patient entered the coverage gap or catastrophic period, whether the patient had a prior MI, whether the patient had an institutional stay, and whether the patient had depression, Alzheimer’s disease, or dementia because these mental disorders might affect the medication adherence. In addition, because claims data do not include measures of educational attainment, we used two Zip-Code level variables for education: the percentage of residents over age of 25 who only completed high school and the percentage who completed at least some college. We conducted all analyses using SAS software, version 9.2 (SAS Institute Inc, Cary, NC) and R: A Language and Environment for Statistical Computing, version 2.12.
RESULTS
Comparison of baseline characteristics by race and ethnicity
Table 1 presents a comparison of baseline characteristics by race and ethnicity. Compared to other races, Blacks were the most likely to be younger than 65 years old (eligible for Medicare because of disability), had the most Elixhauser comorbidies, and the highest mortality. Hispanics had the highest rates of diabetes, rheumatoid arthritis/osteoarthritis, depression, and Alzheimer disease. Whites had the lowest rates of heart failure and diabetes, while Asians and Native Americans had the lowest mortality, but fell near the middle on most other measures.
Table 1. Comparison of Baseline Characteristics Among Overall Population, by Race/Ethnicity*.
| Variable | Whites | Blacks | Asians | Hispanic s |
Native- American s |
|
|---|---|---|---|---|---|---|
| N | 73807 | 8896 | 1960 | 6050 | 559 | |
| Female | 55.1 | 60.7 | 48.7 | 51.5 | 52.2 | |
| Disabled† | < 35 | 0.1 | 0.6 | 0.1 | 0.2 | 0.5 |
| 35-50 | 3.0 | 8.6 | 1.8 | 4.5 | 5.7 | |
| 51-64 | 9.6 | 22.7 | 7.8 | 15.3 | 17.7 | |
| Aged† | 65-74 | 31.3 | 30.3 | 30.7 | 33.8 | 38.5 |
| 75-84 | 33.4 | 24.5 | 38.1 | 32.2 | 27.5 | |
| > 85 | 22.5 | 13.3 | 21.5 | 14.0 | 10.0 | |
| Heart failure | 62.9 | 73.2 | 68.1 | 72.0 | 67.6 | |
| Diabetes | 46.2 | 65.4 | 65.7 | 71.3 | 64.2 | |
| Rheumatoid/Osteoarthritis | 28.3 | 29.4 | 26.3 | 31.0 | 24.7 | |
| Depression | 24.4 | 19.6 | 12.9 | 26.3 | 22.9 | |
| Alzheimer | 7.4 | 8.6 | 6.7 | 9.7 | 4.3 | |
| Dementia | 18.4 | 22.3 | 18.8 | 21.0 | 14.7 | |
| Died in a year after discharge | 9.5 | 11.3 | 9.0 | 9.4 | 8.9 | |
| Prescription Drug Risk Score | 0.7±0.00 | 0.83±0.00 | 0.7±0.00 | 0.77±0.00 | 0.79±0.01 | |
| No. of Elixhauser comobidities | 3.31±0.01 | 4.53±0.03 | 3.7±0.06 | 4.37±0.04 | 3.89±0.13 |
Plus-minus values are means±SE. We conducted chi-square test to compare categorical variables and analysis of variance to compare continuous variables across different racial groups.
All P-values are <0.001.
These numbers are years of age.
Racial/ethnic difference in 6-month and 1-year medication adherence
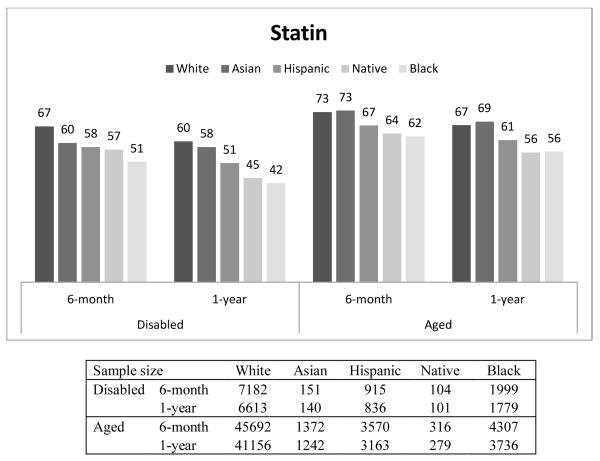
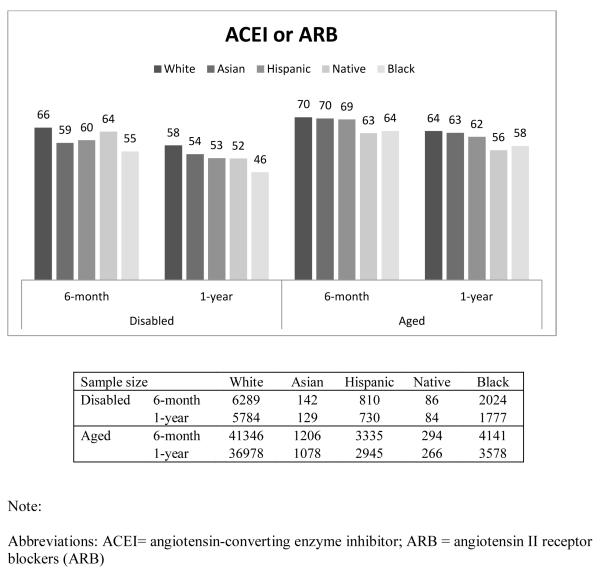
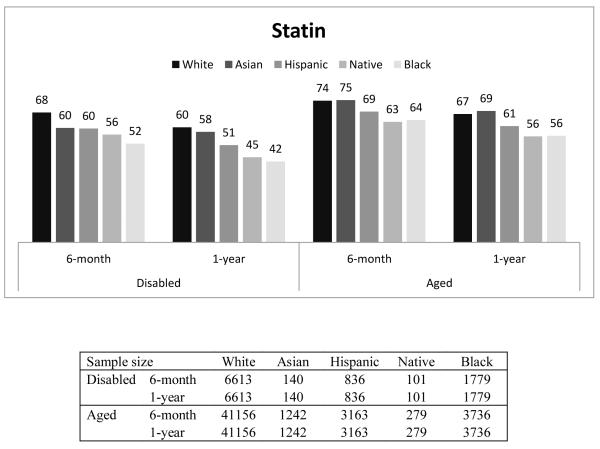
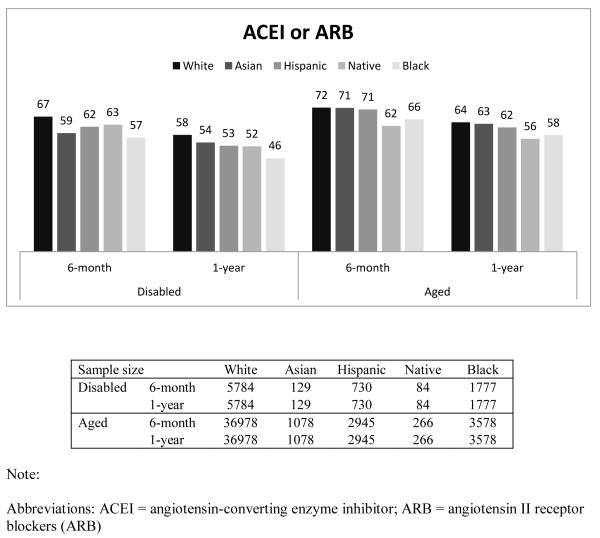
Figure 1 presents the percentage of beneficiaries who had good adherence (MPR ≥ 0.75) by race, disability status, and length of follow-up. In general, Whites had the highest proportion with good adherence, followed by Asians, Hispanics, Native Americans, and Blacks. For example, among the disabled who were taking β-blockers, the percentage of beneficiaries with good adherence for 6-month adherence was 67%, 61%, 60%, 58%, and 52% for Whites, Asians, Hispanics, Native Americans and Blacks, respectively. Compared to the disabled, a higher proportion of the aged had good adherence. This finding was similar across all races, and across all three drug classes. The adherence rate in our overall sample, including aged and disabled as well as all racial groups was 65%.
Figure 1.
Proportion of Good Adherence (MPR≥0.75), by Disability, Length of Follow-up, and Race/Ethnicity
In addition, we observed that, within each group, the proportion with good adherence was higher for the 6-month period than for the 1-year period. The decrease in the proportion of beneficiaries within racial group with good adherence between 6-month and 1-year was consistently larger among the disabled population (P-value <0.05).
It should be noted that the above 6-month and 1-year adherence rates shown in Table 2 were for slightly different subpopulations – 6-month adherence was measured among those who survived at least 6-month while 1-year adherence was among those who survived over 1-year. To ensure the patterns of 6-month and 1-year adherence rates were consistent for the same subpopulations, we also examined the 6-month and 1-year adherence rates among those who survived over 1-year (Appendix Table 2 and Appendix Figure 1). The numbers are similar. Among aged Whites who lived at least one year after filling their β-blocker after discharge, 74% of them were adherent for the first six months while 73 percent of the population who survived at least six months were adherent. The comparable proportions for Blacks were 72 and 70 percent.
Table 2. Racial/Ethnic Difference in 6-month and 1-year Medication Adherence to β-blockers *.
| Panel A. Disabled | ||||||||
|---|---|---|---|---|---|---|---|---|
|
| ||||||||
| 6-Month Adherence | 1-year Adherence | |||||||
|
| ||||||||
| Race | Unadjusted | Fully Adjusted† | Unadjusted | Fully Adjusted† | ||||
| OR | 95% CI | OR | 95% CI | OR | 95% CI | OR | 95% CI | |
| Black | 0.55 | (0.51, 0.61) | 0.69 | (0.62, 0.76) | 0.52 | (0.48, 0.58) | 0.66 | (0.59, 0.74) |
| Native | 0.70 | (0.48, 1.01) | 0.71 | (0.48, 1.06) | 0.61 | (0.42, 0.89) | 0.61 | (0.41, 0.92) |
| Hispanic | 0.75 | (0.66, 0.85) | 0.88 | (0.76, 1.03) | 0.75 | (0.66, 0.86) | 0.89 | (0.76, 1.04) |
| Asian | 0.80 | (0.59, 1.08) | 0.86 | (0.61, 1.19) | 0.79 | (0.58, 1.08) | 0.81 | (0.58, 1.14) |
| White | 1.00 | Reference | 1.00 | Reference | 1.00 | Reference | 1.00 | Reference |
|
| ||||||||
| Panel B. Aged | ||||||||
|
| ||||||||
| 6-Month Adherence | 1-year Adherence | |||||||
|
| ||||||||
| Race | Unadjusted | Fully Adjusted † | Unadjusted | Fully Adjusted † | ||||
| OR | 95% CI | OR | 95% CI | OR | 95% CI | OR | 95% CI | |
|
| ||||||||
| Black | 0.63 | (0.59, 0.67) | 0.71 | (0.67, 0.76) | 0.63 | (0.59, 0.67) | 0.70 | (0.65, 0.75) |
| Native | 0.64 | (0.52, 0.79) | 0.71 | (0.57, 0.89) | 0.66 | (0.53, 0.82) | 0.72 | (0.57, 0.92) |
| Hispanic | 0.76 | (0.71, 0.81) | 0.82 | (0.76, 0.89) | 0.72 | (0.67, 0.77) | 0.77 | (0.71, 0.84) |
| Asian | 0.88 | (0.78, 0.98) | 0.82 | (0.73, 0.93) | 0.90 | (0.80, 1.01) | 0.84 | (0.74, 0.95) |
| White | 1.00 | Reference | 1.00 | Reference | 1.00 | Reference | 1.00 | Reference |
Bold denote statistically significant at p-value <0.05.
“Fully Adjusted” means adjusted for all covariates discussed in the Statistical Analysis section.
Table 2 presents the estimated odd ratios (ORs) for the differences in the proportions of good adherence to β-blockers for each racial group relative to whites. In all cases, the estimated unadjusted odds ratios are lower than fully adjusted odds ratios – this indicates that characteristics associated with lower adherence are disproportionately distributed among the nonwhite population.
Among the disabled, relative to Whites, Blacks were significantly less likely to have good adherence (after fully adjusting covariates) for both the 6-month (OR=0.69; 95% CI 0.62-0.76) and 1-year (OR=0.66; 95% CI 0.59-0.74) measures and that Native Americans were less likely to have good adherence for the 1-year measure (OR=0.61; 95% CI 0.41-0.92).
Our findings for the aged are more robust than those for the disabled because of larger sample sizes. In the fully adjusted model, relative to Whites, the ORs for 6-month good adherence were 0.71 for both Blacks (95% CI 0.67-0.76) and Native Americans (95% CI 0.57-0.89) while those for Asians and Hispanics were each 0.82 (Asians: 95% CI 0.73-0.93; Hispanics: 95% CI 0.76-0.89).
The findings for good adherence on statins and ACEIs/ARBs were similar to those found for β-Blockers (Appendix Table 1).
Racial/ethnic difference in medication adherence, by income
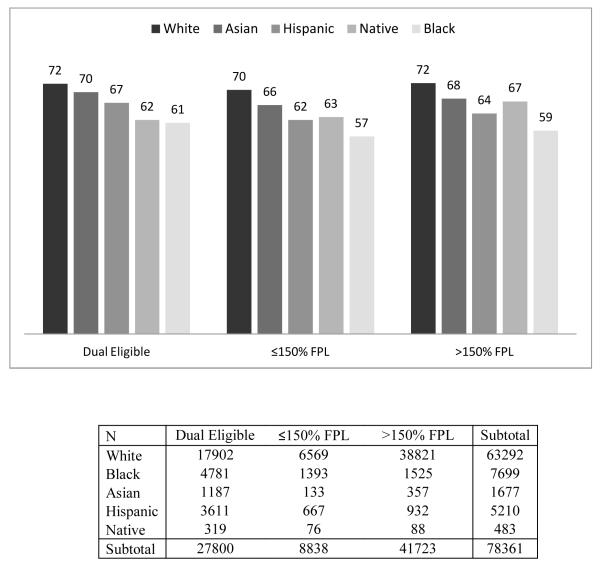
In order to determine if our results can be explained by differences in income or participation in the LIS program, we reported our results separately for each income/eligibility group in Table 3. In general, we found that the racial disparities between White and Black and Hispanic beneficiaries persist even within income groups. For example, we found that among the dual eligibles, Black beneficiaries were less likely to have good adherence compared to White beneficiaries at both 6-months (OR=0.70; 95% CI 0.65-0.75) and 1-year (OR=0.70; 95% CI 0.65-0.76) after adjusting for the full set of covariates except for income. However, among non-dual beneficiaries, the difference between Asians or Native Americans and Whites disappeared after adjusting for the covariates.
Table 3. Racial/Ethnic Difference in Medication Adherence to β-blockers, by Income*.
| Panel A. 6-month Adherence | ||||||||||||
|---|---|---|---|---|---|---|---|---|---|---|---|---|
|
| ||||||||||||
| Dual Eligible | ≤150% FPL | >150% FPL | ||||||||||
|
| ||||||||||||
| Race | Unadjusted | Adjusted† | Unadjusted | Adjusted† | Unadjusted | Adjusted† | ||||||
| OR | 95% CI | OR | 95% CI | OR | 95% CI | OR | 95% CI | OR | 95% CI | OR | 95% CI | |
| Black | 0.59 | (0.55, 0.63) | 0.70 | (0.65, 0.75) | 0.56 | (0.5, 0.63) | 0.70 | (0.61, 0.80) | 0.81 | (0.65, 1.01) | 0.69 | (0.62, 0.77) |
| Native | 0.61 | (0.49, 0.77) | 0.70 | (0.55, 0.9) | 0.65 | (0.41, 1.03) | 0.77 | (0.47, 1.26) | 0.67 | (0.58, 0.76) | 0.84 | (0.53, 1.33) |
| Hispanic | 0.77 | (0.71, 0.83) | 0.84 | (0.77, 0.92) | 0.71 | (0.6, 0.84) | 0.82 | (0.68, 1.00) | 0.54 | (0.49, 0.6) | 0.77 | (0.66, 0.89) |
| Asian | 0.90 | (0.8, 1.03) | 0.82 | (0.72, 0.95) | 0.80 | (0.56, 1.15) | 0.73 | (0.49, 1.08) | 0.77 | (0.47, 1.26) | 0.85 | (0.68, 1.07) |
| White | 1 | Reference | 1 | Reference | 1 | Reference | 1 | Reference | 1 | Reference | 1 | Reference |
|
| ||||||||||||
| Panel B. 1-year Adherence | ||||||||||||
|
| ||||||||||||
| Dual Eligible | ≤150% FPL | >150% FPL | ||||||||||
|
| ||||||||||||
| Race | Unadjusted | Adjusted † | Unadjusted | Adjusted † | Unadjusted | Adjusted † | ||||||
| OR | 95% CI | OR | 95% CI | OR | 95% CI | OR | 95% CI | OR | 95% CI | OR | 95% CI | |
|
| ||||||||||||
| Black | 0.57 | (0.54, 0.62) | 0.70 | (0.65, 0.76) | 0.53 | (0.47, 0.61) | 0.64 | (0.55, 0.74) | 0.51 | (0.45, 0.57) | 0.65 | (0.57, 0.73) |
| Native | 0.61 | (0.48, 0.78) | 0.71 | (0.55, 0.91) | 0.57 | (0.36, 0.92) | 0.75 | (0.45, 1.24) | 0.66 | (0.43, 1.03) | 0.76 | (0.48, 1.21) |
| Hispanic | 0.71 | (0.66, 0.77) | 0.79 | (0.72, 0.87) | 0.65 | (0.55, 0.78) | 0.75 | (0.61, 0.92) | 0.69 | (0.6, 0.8) | 0.82 | (0.7, 0.95) |
| Asian | 0.87 | (0.76, 0.99) | 0.78 | (0.68, 0.9) | 0.97 | (0.67, 1.42) | 0.86 | (0.57, 1.31) | 0.91 | (0.72, 1.15) | 0.99 | (0.78, 1.26) |
| White | 1 | Reference | 1 | Reference | 1 | Reference | 1 | Reference | 1 | Reference | 1 | Reference |
Bold denote statistically significant at p-value <0.05.
“Adjusted” models were adjusted for all covariates except for income as discussed in the Statistical Analysis section.
DISCUSSION
In this paper we found that disabled Medicare beneficiaries, those under age 65 who are enrolled in Medicare because they meet the disability criteria, are less likely to be good adherents to their medication therapy (15% of our study sample were disabled and 85% were aged). We cannot observe the reason for the disability status: on average disabled beneficiaries are more likely to have mental disorders and other health conditions that prevent them from being employed; this partially explains the lower adherence among this population. We confirmed that the proportion of Blacks who maintain good adherence to their medication therapy is lower than that of Whites. In addition, we were able to examine rates of good adherence among Native Americans, Hispanics and Asians, which are relatively less known. We found that all of these groups had lower adherence rates than Whites. And persistent racial disparities in adherence could not be explained by differences in income, the availability of drug copayment subsidies, or the numerous other factors controlled for in the fully adjusted model.
Our study has some limitations. First, although the enhanced Race Code is better than the original one based on self-reported data, some racial misclassification is still possible.11 Second, there are some errors with measuring adherence using claims data; for example, filling a drug does not mean one is taking the drug. We cannot observe patients who were prescribed a drug but refused to take it. We cannot observe all contradictions to the studied drugs; e.g. we cannot see measures such as left ventricular ejection fraction (LVEF) and LDL-C, a contradiction to ACEI. We assumed that if we see a prescription filled in the claims for an ACEI, the physician who prescribed the drug had evaluated patient’s profile for contraindications. Third, claims data do not have education information so we had to use Zip Code level data.
Our estimates for 6-month adherence to β-blockers are slightly lower than those reported by NCQA.4, 5 This finding may be due to the fact that we only have data for Medicare beneficiaries enrolled in stand-alone Part D plans, i.e. fee-for-service Medicare. We do not have data on those enrolled in Medicare-Advantage plans (representing about 20% of Medicare population) because CMS does not collect medical diagnosis data for those enrollees. Medicare-Advantage plans offer bundled drug and medical insurance to Medicare and they have incentives and many have developed programs to improve medication adherence in order to potentially save down-stream more expensive medical spending. The adherence post-MI in our sample, however, is larger than the adherence rate reported in a recent study using commercial data (rates of MPR≥80% are for ACE inhibitors or ARBs, 45.0% for beta-blockers, 49.0% for statins, and 38.9% for all three medication classes).16
Compared to the previous studies,7, 8 our study shows that 1-year adherence (defined as prescription claims covering ≥ 75% of days) to medications post-MI has improved in the last decade, from around 45% in previous reported studies to 65% on average in our study sample.
In addition, we found that overall adherent rates fell over time across all groups; that is, 6-month adherence rate was larger than 1-year adherence rate. In addition, the decrease in the proportion of beneficiaries with good adherence between 6-month and 1-year within racial group was consistently larger among the disabled population. This decrease in adherence is important because it demonstrates that long-term follow-up may be necessary to ensure that patients continue to use these important medications over time. These findings suggest that quality improvements should focus on long-term adherence after a heart attack. They also suggest that more policy research is needed to examine how to improve long-term adherence in Medicare fee-for-service.
We also found that reduced adherence is not driven by the nature of the prescription coverage type. Within the two groups of Medicare beneficiaries who have relatively complete drug coverage, we found that there were still significant differences in rates of good adherence across racial/ethnic groups, after adjusting for health status and other factors. This indicates that even if drugs were completely covered, racial/ethnic differences would likely persist. Part of this racial/ethnic difference could be because of patients’ health belief.17 Thus, policies solely relying on lowering drug costs will not be effective in eliminating the racial disparities and they should be combined with other strategies that target health beliefs.
Overall, physicians should be more attentive to their patients over the long term course of treatment. Certainly, our findings suggest that physicians should be particularly sensitive to their disabled and non-White patients. Even more importantly, policy makers should be more attentive to strategies for improving long-term adherence.
Figure 2.
Racial Difference in 6-month Adherence to β-blockers, by Income
APPENDIX
Appendix Table 1.
Racial/Ethnic Difference in 6-Month Among Those Who Survived ≥ 6-Month and 1-Year Medication Adherence Among Those Who Survived ≥ 1-Year*
| Part (1) Angiotensin-converting enzyme inhibitor/Angiotensin II receptor blockers | ||||||||
|---|---|---|---|---|---|---|---|---|
| Panel A. Disabled | ||||||||
| 6-Month Adherence | 1-year Adherence | |||||||
| Race | Unadjusted | Fully Adjusted† | Unadjusted | Fully Adjusted† | ||||
| OR | 95% CI | OR | 95% CI | OR | 95% CI | OR | 95% CI | |
| Black | 0.65 | (0.59, 0.72) | 0.82 | (0.73, 0.92) | 0.63 | (0.56, 0.70) | 0.80 | (0.70, 0.90) |
| Native | 0.92 | (0.59, 1.44) | 0.90 | (0.56, 1.44) | 0.80 | (0.52, 1.23) | 0.76 | (0.48, 1.22) |
| Hispanic | 0.79 | (0.68, 0.92) | 0.89 | (0.75, 1.06) | 0.80 | (0.69, 0.94) | 0.86 | (0.72, 1.04) |
| Asian | 0.75 | (0.54, 1.06) | 0.91 | (0.63, 1.33) | 0.86 | (0.60, 1.22) | 0.92 | (0.62, 1.35) |
| White | 1.00 | Reference | 1.00 | Reference | 1.00 | Reference | 1.00 | Reference |
| Panel B. Aged | ||||||||
| 6-Month Adherence | 1-year Adherence | |||||||
| Race | Unadjusted | Fully Adjusted† | Unadjusted | Fully Adjusted† | ||||
| OR | 95% CI | OR | 95% CI | OR | 95% CI | OR | 95% CI | |
| Black | 0.76 | (0.71, 0.81) | 0.82 | (0.76, 0.89) | 0.77 | (0.71, 0.82) | 0.81 | (0.75, 0.87) |
| Native | 0.73 | (0.58, 0.93) | 0.76 | (0.59, 0.97) | 0.71 | (0.56, 0.91) | 0.75 | (0.58, 0.97) |
| Hispanic | 0.95 | (0.88, 1.03) | 0.97 | (0.88, 1.06) | 0.90 | (0.83, 0.97) | 0.91 | (0.83, 0.99) |
| Asian | 0.97 | (0.86, 1.10) | 0.87 | (0.76, 0.99) | 0.97 | (0.85, 1.10) | 0.86 | (0.75, 0.98) |
| White | 1.00 | Reference | 1.00 | Reference | 1.00 | Reference | 1.00 | Reference |
| Part (2) Statin | ||||||||
| Panel A. Disabled | ||||||||
| 6-Month Adherence | 1-year Adherence | |||||||
| Race | Unadjusted | Fully Adjusted† | Unadjusted | Fully Adjusted† | ||||
| OR | 95% CI | OR | 95% CI | OR | 95% CI | OR | 95% CI | |
| Black | 0.53 | (0.48, 0.59) | 0.63 | (0.56, 0.71) | 0.49 | (0.44, 0.54) | 0.59 | (0.52, 0.67) |
| Native | 0.66 | (0.44, 0.97) | 0.65 | (0.43, 1.00) | 0.53 | (0.36, 0.79) | 0.52 | (0.34, 0.79) |
| Hispanic | 0.69 | (0.60, 0.79) | 0.74 | (0.63, 0.87) | 0.69 | (0.59, 0.79) | 0.76 | (0.64, 0.90) |
| Asian | 0.74 | (0.53, 1.02) | 0.69 | (0.48, 0.99) | 0.91 | (0.65, 1.27) | 0.92 | (0.63, 1.35) |
| White | 1.00 | Reference | 1.00 | Reference | 1.00 | Reference | 1.00 | Reference |
| Panel B. Aged | ||||||||
| 6-Month Adherence | 1-year Adherence | |||||||
| Race | Unadjusted | Fully Adjusted† | Unadjusted | Fully Adjusted† | ||||
| OR | 95% CI | OR | 95% CI | OR | 95% CI | OR | 95% CI | |
| Black | 0.62 | (0.58, 0.66) | 0.69 | (0.65, 0.75) | 0.62 | (0.58, 0.66) | 0.67 | (0.62, 0.73) |
| Native | 0.65 | (0.52, 0.82) | 0.70 | (0.55, 0.89) | 0.61 | (0.48, 0.77) | 0.65 | (0.51, 0.84) |
| Hispanic | 0.76 | (0.70, 0.82) | 0.80 | (0.74, 0.88) | 0.76 | (0.71, 0.82) | 0.79 | (0.73, 0.87) |
| Asian | 1.03 | (0.91, 1.16) | 0.91 | (0.80, 1.04) | 1.08 | (0.95, 1.21) | 0.95 | (0.83, 1.08) |
| White | 1.00 | Reference | 1.00 | Reference | 1.00 | Reference | 1.00 | Reference |
Bold denote statistically significant at p-value <0.05.
“Fully Adjusted” means adjusted for all covariates discussed in the Statistical Analysis section.
Appendix Table 2.
Racial/Ethnic Difference in 6-month and 1-year Medication Adherence, Among Those Who Survived ≥ 1 Year *
| 1) β-blockers | ||||||||
|---|---|---|---|---|---|---|---|---|
| Panel A. Disabled | ||||||||
| 6-Month Adherence | 1-year Adherence | |||||||
| Race | Unadjusted | Fully Adjusted† | Unadjusted | Fully Adjusted† | ||||
| OR | 95% CI | OR | 95% CI | OR | 95% CI | OR | 95% CI | |
| Black | 0.55 | (0.50, 0.60) | 0.68 | (0.61, 0.76) | 0.52 | (0.48, 0.58) | 0.66 | (0.59, 0.74) |
| Native | 0.66 | (0.45, 0.97) | 0.69 | (0.46, 1.04) | 0.61 | (0.42, 0.89) | 0.61 | (0.41, 0.92) |
| Hispanic | 0.75 | (0.65, 0.86) | 0.88 | (0.75, 1.04) | 0.75 | (0.66, 0.86) | 0.89 | (0.76, 1.04) |
| Asian | 0.86 | (0.62, 1.19) | 0.90 | (0.63, 1.28) | 0.79 | (0.58, 1.08) | 0.81 | (0.58, 1.14) |
| White | 1.00 | Reference | 1.00 | Reference | 1.00 | Reference | 1.00 | Reference |
| Panel B. Aged | ||||||||
| 6-Month Adherence | 1-year Adherence | |||||||
| Race | Unadjusted | Fully Adjusted† | Unadjusted | Fully Adjusted† | ||||
| OR | 95% CI | OR | 95% CI | OR | 95% CI | OR | 95% CI | |
| Black | 0.64 | (0.60, 0.68) | 0.71 | (0.66, 0.76) | 0.63 | (0.59, 0.67) | 0.70 | (0.65, 0.75) |
| Native | 0.63 | (0.50, 0.80) | 0.70 | (0.55, 0.89) | 0.66 | (0.53, 0.82) | 0.72 | (0.57, 0.92) |
| Hispanic | 0.73 | (0.68, 0.79) | 0.79 | (0.72, 0.86) | 0.72 | (0.67, 0.77) | 0.77 | (0.71, 0.84) |
| Asian | 0.88 | (0.78, 0.99) | 0.83 | (0.73, 0.94) | 0.90 | (0.80, 1.01) | 0.84 | (0.74, 0.95) |
| White | 1.00 | Reference | 1.00 | Reference | 1.00 | Reference | 1.00 | Reference |
| 2) ACEI/ARB | ||||||||
| Panel A. Disabled | ||||||||
| 6-Month Adherence | 1-year Adherence | |||||||
| Race | Unadjusted | Fully Adjusted† | Unadjusted | Fully Adjusted† | ||||
| OR | 95% CI | OR | 95% CI | OR | 95% CI | OR | 95% CI | |
| Black | 0.64 | (0.57, 0.71) | 0.81 | (0.71, 0.91) | 0.63 | (0.56, 0.70) | 0.80 | (0.70, 0.90) |
| Native | 0.84 | (0.54, 1.31) | 0.83 | (0.51, 1.34) | 0.80 | (0.52, 1.23) | 0.76 | (0.48, 1.22) |
| Hispanic | 0.80 | (0.68, 0.94) | 0.89 | (0.74, 1.07) | 0.80 | (0.69, 0.94) | 0.86 | (0.72, 1.04) |
| Asian | 0.70 | (0.49, 1.00) | 0.81 | (0.55, 1.20) | 0.86 | (0.60, 1.22) | 0.92 | (0.62, 1.35) |
| White | 1.00 | Reference | 1.00 | Reference | 1.00 | Reference | 1.00 | Reference |
| Panel B. Aged | ||||||||
| 6-Month Adherence | 1-year Adherence | |||||||
| Race | Unadjusted | Fully Adjusted† | Unadjusted | Fully Adjusted† | ||||
| OR | 95% CI | OR | 95% CI | OR | 95% CI | OR | 95% CI | |
| Black | 0.76 | (0.71, 0.82) | 0.81 | (0.74, 0.88) | 0.77 | (0.71, 0.82) | 0.81 | (0.75, 0.87) |
| Native | 0.66 | (0.51, 0.85) | 0.68 | (0.52, 0.88) | 0.71 | (0.56, 0.91) | 0.75 | (0.58, 0.97) |
| Hispanic | 0.96 | (0.88, 1.04) | 0.96 | (0.87, 1.05) | 0.90 | (0.83, 0.97) | 0.91 | (0.83, 0.99) |
| Asian | 0.99 | (0.87, 1.14) | 0.87 | (0.76, 1.01) | 0.97 | (0.85, 1.10) | 0.86 | (0.75, 0.98) |
| White | 1.00 | Reference | 1.00 | Reference | 1.00 | Reference | 1.00 | Reference |
| 3) Statin | ||||||||
| Panel A. Disabled | ||||||||
| 6-Month Adherence | 1-year Adherence | |||||||
| Race | Unadjusted | Fully Adjusted† | Unadjusted | Fully Adjusted† | ||||
| OR | 95% CI | OR | 95% CI | OR | 95% CI | OR | 95% CI | |
| Black | 0.50 | (0.45, 0.56) | 0.60 | (0.53, 0.68) | 0.49 | (0.44, 0.54) | 0.59 | (0.52, 0.67) |
| Native | 0.61 | (0.41, 0.91) | 0.62 | (0.40, 0.95) | 0.53 | (0.36, 0.79) | 0.52 | (0.34, 0.79) |
| Hispanic | 0.70 | (0.60, 0.81) | 0.76 | (0.64, 0.90) | 0.69 | (0.59, 0.79) | 0.76 | (0.64, 0.90) |
| Asian | 0.71 | (0.50, 1.00) | 0.66 | (0.45, 0.97) | 0.91 | (0.65, 1.27) | 0.92 | (0.63, 1.35) |
| White | 1.00 | Reference | 1.00 | Reference | 1.00 | Reference | 1.00 | Reference |
| Panel B. Aged | ||||||||
| 6-Month Adherence | 1-year Adherence | |||||||
| Race | Unadjusted | Fully Adjusted† | Unadjusted | Fully Adjusted† | ||||
| OR | 95% CI | OR | 95% CI | OR | 95% CI | OR | 95% CI | |
| Black | 0.62 | (0.58, 0.67) | 0.68 | (0.63, 0.74) | 0.62 | (0.58, 0.66) | 0.67 | (0.62, 0.73) |
| Native | 0.60 | (0.47, 0.76) | 0.62 | (0.48, 0.80) | 0.61 | (0.48, 0.77) | 0.65 | (0.51, 0.84) |
| Hispanic | 0.76 | (0.70, 0.82) | 0.79 | (0.72, 0.87) | 0.76 | (0.71, 0.82) | 0.79 | (0.73, 0.87) |
| Asian | 1.02 | (0.90, 1.16) | 0.89 | (0.78, 1.03) | 1.08 | (0.95, 1.21) | 0.95 | (0.83, 1.08) |
| White | 1.00 | Reference | 1.00 | Reference | 1.00 | Reference | 1.00 | Reference |
Bold denote statistically significant at p-value <0.05.
“Fully Adjusted” means adjusted for the full list of covariates discussed in the Statistical Analysis section
Appendix Figure 1.
Percentage of Patients with Good Adherence (MPR≥0.75), by Disability, Length of Follow-up, and Race/Ethnicity, Among Those Who Survived ≥ 1 Year.
REFERENCES
- 1.Roger VL, Go AS, Lloyd-Jones DM, Adams RJ, Berry JD, Brown TM, et al. Heart disease and stroke statistics--2011 update: a report from the American Heart Association. Circulation. 2011;123(4):e18–e209. doi: 10.1161/CIR.0b013e3182009701. [DOI] [PMC free article] [PubMed] [Google Scholar]
- 2.Antman EM, Hand M, Armstrong PW, Bates ER, Green LA, Halasyamani LK, et al. 2007 Focused Update of the ACC/AHA 2004 Guidelines for the Management of Patients With ST-Elevation Myocardial Infarction: a report of the American College of Cardiology/American Heart Association Task Force on Practice Guidelines: developed in collaboration With the Canadian Cardiovascular Society endorsed by the American Academy of Family Physicians: 2007 Writing Group to Review New Evidence and Update the ACC/AHA 2004 Guidelines for the Management of Patients With ST-Elevation Myocardial Infarction, Writing on Behalf of the 2004 Writing Committee. Circulation. 2008;117(2):296–329. doi: 10.1161/CIRCULATIONAHA.107.188209. [DOI] [PubMed] [Google Scholar]
- 3.Wald NJ, Law MR. A strategy to reduce cardiovascular disease by more than 80% BMJ. 2003;326(7404):1419. doi: 10.1136/bmj.326.7404.1419. [DOI] [PMC free article] [PubMed] [Google Scholar]
- 4.Lee TH. Eulogy for a Quality Measure. N Engl J Med. 2007;357(12):1175–1177. doi: 10.1056/NEJMp078102. [DOI] [PubMed] [Google Scholar]
- 5.National Committee for Quality Assurance . State of Health Care Quality. Washington DC: 2010. [Google Scholar]
- 6.Phillips KA, Shlipak MG, Coxson P, Heidenreich PA, Hunink MG, Goldman PA, et al. Health and economic benefits of increased beta-blocker use following myocardial infarction. JAMA. 2000;284(21):2748–54. doi: 10.1001/jama.284.21.2748. [DOI] [PubMed] [Google Scholar]
- 7.Kramer JM, Hammill B, Anstrom KJ, Fetterolf D, Snyder R, Charde JP, et al. National evaluation of adherence to beta-blocker therapy for 1 year after acute myocardial infarction in patients with commercial health insurance. Am Heart J. 2006;152(3):454, e1–8. doi: 10.1016/j.ahj.2006.02.030. [DOI] [PubMed] [Google Scholar]
- 8.Choudhry NK, Setoguchi S, Levin R, Winkelmayer WC, Shrank WH. Trends in adherence to secondary prevention medications in elderly post-myocardial infarction patients. Pharmacoepidemiol Drug Saf. 2008;17(12):1189–96. doi: 10.1002/pds.1671. [DOI] [PMC free article] [PubMed] [Google Scholar]
- 9.National Committee for Quality Assurance . HEDIS 2010 Volume 2 Technical Specfications for Health Plans. 2010. [Google Scholar]
- 10.Zhang Y, Lave JR, Donohue JM, Fischer MA, Chernew ME, Newhouse JP. The impact of Medicare Part D on medication adherence among older adults enrolled in Medicare-Advantage products. Med Care. 2010;48(5):409–17. doi: 10.1097/MLR.0b013e3181d68978. [DOI] [PubMed] [Google Scholar]
- 11.Bonito A, Bann C, Eicheldinger C, Carpenter L. Creation of New Race-Ethnicity Codes and Socioeconomic Status (SES) Indicators for Medicare Beneficiaries. Final Report. Sub-Task 2. Agency for Healthcare Research and Quality; Rockville, MD: 2008. Prepared by RTI International for the Centers for Medicare and Medicaid Services through an interagency agreement with the Agency for Healthcare Research and Policy, under Contract No. 500-00-0024, Task No. 21. [Google Scholar]
- 12.Kaiser Family Foundation . In: Low-income assistance under the Medicare drug benefit. Kaiser Family Foundation, editor. Menlo Park, CA, USA: 2008. [Google Scholar]
- 13.Centers for Medicare & Medicaid Services . 2011 RxHCC Model Software. Baltimore, MD, USA: 2011. [Google Scholar]
- 14.Elixhauser A, Steiner C, Harris D, Coffey RM. Comorbidity measures for use with administrative data. Med Care. 1998;36(1):8–27. doi: 10.1097/00005650-199801000-00004. [DOI] [PubMed] [Google Scholar]
- 15.Southern D, Quan H, Ghali W. Comparison of the Elixhauser and Charlson/Deyo Methods of Comorbidity Measurement in Administrative Data. Med Care. 2004;42(4):355–360. doi: 10.1097/01.mlr.0000118861.56848.ee. [DOI] [PubMed] [Google Scholar]
- 16.Choudhry NK, Avorn J, Glynn RJ, Antman EM, Schneeweiss S, Toscano M, et al. Full coverage for preventive medications after myocardial infarction. N Engl J Med. 2011;365(22):2088–97. doi: 10.1056/NEJMsa1107913. [DOI] [PubMed] [Google Scholar]
- 17.Horne R, Weinman J. Patients’ beliefs about prescribed medicines and their role in adherence to treatment in chronic physical illness. J Psychosom Res. 1999;47(6):555–67. doi: 10.1016/s0022-3999(99)00057-4. [DOI] [PubMed] [Google Scholar]


