

Abstract
Circulating tumor cells (CTC) are shed in peripheral blood at advanced metastatic stages of solid cancers. Surface-marker-based detection of CTC predicts recurrence and survival in colorectal, breast, and prostate cancer. However, scarcity and variation in size, morphology, expression profile, and antigen exposure impairs reliable detection and characterization of CTC. We have developed a non-contact, label-free microfluidic acoustophoresis method to separate prostate cancer cells from white blood cells (WBC) through forces generated by ultrasonic resonances in microfluidic channels. Implementation of cell pre-alignment in a temperature-stabilized (±0.5°C) acoustophoresis microchannel dramatically enhanced the discriminatory capacity and enabled the separation of 5-μm microspheres from 7-μm microspheres with 99% purity. Next, we determined the feasibility of employing label-free microfluidic acoustophoresis to discriminate and divert tumor cells from WBCs using erythrocyte-lysed blood from healthy volunteers spiked with tumor cells from three prostate cancer cell-lines (DU145, PC3, LNCaP). For cells fixed with paraformaldehyde, cancer cell recovery ranged from 93.6% to 97.9% with purity ranging from 97.4% to 98.4%. There was no detectable loss of cell viability or cell proliferation subsequent to the exposure of viable tumor cells to acoustophoresis. For non-fixed, viable cells, tumor cell recovery ranged from 72.5% to 93.9% with purity ranging from 79.6% to 99.7%. These data contribute proof-in-principle that label-free microfluidic acoustophoresis can be used to enrich both viable and fixed cancer cells from WBCs with very high recovery and purity.
INTRODUCTION
Many types of cancer are diagnosed at the early stages of the disease enabling treatment with curative intent. However, many patients succumb due to metastases, and the prognosis remains unfavorable for patients with locally advanced or distant tumor dissemination. Over 90% of all cancer-related deaths are attributed to metastatic disease1. Intravasation of primary tumor cells enables hematogenous spread of cancer, although only a fraction of the tumor cells may be capable of forming a distant metastatic lesion. Further, recent findings suggest that metastasis may not be unidirectional but multidirectional, allowing cancer cells to seed distant sites as well as the primary site itself, through an experimentally validated process called “self-seeding”2. The detachment of carcinoma cells from the epithelium and subsequent invasion of underlying stroma resembles the epithelial to mesenchymal transition (EMT) in embryogenesis. The loss of E-cadherin and cytokeratins is critical to EMT, and results in dramatic changes in physical and mechanical cell properties3.
Circulating tumor cells (CTCs) are defined as tumor cells circulating in the peripheral blood, shed from a primary tumor or distant metastases4. It has been suggested that only a small fraction of CTCs have tumor-initiating or “cancer stem-cell” properties, but the CTC count in whole blood is associated with survival. Detectable levels of CTCs are mainly found at advanced metastatic stages in patients with epithelial carcinomas such as breast, colorectal, and prostate cancer5. There is little evidence that the detection of CTCs in patients with solid localized carcinomas with no documented evidence of distant spread is feasible6, and the detection of CTCs in healthy subjects and those with non-malignant tumors is very rare6, 7. Detectable numbers of CTCs in the blood are therefore most likely in patients with metastatic disease, and will correlate with other findings of metastatic disease (such as radiographic imaging), and can thus be used as a form of “liquid biopsy”.
Using the U.S. Food and Drug Administration (FDA) cleared CellSearch-assay (Veridex, Warren, NJ, USA), an association has been demonstrated between the detection of ≥ 5 CTCs in 7.5 mL of whole blood in a CellSave tube and the outcome for patients with different forms of advanced epithelial cancer. CTC enumeration is an independent predictor of both progression-free survival and overall survival in patients with metastatic disease5, 8–10. Quantitative real-time reverse-transcription polymerase chain reaction (RT-PCR)-based detection of tissue-specific transcripts has also been used to demonstrate an association between the shed of CTCs, radiographic imaging-based evidence of metastasis, and survival11. However, the data published so far show considerable discrepancies between different types of solid cancer, which may be inherent in the various kinds of epithelial cancer. The scarcity of CTCs in peripheral blood, where only a few CTCs are shed among millions of nucleated white blood cells (WBCs) and billions of red blood cells (RBCs), poses a demanding challenge in the detection and profiling of tumor cells in clinical samples12.
There is currently considerable interest in expanding and refining existing techniques to enumerate and assess the molecular profile of CTCs enriched from peripheral blood as a non-invasive means of monitoring the progress of metastatic cancer and to assess therapeutic efficacy of different modalities of treatments5, 11. Several strategies have been proposed to isolate CTCs, such as gradient centrifugation and microfilters13, physical obstacles in microchannels that capture the tumor cells14, and affinity-based approaches involving microbeads or microposts9, 15, 16. The most successful techniques for enriching CTCs from metastatic cancer patients available today employ immunolabeling. Epithelial cells in general, and epithelial derived tumor cells in particular, express the epithelial cell adhesion protein (EpCAM) and different cytokeratins (CKs)17, 18, which are absent in normal white blood cells, which express e.g. CD45. These three surface markers are common in commercially available CTC isolation methods9, 15, 19. However, subpopulations of CTCs that are either EpCAM- or CK-negative, or CD45-positive, do not fulfill the current immunolabeling-based criteria for defining CTCs using the CellSearch assay. Findings using alternative techniques, such as flow immunocytometry, suggest that there may be substantial variations in both morphology and antigen expression among CTCs, indicating that alternative and innovative approaches are required to improve CTC enrichment.
We here describe a flow-through separation approach based on acoustophoresis, which utilizes ultrasound radiation forces to provide gentle and efficient discrimination and separation of tumor cells from nucleated WBCs in a microfluidic chip. In microchannel acoustophoresis, cells are subjected to a force generated by ultrasonic resonances in the acoustically soft fluid within the acoustically rigid channel walls20. The cells in suspension are subjected to a force generated by an ultrasonic resonance. A prerequisite for such acoustic radiation forces to exist is that the channel dimensions are in concert with the ultrasound frequency. Resonance occurs when one dimension of the channel can support an integer number of half-wavelengths in the suspending fluid.
We speculated that this separation technique could be advantageous as it provides non-contact and label-free separation of tumor cells from blood, enabling recovery of tumor cells regardless of their molecular profile. This hypothesis was based on that acoustophoresis previously was shown to separate cells based on their acoustic properties and size, although it was associated with limitations regarding resolution21. To enhance the efficiency of separating tumor cells in blood from WBCs, we developed a novel acoustic pre-alignment procedure. The pre-alignment lead to improved separation efficiency compared to previous work and allows for discrimination between cancer cells and WBCs. We have evaluated the acoustophoretic platform for different types of prostate cancer cells in samples of nucleated WBCs collected from healthy donors in order to determine whether it would be feasible to use acoustophoresis to enrich rare tumor cells (such as CTCs) in peripheral blood.
METHODS
Cell culture and healthy blood donors
The human prostate cancer cell lines DU145, LNCaP, and PC3 were obtained from the American Type Culture Collection (ATCC) and grown according to ATTC recommendations. All media were supplemented with 10% fetal bovine serum (FBS) (Sigma-Aldrich), 55 IU/mL penicillin and 55 μg/mL streptomycin (Sigma-Aldrich). The cells were cultured at 37°C in a humidified atmosphere with 5% CO2. Blood was acquired from healthy volunteers at the blood donor center at Lund University Hospital, (Lund, Sweden). Vacutainer™ tubes (BD Bioscience), containing ethylenediaminetetraacetic acid (EDTA) as anti-coagulant were used.
Cell immunostaining, preparation and spiking
An aliquot of 100 μL whole blood was incubated with the fluorochrome-conjugated antibody CD45-APC (5-fold dilution) or control IgG-APC (both from BD Bioscience, San Jose, CA) at room temperature for 20 min, with subsequent isotonic lysis for 15 minutes with 1 × BD FACS lysing solution (BD Bioscience) followed by 10 min incubation with 2% paraformaldehyde (PFA). For viable cell experiments lysis was carried out using 1 × BD Pharm Lyse™ (BD Bioscience). The supernatant containing lysed erythrocytes was discarded after 5 minutes' centrifugation at 500 g, followed by two washing steps with FACS buffer (1% BSA/PBS solution (pH 7.4) supplemented with 2 mM EDTA). The cell pellets were re-suspended in FACS buffer for both fixed and viable cells.
Prostate cancer cells were detached by trypsin/EDTA treatment followed by two washing steps with FACS buffer. The cells were resuspended in FACS buffer containing the fluorochrome-conjugated antibody EpCAM-PE (5-fold dilution) or control IgG-PE antibody (both from BD Bioscience, San Jose, CA), and incubated at room temperature for 25 minutes. For the experiments with non-PFA-fixed cells, DU145 cells were subsequently stained with 7-AAD for 20 minutes. The cancer cells were subjected to RBC lysing buffers as described above, followed by two washing steps. The cancer cells were either fixed for 10 minutes using 2% PFA or directly resuspended in FACS buffer. Erythrocyte-lysed blood, (10-fold dilution) in PBS was spiked with DU145 cells (2.5 × 10⁵ mL−1) unless otherwise stated.
Microbeads for calibration
Polystyrene microspheres with diameters of 5 and 7 μm (Sigma-Aldrich Co., St. Louis, MO) ~0.01 %wt and ~0.02 %wt, respectively, were suspended in Triton X-100 (0.01%) in PBS.
Acoustophoresis chip
The acoustophoresis microchannel structure was etched in a <100> silicon wafer (∅ 76 mm × 350 μm) using standard KOH lithography, (Figs. 1A–C). The structure is comprised of an inlet for the cell suspension (1), leading to a cell pre-alignment channel (2) (10 mm × 300 μm × 150 μm), a v-shaped flow splitter (3) that divides the flow into two, passing on both sides of a central fluid inlet (4), a cell separation channel (5) (20 mm × 375 μm × 150 μm), a trifurcation outlet (6) that has one central outlet (7), and a common outlet for the two side outlets (8). Holes for fluid connections were etched from the backside of the wafer. The wafer was cut into pieces (40 mm × 3 mm) and a piece of Pyrex glass (40 mm × 3 mm × 1.1 mm) was anodically bonded to it to seal the channel structure.
Figure 1.

Overview of the acoustophoresis microfluidic chip and system. (A) Top view schematic. A suspension of cells/particles enters the system through the inlet (1), after which cells are pre-aligned in an acoustophoresis channel (2) by means of an acoustic field (a-a') in the yz-plane. The two bands of cells are bifurcated (3) to two sides of a central inlet fluid flow (4) and the pre-aligned cells are thereafter flow laminated to proximity of the walls of a separation channel (5), where the trajectories of individual cells are deflected in an acoustic field (b-b') according to their intrinsic acoustic properties and morphology. At the trifurcation outlet (6), a subgroup of cells can be selectively guided to the central outlet of the chip (7) by tuning the intensity of the second acoustic field while cells of low acoustophoretic mobility will be guided to the side outlet (8). Insets show pre-aligned (T1 on) and non-pre-aligned (T1 off) microbeads at the end of the pre-alignment channel, and 5 and 7 μm beads separated at the central outlet (T1 and T2 on). (B) Side view schematic. Cells/particles are pre aligned in the vertical direction by means of an acoustic force (c-c') to minimize the influence of the parabolic flow profile (d-d') in the channel, which may otherwise affect the trajectories of the cells. (C) A photo showing the positions of the piezoceramic transducers (9 and 10), the Peltier element that regulates the temperature (11), and the temperature sensor (12). Scale bar = 10 mm. (D) A schematic of the flow configuration for the acoustophoresis cell separation experiments. Syringe pumps drive the flow in the outlets and in the central fluid inlet. Cell suspension is drawn from the bottom of a test tube (13) by suction. The outlets are sampled via two sample loops (14), each of volume 100 μL.
A piezoceramic transducer resonant at 5 MHz (9) (PZT26, 5 mm × 5 mm) (9) was glued to the backside of the chip, directly under the cell pre-alignment channel (2). A second piezoceramic transducer resonant at 2 MHz (10) (PZT26, 15 mm × 5 mm) (10) was glued underneath the cell separation channel (5). The piezoceramic transducers were actuated using function generators (Agilent 33120A, Agilent Technologies Inc., Santa Clara, CA, USA) equipped with power amplifier circuits (LT1012, Linear Technology Corp., Milpitas, CA, USA), and the voltage over each transducer was measured using an oscilloscope (TDS 1002, Tektronix UK Ltd., Bracknell, UK). The temperature was regulated using a Peltier element (11), and a PT100 resistance temperature detector (12) was glued to the device.
Flow system setup
The fluid flow in the system was controlled by three 10 mL glass syringes (1010 TLL, Hamilton Bonaduz AG, Bonaduz, Switzerland), two of which were mounted on the same syringe pump (WPI sp260p, World Precision Instruments Inc., Sarasota, FL), maintaining both the central and side outlet flows at 280 μL/min each, (Fig. 1D). The combined flow rates of these two syringes determined the total flow rate of 560 μL/min in the separation channel. The third syringe, mounted on a separate syringe pump (neMESYS, Cetoni GmbH, Germany), infused cell-free buffer solution through the central inlet into the channel at a volume flow rate of 490 μL/min during cell experiments. Cell suspension was drawn into the side inlet from the bottom of a test tube at a flow rate of 70 μL/min, due to the net difference in flow set up by the syringe pumps. Two 6-port, 2-way sample loops (V-451, Upchurch Scientific, Oak Harbor, WA, USA) each with a volume of 100 μL (14), were connected in series to the outlets to investigate the separation performance while running the system. In the bead calibration experiments the central and side outlet flow rates were both set to 250 μL/min. The central inlet buffer flow was set to 450 μL/min, and hence the inlet rate of the bead suspension (13) was 50 μL/min.
Acoustophoresis separation procedure
PBS was infused into the system to evacuate air. The ultrasound actuation signal to the pre-alignment transducer (9) was adjusted to 4.97 MHz and a voltage of 8.5 Vpp, while the frequency of the separation transducer (10) was set to 1.94 MHz, unless otherwise stated. The ultrasound was turned on and the temperature control loop was activated. The inlet tubing of the device was immersed in 1 mL of input sample/cell mixture in a test tube (13). To minimize any effect of sedimentation of cells in the test tube, the sample was mixed gently by pipetting up and down throughout sample processing. The flow was allowed to stabilize in the system for 15 seconds before switching the two sample loops to collection mode. At least three samples were collected from each of the loops during the course of each experiment to enable analysis of the cell content at the side and center outlets.
Analysis of the outlet fractions
After the acoustophoresis cell separation procedure, the fluorescently labeled cells in the central and side outlet fractions were enumerated by flow cytometry. Leukocytes were characterized as CD45-positive and EpCAM-negative, whereas the tumor cells were classed as EpCAM-positive and CD45-negative. The fluorescence was quantified using a FACS Canto II flow cytometer and the FACSDiva software (BD Biosciences). In the viable cell experiments, DU145 cells were excluded from the analysis if they were 7-AAD-positive (i.e. dead) or if gated within the corresponding forward/side scatter region in the FACS plots.
Cell viability and proliferation
DU145, LNCaP, and PC3 cells were detached by trypsin/EDTA treatment and washed twice in PBS and then resuspended in 1% BSA/PBS. Cells were processed through the acoustophoresis microfluidic chip through the center inlet and outlet. The center outlet flow rate was set to 100 μL/min and the cell suspension was drawn into the center inlet from an Eppendorf tube at the same flow rate. The cells were exposed to 2 MHz ultrasound with amplitudes of either 10 Vpp or 20 Vpp. Cells were also run through the chip with no ultrasound exposure to reveal possible effects of the microfluidic system. Unprocessed cells were used as control. During the experiment the temperature was maintained at 37°C to limit effects resulting from high temperature exposure caused by high voltage thermal effects in the piezoceramic transducer. The Trypan blue exclusion test was used to estimate the percentage of viable cells. The percentage of viable cells was counted in a Bürker chamber. The XTT assay (Sigma-Aldrich) was used to evaluate cell viability. The cell viability was measured after 24 and 48 h using the standard XTT method (2,3-bis [2-methoxy-4-nitro-5-sulfophenyl]-2H-tetrazolium-5-carboxyanilide inner salt). The XTT assay was performed following manufacturer's recommendation and the results were expressed as the relative cell survival rate in comparison with unprocessed cells in 3 independent experiments. To estimate the effect of acoustophoresis on long-term cell proliferation, DU145 cells were counted and seeded in culture dishes. After 60 h the cells were harvested and recounted before they were seeded out for a second and third passage. The results were expressed as the relative cell proliferation rate in comparison with unprocessed cells (n=4). DU145 cell death after incubation with RBC lysing buffer was determined by flow cytometry. Cells were harvested with trypsin/EDTA, incubated for 15 min at room temperature with 1 × BD Pharm Lyse, washed with PBS and subsequently stained with 7-AAD for 20 minutes in the dark. Cell death was estimated for at least 10,000 cells by flow cytometry, 7-AAD-positive cells were defined as dead.
Statistics
The paired Student's t-test was used to compare cell proliferation during several cell passages, between cells subjected to acoustophoresis and the control cells. One-way ANOVA was used to compare cell survival after acoustophoresis at three different voltages and unprocessed control cells. Statistical significance was defined as P < 0.05.
RESULTS
Design of a microchannel acoustophoresis device to separate tumor cells from white blood cells in blood
Figures 1A and B show schematics of the acoustophoresis chip, while Figure 1C shows a photograph of the device. In the first channel, the cell pre-alignment channel, the width (w1 = 300 μm) and height (h = 150 μm) were chosen such that ultrasonic vibrations (f1 = 5 MHz) generate two acoustic pressure nodes across the width of the channel and an additional single acoustic pressure node in the vertical direction22, 23. The acoustic force deflects the cells flowing through the channel so that, near the end of this channel, the cells are confined to two parallel bands, oriented along the direction of flow, and elevated a distance h/2 above the channel floor. The two bands are bifurcated to two sides of a central buffer inlet and the cells enter a second channel laminated close to the walls.
In the second channel, the cell separation channel, the width (w2 = 375 μm) is matched to a second ultrasound frequency (f2 = 2 MHz) to generate a single acoustic pressure node in the center of the channel. The acoustic force on the pre aligned cells directs them towards the central node at a rate determined by: (i) the cell size, (ii) the cell mass density, and (iii) the cell compressibility. If one or more of these properties differ between two populations of cells, they can be considered to be acoustophoretically separable.
The lateral position of individual cells, at the trifurcation outlet of the channel, is dictated by their intrinsic properties (i–iii), the flow rate in the channel, and the magnitude of the acoustic force field. Thus, for a given volume flow rate and a given acoustic field strength, the chip can selectively transfer the subset of cells having the highest acoustophoretic mobility to the central outlet, as illustrated in (Figure 1D).
Pre-alignment of the cells in the width and height dimensions is critical as the flow velocity profile in a microchannel is strongly dependent on the position in the plane orthogonal to the direction of flow. Pre-alignment ensures that the trajectories of all cells through the channel start from identical positions in the transverse channel cross-section, thereby increasing the resolution of the separation.
Acoustophoresis microsystems have recently been reported to be sensitive to temperature changes of only 1–2°C24, with a change of 5°C being suggested to be detrimental to the performance of the device. Hence, an automated temperature control loop was implemented by incorporating a Peltier element and a thermo-resistive temperature sensor in the chip assembly, enabling the temperature to be controlled to within ± 0.5°C.
Separation of 5-μm from 7-μm microbeads
Different piezoceramic transducer voltages were used to determine the ability of the acoustophoretic microchannel device to discriminate between microbeads with diameters of 5 and 7 μm. The proportions of microbeads of each size in the fractions collected from the outlets were recorded using flow cytometry. Figure 2 shows plots of the proportion of beads collected in the central outlet to the total number of beads collected. It can be seen that the larger beads (7 μm) appeared in the central outlet at lower voltages than the smaller beads (5 μm). When acoustic pre-alignment was employed, the transition from the side outlet to the central outlet was steeper. As a result, the vast majority of the larger beads were collected at the central outlet, while the smaller beads exited through the side outlet, for voltages between 70 and 80 Vpp2. The bead suspension, initially containing a mixture of 50% of each bead size, could be separated into one central outlet fraction containing 7-μm beads and one side outlet fraction with 5-μm beads, with a mean purity of 99.2% (range: 99.1; 99.3) for the 7 μm beads, and a mean purity of 98.8% (range: 97.5; 99.9) for the 5 μm beads, respectively.
Figure 2.
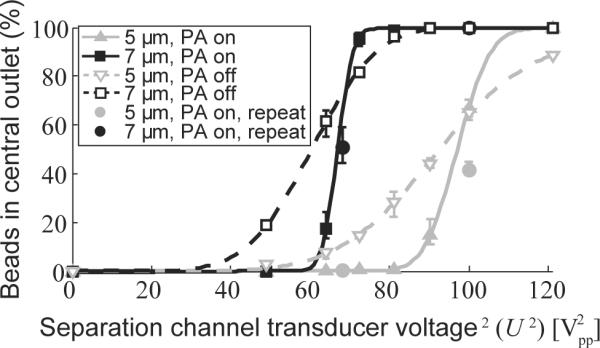
Acoustophoretic separation of microbeads. Graph showing the proportion of 5 μm beads (gray) and 7 μm beads (black) collected in the central outlet, compared to the total number of beads collected, as a function of U2, the piezoceramic transducer voltage squared. (U2 is linearly proportional to the acoustic energy density and thus also the acoustic velocity of the beads.) Experiments were performed with acoustophoresis pre-alignment (PA) on (filled symbols) or off (open symbols). Measurements were repeated at two of the voltages on a later occasion (filled circles). The lines represent fits of a cumulative distribution function to the experimental data (see Supplementary Note 1). The values given are means, the error bars denoting min and max values (n=3).
The sharp transition for the 7-μm beads allows for calibration of the system to account for any drift in performance that may occur over time. Prior to each cell experiment the system was run at different driving voltages to determine the voltages at which 50% of the 7-μm beads were collected from the central outlet. Comparison with simulated trajectories for a 7-μm bead in this particular microchannel flow configuration showed that the measured transition voltage corresponded to an acoustic energy density (Eac) of 69 J/m3. The linear relation between Eac and driving voltage squared (Upp)2 has been thoroughly studied by others20, 24. This calibration allows the driving voltage to be converted into acoustic energy density, which is used throughout the rest of this paper. Details of modeling and simulations are further described in the Supplementary Note 1 and Supplementary Figures 1 and 2.
Pre-alignment of cells allows for improved and more stable discrimination of cancer cells from WBCs
The PFA-fixed prostate cancer cells, DU145, added to RBC-lysed PFA-fixed blood were used to evaluate the benefits of cell pre-alignment before separation at different levels of acoustic energy. The recovery of cancer cells at the central outlet was found to increase at higher acoustic energies. The transition acoustic energy density (Etr) for cancer cells was approximately 30% of the energy required to focus WBCs to the central outlet. Similar to the case of the microbeads, a dramatic improvement in cell separation was observed when acoustic pre-alignment was employed. Figure 3A shows the proportion of cells collected at the central outlet relative to the total amount of cells collected, for DU145 cells (black), and WBCs (red). It can clearly be seen that a cell suspension with high cancer cell recovery can be generated at the central outlet of the system by tuning the acoustic energy level, while the WBCs are substantially depleted.
Figure 3.

Tumor cell enrichment using acoustophoretic pre-alignment of cells. RBC lysed blood spiked with prostate cancer cells were processed in the chip. The central outlet cell recovery, i.e. the proportion of cells collected from the central outlet (compared to the total amount of cells collected), was measured by flow cytometry. (A) The effects of cell pre alignment (PA) on PFA fixed DU145 cells (black), and WBCs (red). Acoustic pre alignment; on (solid lines) and off (dashed lines). (B) Separation of three different PFA-fixed prostate cancer cell lines (DU145, PC3, and LNCaP) from blood cells by acoustophoresis with pre-alignment. (C) Acoustic separation of DU145 cells (250,000 / mL) spiked in different concentrations of WBC at an energy level of 120 Vpp2, with active cell PA. (D) Separation of live DU145 cells from blood cells using acoustophoresis with PA. The values given are means, the error bars denoting min and max values.
In an attempt to address the expected diversity of CTCs in the peripheral blood of metastatic prostate cancer patients, we used three different prostate cancer cell lines in the experiments: DU145, PC3, and LNCaP. The cancer cells were added to RBC-lysed blood and processed in the chip at different levels of acoustic energy employing acoustic pre-alignment. It was found to be possible to separate each of the three cell lines from WBCs. DU145 and PC3 cells displayed very similar separation patterns, (Figure 3B). For Eac = 120 J/m3, the average recovery was 85.4% (range = 78.2/89.3%) with a WBC depletion of 99.3% (range = 99.9/98.2%). Further, for Eac = 188 J/m3, we obtained 96.6% recovery of DU145 cells (range = 93.6/97.9%) with only modestly reduced purity 97.9% (range = 97.4/98.4%). At the same energy levels, the recovery of LNCaP cells was 55.5% (range = 46.3/63.2%) and 78.8% (range = 72.9/82.9%). Cancer cell and WBC purity in the cell fractions collected at the central and side outlets are presented in (Supplementary Figure 3A).
For any given acoustic energy, the recovery of LNCaP cells was lower than that of DU145 and PC3 cells as illustrated in figure 3B. As the velocity of a cell exposed to a resonant ultrasound field scales with the square of its radius would implicate a dependency on cell size, we evaluated whether a measurable difference in cell size could contribute to the lower recovery of LNCaP compared to DU-145 or PC-3 by determining the size distribution of each population of cells from the three cell lines by FACS and Coulter counting. We found that the size distribution of the tumor cell populations were almost identical, although the PC3-cells were slightly smaller than DU145 and LNCaP. However, this would not likely explain the above reported difference in recovery of the different tumor cells though notably, the size distribution of WBCs does not overlap with those of the tumor cells (data not shown).
To elucidate whether the blood cell concentration affects the cell separation capacity of the acoustic chip, a dilution series of RBC lysed blood was obtained. No significant difference in cancer cell / WBC separation could be detected in the span of 150,000 – 3,000,000 WBCs per mL (Figure 3C), indicating that the acoustic chip can process undiluted WBC samples with high accuracy.
Acoustophoresis allows for separation of non-fixed cells
Having shown that it was possible to separate fixed cells based on their intrinsic properties with minimal pretreatment in continuous flow mode, we hypothesized that acoustophoresis could also be used to process viable cells with little if any negative impact on their intrinsic properties. However, the acoustophoretic properties of non-fixed, viable cells (as defined in Methods: Analysis of acquired outlet fractions) and PFA-fixed cells can not a priori be assumed to be identical. To assess the discriminatory accuracy of the method, viable DU145 cells were added to non-fixed RBC-lysed blood and processed in the chip at two different energy levels. The central outlet recovery of the DU145 cells was 83.7% (range = 72.5/93.9%) at Eac = 103 J/m3 while depleting 94.9% (range = 99.0/87.4%) of the WBCs, giving a cancer cell purity of 93.0% (range = 79.6/99.7%). At an acoustic energy of E = 66 J/m3, we obtained 99.5% (range = 98.5/100%) cancer cell purity at the central outlet. At this energy level, however, the recovery was a mere 36.1% (range = 25.7/54.7%), (Figure 3D and Supplementary Figure 3B). Comparison of the data obtained for the separation of PFA-fixed cells and non-PFA-fixed cells strongly suggested that changes in the intrinsic acoustic properties were mainly restricted to fixed versus non-fixed white blood cells, while the central outlet capture efficiency of fixed DU145 cells versus non-fixed DU145 cells was virtually unchanged. Notably, when we used the non-fixed DU145 cells, dead cancer cells (verified by the uptake of 7-AAD) were over-represented at the side outlet, indicating that the acoustic influence was much weaker on dead cancer cells than it was on the viable cancer cells, which were predominantly captured in the central outlet.
Acoustophoresis does not affect cell viability or proliferation
To determine whether acoustophoresis had any detectable effect on the intrinsic properties of viable cancer cells, we measured cell viability at two temperatures (25.0 ± 0.5°C and 37.0 ± 0.5°C) subsequent to acoustophoretic processing. Figure 4A shows the viability of prostate cancer cells evaluated using an XTT assay measuring the mitochondrial dehydrogenase activity in viable cells (after 24 and 48 h). We found no significant difference in cell viability between acoustophoresis treated and untreated cells for any of the prostate cancer cell lines investigated (DU145, PC3, and LNCaP). Neither did acoustophoresis affect cell proliferation or the ability of cells to be re-cultured for several passages (Figure 4B). No significant immediate or long-term effects on proliferation could be detected in the DU145 prostate cancer cells subjected to acoustophoresis compared to the untreated cancer cells. The cells were cultured for four passages following acoustophoresis. Viable and dead cells were enumerated using Trypan blue staining and counted in a Bürker chamber after each passage. The effect of RBC-lysing buffer on prostate cancer cells was also investigated. Incubation with the lysis buffer did not affect cancer cell viability, suggesting that RBC lysis may not importantly affect CTCs in patient samples (Supplementary Figure 4).
Figure 4.

Effects on cancer cell viability and proliferation. (A) Cell viability was determined by measuring the mitochondrial dehydrogenase activity in three prostate cancer cell lines: DU145, PC3, and LNCaP, 24 h and 48 h after acoustophoresis using transducer voltages of 0, 10, and 20 V. Untreated cells were used as controls and their survival rate was set to 100%. The graphs show the results from at least three separate experiments and the values given are the mean ± SD (n=4). (B) The proliferation of DU145 cells was monitored after acoustophoresis and compared to that of untreated cells. The cells were cultured for four passages of 60 h each. The number of cells at 0 h for each passage was set to 100%. The values given are the mean ± SD (n=4), and n.s. denotes non significant differences.
DISCUSSION
Acoustophoresis is a non-contact, label-free separation method that depends solely on three fundamental physical characteristics of the cells to be separated: size, density and compressibility. In this initial evaluation of the separation method, fluorescently labeled cells were merely used to assess the efficiency of cell separation by means of FACS analysis.
Since acoustophoresis is usually performed using pressure-driven microfluidics, sample dispersion due to the parabolic-like Hagen-Poiseuille flow profile normally prevents high-resolution separation. To solve this problem we developed and integrated a novel acoustic standing-wave pre-alignment step prior to acoustophoretic cell separation. As model system we demonstrated the highly discriminative separation of microbeads (5 μm and 7 μm) when operating the microfluidic system in pre-alignment mode, compared to non-pre-alignment mode, rendering complete discrimination between the two components. Based on these findings we anticipated that the separation of cancer cells from blood would be greatly improved with regard to WBCs, compared to previously reported acoustophoresis-based methods of cell separation21. A dramatic improvement was indeed seen, yielding tumor cell recoveries of 87 and 83% of fixed tumor cells (DU145 and PC3, respectively) and a corresponding WBC suppression of 99.3%, at a sample-processing rate of 4.2 mL/h using a single acoustophoresis channel.
It is evident that the acoustofluidic properties of WBCs and the populations of cells in the three prostate cancer cell lines used in this investigation may partly overlap as we could not deplete WBCs completely from the enriched tumor cells. As the size distribution of cancer cells do not overlap with that of WBCs, this implies that differences in mass density or compressibility may also affect the acoustic mobility. Further support to this speculation is provided by the fact that we obtained lower tumor cell recovery using LNCaP compared to DU145 or PC3 cells at any given acoustic energy despite very similar size distributions.
Although separation techniques relying on immunolabeling, such as the CTC-chip and the improved herringbone-chip15, 16 have shown higher selectivity than that currently available with acoustophoresis, the method of acoustophoresis cell separation including pre-alignment described in this paper offers a label-free means of extracting tumor cells from blood. The contact free microfluidic operation imposes minimal risk of sample-clogging which is a problem common to separation techniques based on physical obstacles such as micropores. Combined with the high sample throughput, this provides new possibilities to study a broader spectrum of tumor cells in the circulation
The cell viability assays carried out after pre-alignment acoustophoresis showed that the extracted tumor cells were unaffected by the acoustophoretic microchip processing, which is commonly operated at an acoustic energy density in the range of 10–100 J/m3 20, 24. These results are in good agreement with previously published findings, where unperturbed ultrasonic trapping and in-chip culturing of yeast cells over extended time periods have been successfully demonstrated25. Acoustophoresis has also been employed for the separation of blood components with no hemolysis of erythrocytes or significant release of intracellular components being observed26. Cell proliferation has also been studied showing unperturbed growth rate after exposure to an acoustic standing-wave field27–30. Recent reports have also confirmed conserved colony forming of peripheral blood progenitor cells after acoustophoretic treatment31.
The proposed method of lysing the RBCs prior to separation was shown to be feasible and should also be applicable in other microfluidic separation systems that are currently being evaluated for CTC enrichment. However, for live cell separation it is important to further investigate the effect of the lysing solution on cancer cells regarding cell function and their intrinsic acoustic properties.
A limitation of this study is that it was not feasible to generate data for samples with any clinically relevant, low concentrations of cancer cells. This is due to that the design of the sample loops, required for reliable and time efficient assessment of the outlet cell fractions, prohibited any evaluation of large sample volumes in this study. The reason for this is that the resolution at the low sample volumes accommodated by our loops (100 μL) makes it impossible to generate any reliable evaluations due to the low cell count in the depleted fractions. However, the basic theoretical principles of acoustofluidics does not suggest that acoustophoretic cell separation of blood samples containing a much lower concentration of tumor cells in the system would be likely to result in a significantly reduced recovery of cancer cells or result in importantly reduced discriminatory ability of the system.
For this technique to be clinically relevant, the current experimental setup must be transformed into an application-specific platform suitable for CTC isolation from patient blood samples. In order to target the low concentrations of CTCs anticipated in patients, typically, a sample corresponding to 10 mL of whole blood must be processed in the system. To meet this criterion within one hour of processing time the maximal cell throughput reported herein should be increased by a factor of two. This can be achieved by extending the length of the separation channel to allow for an increased flow velocity. To process larger sample volumes a peristaltic or pressure-driven flow system could be employed to aspirate sample and deliver enriched cells directly in test tubes. The sample processing rate can be further increased by extending the length of the chip and by optimization of the relative flow rates at the inlets and outlets. In microfluidic systems, large sample volumes tend to result in long process times, which may affect long-term stability. Temperature variations have been identified as the major problem regarding stability in acoustophoresis systems24, however, the temperature stabilization in the setup described here was within ±1°C ensuring separation stability.
CONCLUSIONS
This study presents the first experimental evidence that pre-alignment acoustophoresis provides an unbiased feasible means for label-free isolation of tumor cells in a background of a million of white blood cells. Further, both PFA-fixed and viable cells can be separated with high recovery of viable cells paving the way for post-analysis culturing and exposure of extracted tumor cells for testing of drug-sensitivity/resistance ex vivo. Analysis of gene expression profiles of PFA-fixed tumor cells combined with in-depth analysis of their genetic heterogeneity and rearrangements may potentially contribute improved diagnosis or prognosis. Based on the current performance of the acoustophoretic microfluidic platform which provides a separation and enrichment of tumor cells from WBCs by a discrimination ratio of ~ 102 to 103, it would be feasible to deliver a clinically informative enriched sample with 1–10 CTCs per 103–104 WBCs for e.g. subsequent gene expression profiling by RT-PCR. Therefore, we envision that our on-going developments in optimizing fluidics and enable the capacity to analyze higher sample volume will allow us to accomplish the discrimination ratios and sample throughputs required to perform a clinical evaluation of this system.
Supplementary Material
ACKNOWLEDGMENTS
The authors are grateful for financial support from the Swedish governmental agency for innovation systems, VINNOVA, CellCARE, grant No. 2009-00236, the Swedish Research Council, the Royal Physiographic Society, the Crafoord Foundation, the Carl Trygger Foundation, the SSF Strategic Research Centre (Create Health), the Swedish Cancer Society [project No. 11-0624], Fundacion Federico SA, the National Cancer Institute [grant No. R33 CA 127768-03, 1R01CA160816-01A1, and P50-CA92629], the Sidney Kimmel Center for Prostate and Urologic Cancers, and David H. Koch through the Prostate Cancer Foundation.
Abbreviations
- (7-AAD)
7-Aminoactinmycin
- (ATCC)
American Type Culture Collection
- (CTC)
circulating tumor cell
- (CK)
cytokeratin
- (EDTA)
ethylenediaminetetraacetic acid
- (EMT)
epithelial to mesenchymal transition
- (EpCAM)
epithelial cell adhesion molecule
- (FBS)
fetal bovine serum
- (PFA)
paraformaldehyde
- (RBC)
red blood cell
- (WBC)
white blood cell
REFERENCES
- (1).Society AC. In: Cancer Facts & Figures 2011. Society AC, editor. Atlanta: 2011. [Google Scholar]
- (2).Comen E, Norton L, Massague J. Nat Rev Clin Oncol. 2011;8:369–377. doi: 10.1038/nrclinonc.2011.64. [DOI] [PubMed] [Google Scholar]
- (3).Nauseef JT, Henry MD. Nat Rev Urol. 2011;8:428–439. doi: 10.1038/nrurol.2011.85. [DOI] [PMC free article] [PubMed] [Google Scholar]
- (4).Mostert B, Sleijfer S, Foekens JA, Gratama JW. Cancer Treat Rev. 2009;35:463–474. doi: 10.1016/j.ctrv.2009.03.004. [DOI] [PubMed] [Google Scholar]
- (5).Danila DC, Heller G, Gignac GA, Gonzalez-Espinoza R, Anand A, Tanaka E, Lilja H, Schwartz L, Larson S, Fleisher M, Scher HI. Clin Cancer Res. 2007;13:7053–7058. doi: 10.1158/1078-0432.CCR-07-1506. [DOI] [PubMed] [Google Scholar]
- (6).Davis JW, Nakanishi H, Kumar VS, Bhadkamkar VA, McCormack R, Fritsche HA, Handy B, Gornet T, Babaian RJ. J Urol. 2008;179:2187–2191. doi: 10.1016/j.juro.2008.01.102. discussion 2191. [DOI] [PubMed] [Google Scholar]
- (7).Allard WJ, Matera J, Miller MC, Repollet M, Connelly MC, Rao C, Tibbe AG, Uhr JW, Terstappen LW. Clin Cancer Res. 2004;10:6897–6904. doi: 10.1158/1078-0432.CCR-04-0378. [DOI] [PubMed] [Google Scholar]
- (8).Cristofanilli M, Hayes DF, Budd GT, Ellis MJ, Stopeck A, Reuben JM, Doyle GV, Matera J, Allard WJ, Miller MC, Fritsche HA, Hortobagyi GN, Terstappen LW. J Clin Oncol. 2005;23:1420–1430. doi: 10.1200/JCO.2005.08.140. [DOI] [PubMed] [Google Scholar]
- (9).Cristofanilli M, Budd GT, Ellis MJ, Stopeck A, Matera J, Miller MC, Reuben JM, Doyle GV, Allard WJ, Terstappen LW, Hayes DF. N Engl J Med. 2004;351:781–791. doi: 10.1056/NEJMoa040766. [DOI] [PubMed] [Google Scholar]
- (10).Cohen SJ, Punt CJ, Iannotti N, Saidman BH, Sabbath KD, Gabrail NY, Picus J, Morse M, Mitchell E, Miller MC, Doyle GV, Tissing H, Terstappen LW, Meropol NJ. J Clin Oncol. 2008;26:3213–3221. doi: 10.1200/JCO.2007.15.8923. [DOI] [PubMed] [Google Scholar]
- (11).Helo P, Cronin AM, Danila DC, Wenske S, Gonzalez-Espinoza R, Anand A, Koscuiszka M, Vaananen RM, Pettersson K, Chun FK, Steuber T, Huland H, Guillonneau BD, Eastham JA, Scardino PT, Fleisher M, Scher HI, Lilja H. Clin Chem. 2009;55:765–773. doi: 10.1373/clinchem.2008.117952. [DOI] [PMC free article] [PubMed] [Google Scholar]
- (12).Ross AA, Cooper BW, Lazarus HM, Mackay W, Moss TJ, Ciobanu N, Tallman MS, Kennedy MJ, Davidson NE, Sweet D, et al. Blood. 1993;82:2605–2610. [PubMed] [Google Scholar]
- (13).Wong NS, Kahn HJ, Zhang L, Oldfield S, Yang LY, Marks A, Trudeau ME. Breast Cancer Res Treat. 2006;99:63–69. doi: 10.1007/s10549-006-9181-4. [DOI] [PubMed] [Google Scholar]
- (14).Zheng S, Lin H, Liu JQ, Balic M, Datar R, Cote RJ, Tai YC. J Chromatogr A. 2007;1162:154–161. doi: 10.1016/j.chroma.2007.05.064. [DOI] [PubMed] [Google Scholar]
- (15).Nagrath S, Sequist LV, Maheswaran S, Bell DW, Irimia D, Ulkus L, Smith MR, Kwak EL, Digumarthy S, Muzikansky A, Ryan P, Balis UJ, Tompkins RG, Haber DA, Toner M. Nature. 2007;450:1235–1239. doi: 10.1038/nature06385. [DOI] [PMC free article] [PubMed] [Google Scholar]
- (16).Stott SL, Hsu CH, Tsukrov DI, Yu M, Miyamoto DT, Waltman BA, Rothenberg SM, Shah AM, Smas ME, Korir GK, Floyd FP, Jr., Gilman AJ, Lord JB, Winokur D, Springer S, Irimia D, Nagrath S, Sequist LV, Lee RJ, Isselbacher KJ, Maheswaran S, Haber DA, Toner M. Proc Natl Acad Sci U S A. 2010;107:18392–18397. doi: 10.1073/pnas.1012539107. [DOI] [PMC free article] [PubMed] [Google Scholar]
- (17).Winter MJ, Nagtegaal ID, van Krieken JH, Litvinov SV. Am J Pathol. 2003;163:2139–2148. doi: 10.1016/S0002-9440(10)63570-5. [DOI] [PMC free article] [PubMed] [Google Scholar]
- (18).Moll R, Franke WW, Schiller DL, Geiger B, Krepler R. Cell. 1982;31:11–24. doi: 10.1016/0092-8674(82)90400-7. [DOI] [PubMed] [Google Scholar]
- (19).Deng G, Herrler M, Burgess D, Manna E, Krag D, Burke JF. Breast Cancer Res. 2008;10:R69. doi: 10.1186/bcr2131. [DOI] [PMC free article] [PubMed] [Google Scholar]
- (20).Barnkob R, Augustsson P, Laurell T, Bruus H. Lab Chip. 2010;10:563–570. doi: 10.1039/b920376a. [DOI] [PubMed] [Google Scholar]
- (21).Petersson F, Åberg L, Swärd-Nilsson AM, Laurell T. Anal Chem. 2007;79:5117–5123. doi: 10.1021/ac070444e. [DOI] [PubMed] [Google Scholar]
- (22).Goddard GR, Kaduchak G. The Journal of the Acoustical Society of America. 2005;117:3440–3440. doi: 10.1121/1.1904405. [DOI] [PubMed] [Google Scholar]
- (23).Manneberg O, Svennebring J, Hertz HM, Wiklund M. Journal of Micromechanics and Microengineering. 2008;18:095025–095025. [Google Scholar]
- (24).Augustsson P, Barnkob R, Wereley ST, Bruus H, Laurell T. Lab Chip. 2011 doi: 10.1039/c1lc20637k. [DOI] [PubMed] [Google Scholar]
- (25).Evander M, Johansson L, Lilliehorn T, Piskur J, Lindvall M, Johansson S, Almqvist M, Laurell T, Nilsson J. Anal Chem. 2007;79:2984–2991. doi: 10.1021/ac061576v. [DOI] [PubMed] [Google Scholar]
- (26).Jönsson H, Nilsson A, Petersson F, Allers M, Laurell T. Perfusion. 2005;20:39–43. doi: 10.1191/0267659105pf782oa. [DOI] [PubMed] [Google Scholar]
- (27).Thevoz P, Adams JD, Shea H, Bruus H, Soh HT. Anal Chem. 2010;82:3094–3098. doi: 10.1021/ac100357u. [DOI] [PMC free article] [PubMed] [Google Scholar]
- (28).Hultstrom J, Manneberg O, Dopf K, Hertz HM, Brismar H, Wiklund M. Ultrasound Med Biol. 2007;33:145–151. doi: 10.1016/j.ultrasmedbio.2006.07.024. [DOI] [PubMed] [Google Scholar]
- (29).Pui PW, Trampler F, Sonderhoff SA, Groeschl M, Kilburn DG, Piret JM. Biotechnol Prog. 1995;11:146–152. doi: 10.1021/bp00032a005. [DOI] [PubMed] [Google Scholar]
- (30).Radel S, McLoughlin AJ, Gherardini L, Doblhoff-Dier O, Benes E. Ultrasonics. 2000;38:633–637. doi: 10.1016/s0041-624x(99)00211-5. [DOI] [PubMed] [Google Scholar]
- (31).Dykes J, Lenshof A, Astrand-Grundstrom IB, Laurell T, Scheding S. PLoS One. 2011;6:e23074. doi: 10.1371/journal.pone.0023074. [DOI] [PMC free article] [PubMed] [Google Scholar]
Associated Data
This section collects any data citations, data availability statements, or supplementary materials included in this article.