Possibilities of applying confocal microscopy on an X-ray beamline have been explored. Confocal microscopy images have the potential to give detailed, on-axis and three-dimensional views of protein crystals on a synchrotron beamline.
Keywords: synchrotron radiation, X-rays, confocal microscopy, fluorescence mode, reflection mode, crystal centering, visualization, radiation damage
Abstract
Confocal microscopy, a technique that has been extensively applied in cellular biological studies, may also be applied to the visualization and three-dimensional imaging of protein crystals at high resolution on synchrotron beamlines. Protein crystal samples are examined using a commercially available confocal microscope adapted for cryogenic use. A preliminary test using a custom confocal design adapted for beamline use is also presented. The confocal optics configuration is compatible with nonlinear imaging techniques such as two-photon excited fluorescence imaging and second harmonic generation. The possibilities of this method are explored using two modes: fluorescence and reflection confocal. In fluorescence mode, small amounts of dye are introduced into the crystal through soaking or growth conditions. Under such conditions, protein crystals are easily resolved from salts and amorphous precipitates, which do not generally take up dye. Reflection mode, which does not require dye, still exhibits greater resolution and sensitivity to surface detail than conventional wide-field microscopy as a result of the confocal optics configuration. The inherent three-dimensional nature of the method means that on-axis sample views (along the direction of the X-ray beam) can be reconstructed from an off-axis configuration, simplifying the beamline setup and providing uniquely detailed views of cryogenically cooled crystals.
1. Introduction
Many proteins are hard to crystallize, and even when the right crystallization conditions are found, they can form microcrystals rather than large crystals. Crystals often form clusters, contain imperfections and can be obscured by amorphous precipitates. A considerable amount of research has been invested in detecting crystals during crystallization trials using various optical techniques (Judge et al., 2005 ▶; Snell et al., 2005 ▶; Wampler et al., 2008 ▶; Madden et al., 2011 ▶). Similar problems exist for flash-cooled samples mounted on synchrotron beamlines. In addition to simply identifying crystals, one is faced with the problems of centering, exposure planning and assessing radiation damage. These activities require determination of the three-dimensional positions of the sample within the mounted droplet. Considerable progress has been made in automated sample centering by means of pattern recognition, a process that generally requires snapshots of the sample from multiple angles (Pothineni et al., 2006 ▶). However, the presence of multiple crystals within a cluster, or an obscuring precipitate, can present problems for this approach.
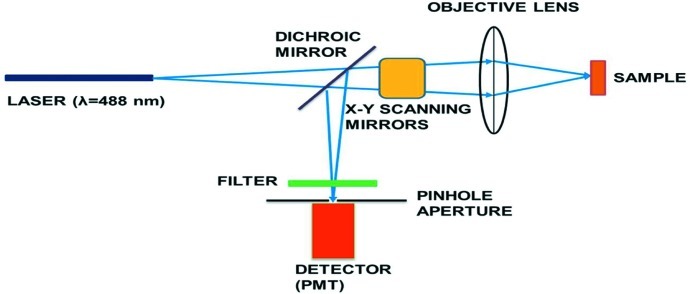
Confocal microscopy has been extensively used to obtain sharp and high-contrast three-dimensional images of biological samples (Pawley, 1995 ▶) and could be readily adapted for use on synchrotron beamlines. In a conventional (i.e. wide-field) microscope, the entire sample is evenly illuminated from a light source. All optical paths in the sample are collected at the same time, resulting in the inclusion of large amounts of unfocused background light. In contrast, a confocal microscope uses point illumination and a pinhole in an optically conjugate plane in front of the detector to eliminate out-of-focus signal (Fig. 1 ▶), resulting in a background-free image with enhanced contrast and effective resolution (Webb, 1996 ▶). The optical sectioning capability of the confocal microscope enables a three-dimensional view without actually moving or rotating the crystal. Thus on-axis sample views can be obtained without complex on-axis setup and optics. Although confocal microscopy has lateral (xy) resolution identical to a wide-field microscope, it offers dramatically improved axial (z) resolution because of its ability to optically section thick objects. Confocal optics are relatively easy to integrate with other beamline components because they can be placed at any angle.
Figure 1.
Schematic of a typical confocal microscopy system. A laser beam passes through a dichroic mirror and is focused on the sample after going through xy scanning galvanometer mirrors. The light from the illuminated focal point in the sample follows the same optical path back (conventionally known as epi detection) but is diverted via a dichroic mirror and an optional optical filter into the photomultiplier tube (PMT) for detection. A pinhole aperture of about the size of the Airy disc placed at the conjugate image plane before the detector acts to reject out-of-focus and scattered light.
In order to image crystals on the synchrotron beamline, ultraviolet (Gofron & Duke, 2011 ▶; Vernede et al., 2006 ▶) and infrared (Snell et al., 2005 ▶) microscopy have been applied in previous studies. Such studies have tended to focus on conventional two-dimensional imaging with special wavelength-appropriate optics and detectors. UV fluorescence relies on the presence of tryptophan in the proteins, which not all proteins have and many have in low quantum yield. Recently, two-photon excitation has been applied for screening protein crystallization to solve some of the technical problems inherent in UV excitation optics (Madden et al., 2011 ▶). Using visible excitation enables simpler optical components and does not require tryptophan-rich proteins for adequate visualization.
An imaging technique that relies on the second harmonic signal generated from noncentrosymmetric crystals (Wampler et al., 2008 ▶) has been investigated and commercialized (Fomulatrix, Waltham, MA, USA) for automated detection of protein crystallization in trays. The method uses a pulsed laser (typically 100 fs at an 80 MHz repetition rate) in the IR region to create a high photon density to achieve complex nonlinear optical effects. Its implementation on the beamline would be very similar to the laser scanning microscope design we are proposing here, but without the need for a confocal aperture. Although the technique may be capable of optical sectioning and taking stacks of pictures for three-dimensional imaging, it has not been tested or applied for this particular objective. This technique holds considerable promise as a means of locating and examining crystals in situ, but more research is needed on the effects of the intense illumination and the variability of crystal response, especially under cryogenic conditions.
X-ray tomography has recently been employed to yield true three-dimensional reconstructions of crystals within a droplet for the purpose of absorption correction (Brockhauser et al., 2008 ▶). Tomography requires modest sample X-ray exposure over a wide rotational range with the dose dependent upon the number of sample orientations needed for a given resolution. Tomography also involves significant computation because of the required integral transforms. These operations complicate the estimation of resolution, but generally resolution increases with decreasing detector pixel size and increasing number of orientations. Contrasting confocal and tomographic methods, tomography involves the processing of projections of multiple sample orientations, while confocal microscopy uses direct sampling of multiple optical planes. Computationally, three-dimensional reconstructions from confocal data can be performed in real time on current state-of-the-art systems. A more detailed discussion of resolution is presented in the Discussion section.
Confocal imaging can be done either in fluorescence mode, with crystals soaked in dyes or fluorescently labeled, or in reflection mode, which involves no use of dye but derives contrast from back-scattered laser light. Dyes are commonly used in crystallography to distinguish between protein and salt crystals. Dyes are thought to bind selectively to crystals owing to the presence of solvent pores, a property that salts and amorphous precipitates do not have. When injected with a dye at suitable concentration, the crystal will stain, leaving a clear dye-depleted background (Wilkosz et al., 1995 ▶) This is the so-called ‘Izit test’, named after a commercial dye sold by Hampton Research (Aliso Viejo, CA) for this purpose. This test is not definitive as different crystal structures containing 2-methyl-2,4-pentanediol (Eckert et al., 2003 ▶) or poly(ethylene glycol) (PEG; Polekhina et al., 2004 ▶) may prohibit the intake of dye (Zheng et al., 2004 ▶). We will show that, in such cases, reflection-mode confocal imaging still provides valuable information.
Diffusion of fluorescein in lysozyme protein crystals has been studied using confocal microscopy (Cvetkovic et al., 2004 ▶). Two-photon fluorescence imaging has been used successfully to study the three-dimensional distribution of fluorescently labeled impurities in protein crystals (Caylor et al., 1999 ▶). This suggests that confocal microscopy on the beamline may be useful for imaging defects and impurities induced by radiation damage.
In this study we demonstrate that confocal microscopy can be applied to an X-ray beamline for easy detection and visualization of protein crystals. The combination of enhanced effective resolution, image contrast and three-dimensional imaging could be used for automated alignment of microcrystals and for exposure planning. Novel views can be achieved, revealing interesting artefacts attributed to radiation damage.
2. Methods and materials
2.1. Crystallization
Crystals of all proteins were grown at room temperature using Hampton VDX crystallization plates (Hampton Research, Aliso Viejo, CA, USA). Following standard procedures, equal volumes of protein and well solution were combined in a hanging drop. Hen egg white lysozyme (HEWL; Hampton Research No. HR7-110; concentration 20 mg ml−1 in 0.1 M sodium acetate, NaAc, buffer) was combined on a cover slip with 0.1 M NaAc buffer solution (pH 4.6) containing 5% NaCl as precipitant (Unge, 1999 ▶). Bovine trypsin (15 mg ml−1) containing 1 mM benzamidine was combined with well solution consisting of 0.2 M (NH4)2SO4, 0.1 M Tris buffer pH 8 and 24% PEG 8000 (Kurinov & Harrison, 1996 ▶). Protein crystals were formed in a drop with 25 mg ml−1 of thermolysin (Hampton Research) in 50 mM NaOH and 0.8 M (NH4)2SO4, 0.1 M Tris buffer at pH 8.5 and 12% glycerol as well solution. Urease was transferred from its phosphate storage buffer into a 0.2 M Tris buffer pH 7.0, 1 mM EDTA and 1 mM 2-mercaptoethanol. The well solution consisted of 0.1 M HEPES buffer pH 7.5 and 1.6 M Li2SO4 (Jabri et al., 1992 ▶). Ferritin (holo) type 1, from horse spleen (Sigma–Aldrich F4503) (8 mg ml−1), prepared in 0.15 M NaCl was mixed with the following well solution: 0.6–0.8 M (NH4)2SO4, 0.1 M Tris pH 7.5 and 60–80 mM CdSO4.
2.2. Staining
Out of a variety of commercially available dyes that are known to stain protein crystals, two were chosen: fluorescein sodium salt (Sigma 46960) with an excitation wavelength of 496 nm and fluorescent emission wavelength of 518 nm, and acridine orange (Sigma 6014 BioReagent) with an excitation wavelength of 490 nm and emission wavelength of 519 nm.
Either the protein crystals were soaked with dilute solutions of the dyes or the dyes were added into the droplets before crystallization. Starting with a dye concentration of 10 mM in deionized water, solutions were diluted with the mother liquor solution of the respective protein and added into the droplets. Concentrations of dyes were optimized for best results in terms of fluorescence contrast in hanging drops.
Stock fluorescein solution (10 mM) was diluted with hanging drop well solution to yield a 0.02 mM concentration. The dilute dye (2 µl) was then injected into hanging drops consisting of 2 µl of well solution plus 2 µl of protein solution. In the case of acridine orange, 2 µl of 1 mM dilute dye solution were used. The crystals were soaked for 24 h before imaging.
2.3. Imaging at room temperature
The confocal imaging system consisted of a Zeiss LSM 510 confocal microscope equipped with a nonstandard Olympus objective lens [LMPLFLN20X, WD 10 mm, numerical aperture (NA) 0.4] as shown in Fig. 2 ▶. Images were taken either in fluorescence or in reflection mode through the glass cover slip of the Linbro plate. Images were taken either as a single image or as a stack of images along the focal axis for three-dimensional reconstruction. Stacks consisted of 20–30 images taken at a slice thickness of 5–10 µm depending upon the height of the crystal. These stacks took 1–2 minutes to collect, depending on the averaging and the number of images collected. The pinhole aperture in the confocal microscope was kept fixed at 12 µm, which corresponds to one Airy unit. The graphical program ImageJ (Rasband, 2008 ▶; Abramoff et al., 2004 ▶) was used to create three-dimensional views from a stack of images taken along the depth of the crystal.
Figure 2.
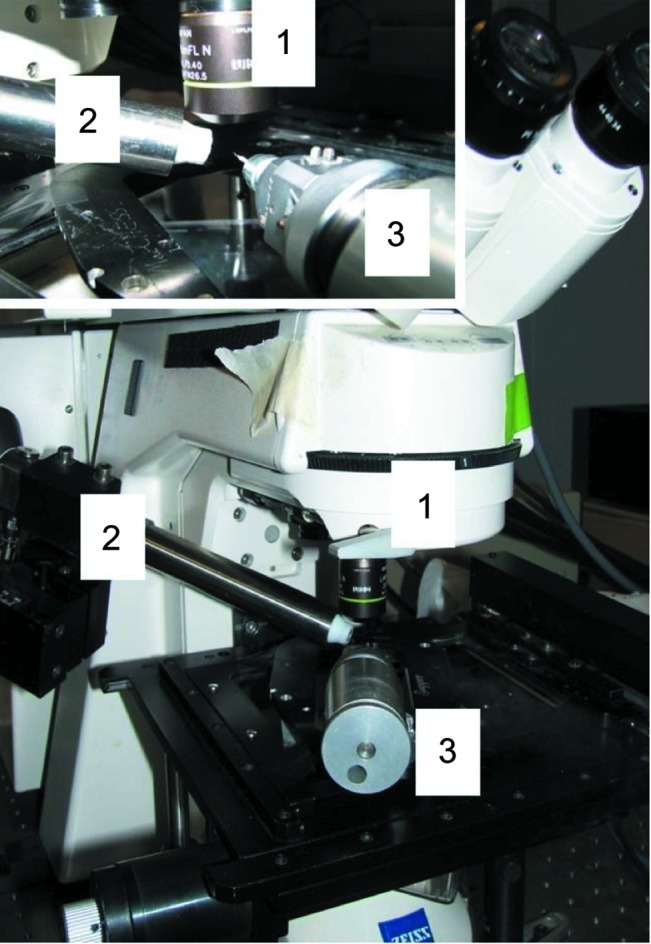
Setup used for taking images under cryogenic conditions. Zeiss 510 confocal microscope with extended objective lens (1) combined with an Oxford Cryostream 700 series (2). Crystals were mounted on a Supper spindle stage using MiTeGen MicroMounts (3).
2.4. Imaging at cryogenic temperatures
In order to evaluate the feasibility of the method for cryo-cooled samples, crystals that had been stained with fluorescent dye were soaked for cryoprotection, in a mixture of 25% glycerol and 75% mother liquor, mounted in cryo loops, and flash cooled in liquid nitrogen at 77 K. To assess possible radiation damage, the prepared samples were placed for 30–60 min in the X-ray beam at either the A1 or the F1 wiggler beamline at CHESS [both ∼1 × 10¹¹ photons s−1; 7 kGy s−1 for a 100 µm lysozyme crystal as calculated by RADDOSE (Paithankar et al., 2009 ▶)]. After X-ray exposure, the crystals were stored frozen in liquid nitrogen and mounted on a Supper spindle stage (catalogue No. 7058; Charles Supper Company Inc., Natick, MA, USA) under an Oxford Cryostream 700 cryostat operating at 100 K. The nonstandard objective lens used in this study provides an essential 10 mm working distance to keep the optics out of the cyrostream.
2.5. Design considerations for beamline operation
We constructed a prototype confocal microscope to assess feasibility and performance on the beamline (Fig. 3 ▶) The customized confocal microscope consisted of an xy galvanometer scanning mirror from Cambridge Technology (Model 6200H) and a 488 nm i-FLEX-2000 fiber-coupled 15 mW laser diode system from Qioptiq. An optical fiber from Thorlabs of 50 µm width was used as the confocal pinhole along with a photomultiplier tube (Hamamatsu R1924) as the light detector. The objective lens (the same as used in the setup in Fig. 2 ▶) was an Olympus objective lens (LMPLFLN20X, WD 10 mm, NA 0.4) mounted on a piezoelectric focusing unit (Physik Instrument, P-721) for collecting image stacks along the z axis. The current design requires a 6 × 6 × 40 cm optical cage system attached to a light-tight optical housing (25 × 20 × 10 cm) containing the scanning galvanometer mirrors and other optics. Owing to the focusing constraint of the piezo-stepper used, the preliminary setup was restricted to a sample z-scanning depth of 50 µm. The full device was mounted on the CHESS G1 beamline optical table using a standard xz motor mount.
Figure 3.
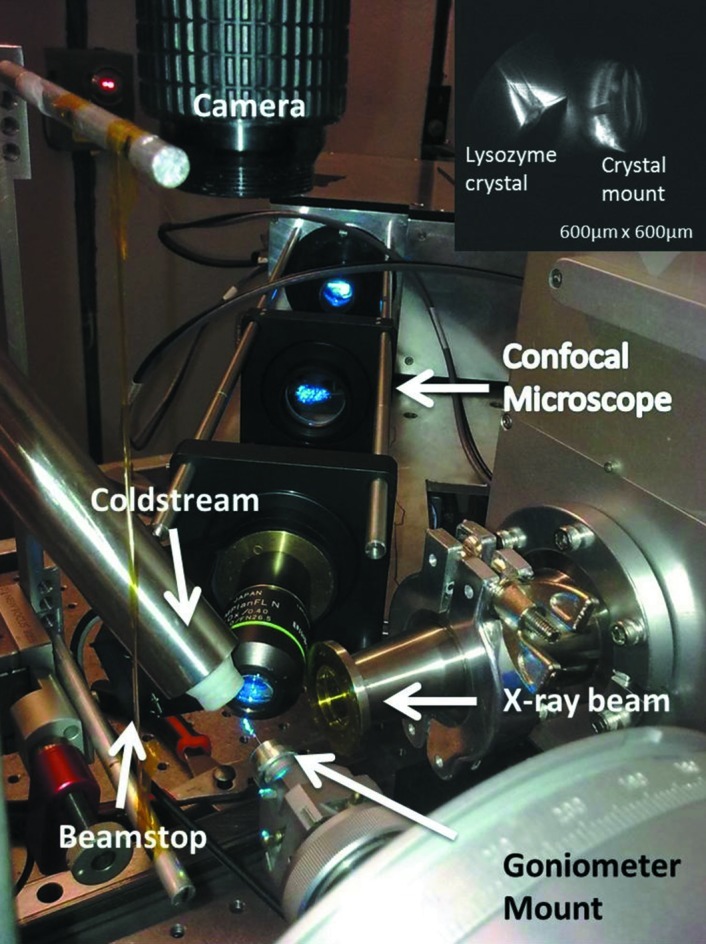
Custom-built confocal microscope tested at the CHESS G1 beamline. The optical 6 × 6 × 40 cm cage visible in the figure holds the objective and two other lenses. The 25 × 20 × 10 cm box housing the xy scanning galvanometer mirrors is partially visible at the back. A conventional microscope camera (top) was used for initial sample positioning. The inset at the top right shows an image of a lysozyme crystal presoaked in acridine orange dye. The image was taken in fluorescence mode before X-ray exposure. The confocal scanning plane illuminates the fractured top corner of the crystal on the left. Portions of the mounting loop are also illuminated (right).
3. Results
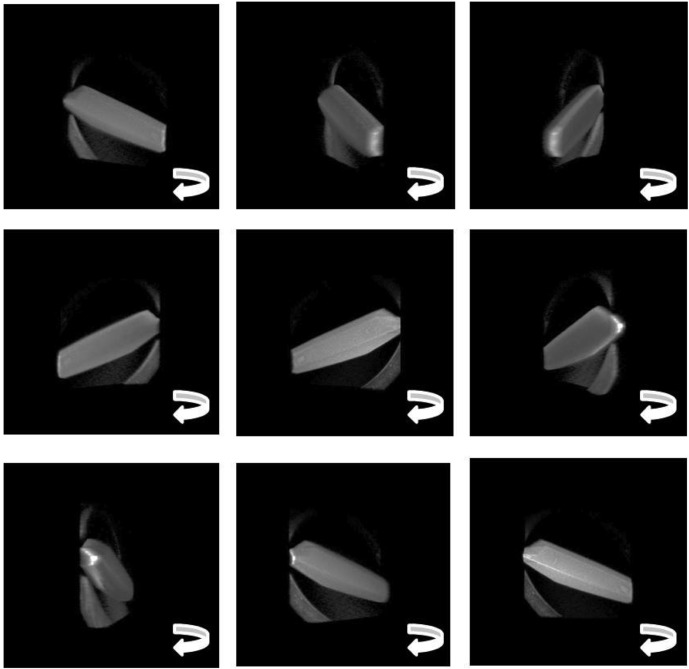
Confocal raw data consist of a series of two-dimensional slices of an object as opposed to the non-axially resolved images obtained from conventional microscopy. Fig. 4 ▶ shows a series of slices taken in fluorescence mode of a thermolysin crystal dyed with acridine orange and mounted in a loop. Each slice progressively reveals a different part of the three-dimensional shape: the back part of the crystal, the mounting loop, then finally the front-most edge of the crystal. Fig. 5 ▶ shows a series of snapshots from the movie of the three-dimensional view reconstructed from the stack of images (subset shown in Fig. 4 ▶). Full movies depicting three-dimensional rotation are given in the supplementary material for this paper.1
Figure 4.
A series of thin optical sections of 10 µm width (stack) of a thermolysin crystal taken in confocal fluorescence mode after the crystal was soaked in acridine orange dye. The frame size was 307 × 307 µm. The initial frame is the back-most part of the crystal. The sample mounting loop becomes visible in the middle frames and the front-most crystal edge is illuminated in the bottom row.
Figure 5.
Stills taken from the reconstructed three-dimensional view of a thermolysin crystal on a fiber mount (supplementary material, movie 3). The three-dimensional view was reconstructed by combining stacks of confocal images (307 × 307 µm) taken in fluorescence mode after the crystal was soaked in acridine orange dye. This series of stacks is shown in Fig. 4 ▶.
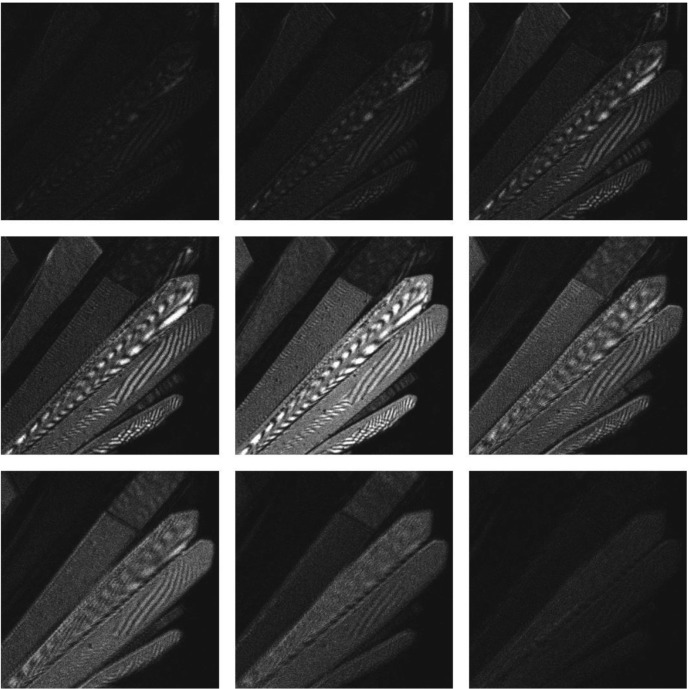
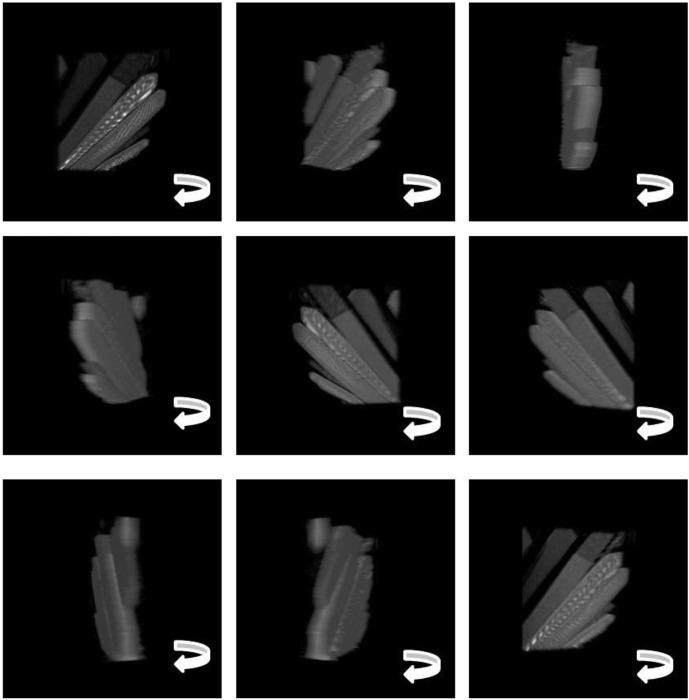
Full three-dimensional reconstructions can also be assembled from reflection-mode slices containing little or no dye. Fig. 6 ▶ shows a series of slices of a cluster of crystals (also thermolysin), each slice revealing different crystal surfaces. While reflection-mode imaging is more sensitive to crystal surface variations, as discussed below, the interference patterns visible on the crystal in this figure are most likely due to back-reflected light from the crystal interfaces. Several orientations of the three-dimensional view reconstructed from the stack of images (subset shown in Fig. 6 ▶) are shown in Fig. 7 ▶. The full movie is included in the supplement to this paper (movie 2).
Figure 6.
A series of thin optical sections of 10 µm width (stack) of thermolysin crystals taken in confocal reflection mode with no use of dye. The frame size was 191 × 191 µm.
Figure 7.
Stills taken from the reconstructed three-dimensional view of a thermolysin crystal in a drop with no dye (supplementary material, movie 2). The three-dimensional view was reconstructed by combining a stack of confocal images (191 × 191 µm) taken in reflection mode. A subset of the image stack is shown in Fig. 6 ▶.
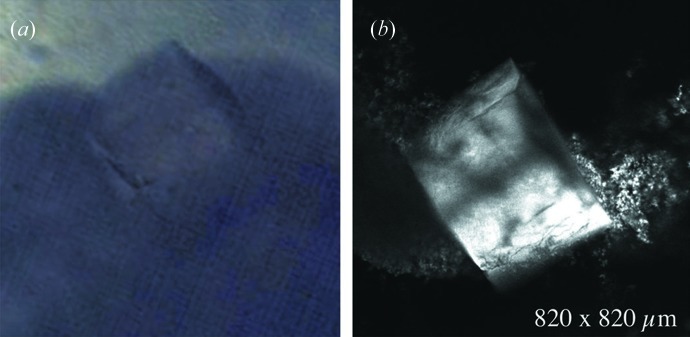
Confocal microscopy has advantages beyond simple reconstruction of three-dimensional views. A common problem when growing crystals is addressed in the following experiment: Urease crystals tend to grow in droplets with large amounts of precipitate present. It becomes challenging to recognize smaller crystals in this turbid environment. We approached this problem by adding a small amount of fluorescein dye to the turbid droplet and letting it absorb over 24 h. Fig. 8 ▶ compares views of the same crystal taken with a regular wide-field microscope (Olympus SH2 microscope) on the left and the commercial confocal microscope in fluorescence mode on the right. As a result of fluorescence, the crystal is clearly distinguished from the amorphous background. The confocal optics, however, clearly distinguish the crystal from the nearby clumps of precipitate.
Figure 8.
Urease crystal in a turbid droplet with precipitate. Images taken using (a) a regular wide-field microscope and (b) a confocal microscope in fluorescence mode at room temperature (crystal soaked in fluorescein dye). The crystal stands out in the confocal image and is clearly distinguished from the precipitate background.
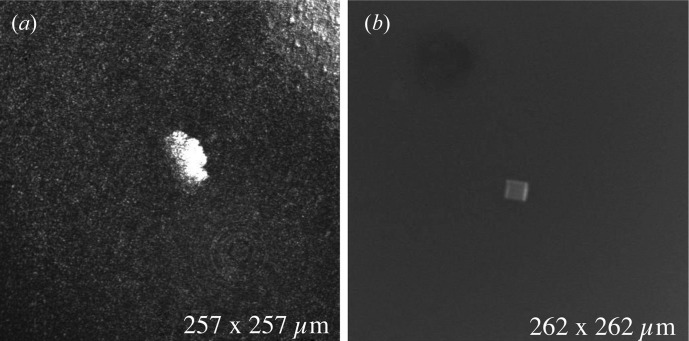
Small microcrystals were also imaged in both reflection and fluorescence mode. Small crystals (∼16 µm) of trypsin in a hanging drop were imaged using the confocal microscope as shown in Fig. 9 ▶. The image on the left was taken in reflection mode and the image on the right using fluorescence mode (acridine orange). Both modes showed good contrast with the background solution, though by using fluorescence we were able to resolve the faces and edges of the crystal while confocal reflection imaging appears to be more sensitive to precipitates surrounding the crystal.
Figure 9.
A small crystal (∼15 µm) of trypsin in a hanging drop imaged using a confocal microscope. Images taken (a) in reflection mode and (b) using fluorescence mode (acridine orange dye). Dimensions on the bottom right of each image refer to the frame size of the picture. Reflection mode picks up precipitate boundaries but fails to locate the embedded crystal. Fluorescence mode cuts through the precipitate to show the actual crystal.
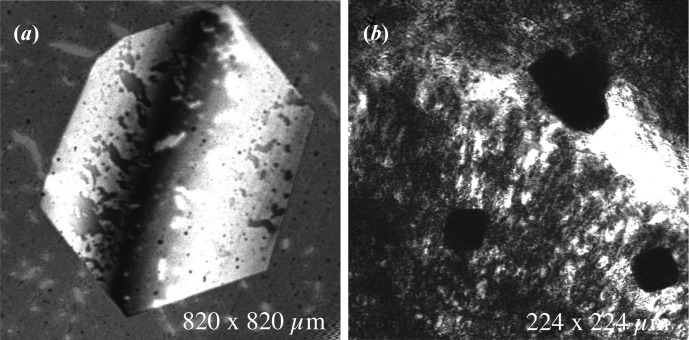
Catalase and ferritin crystals showed images of poor contrast in fluorescence mode with both fluorescein and acridine orange. This may be because they did not absorb the dye to the extent needed for fluorescence imaging. For such crystals, images were taken without soaking them in dye, taking advantage of the reflection mode of the confocal microscope. Fig. 10 ▶ shows confocal images of thermolysin (left) and ferritin (right), imaged in reflection mode, without the use of dye. The pictures were taken at room temperature in hanging drops through glass slides. The sharp contrast achieved using confocal imaging allows one to see the various details on the crystal surface such as cracks and defects in the case of thermolysin. In the case of ferritin, a naturally colored protein, the crystals appear as dark shadows with defined edges.
Figure 10.
Reflection-mode confocal images of thermolysin (a) and ferritin (b) crystals. Themolysin exhibits detailed surface features on the crystal faces at approximately 30 unit cells per pixel. In the case of ferritin, crystals appear as dark shadows with defined edges.
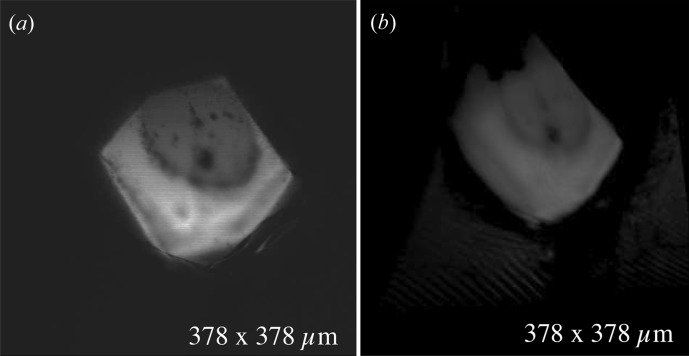
On-axis (in-line) microscope optics have become popular on beamlines because of their usefulness in exposure planning (Riekel, 2004 ▶). One of the strengths of the confocal approach is that it requires only one sample orientation and this need not be on-axis. Stacks of images taken along the depth of the crystal produce a three-dimensional volumetric data set. The three-dimensional set representing the crystal can be rendered to project a view from any desired angle. Thus a 90° off-axis microscope can, in principle, produce an on-axis-like image. Fig. 11 ▶ shows a comparison of images from two different confocal data sets. The on-axis view (Fig. 11 ▶ a) is simulated by one slice from the confocal data set. Fig. 11 ▶(b) is the on-axis-like image reconstructed from the same sample, but with the microscope direction effectively off axis by 90°. The 100 µm-diameter round dark spot in the crystal corresponds to the burn mark from a long X-ray exposure on the CHESS A1 beamline. The X-ray dose for this sample was 25 MGy based on estimates from the RADDOSE program (Paithankar et al., 2009 ▶). While the resolution of the on-axis-like image will necessarily be limited by the number of focal planes scanned, and by the inherently lower resolution along the optic axis than the lateral axis, the figure still shows the same features. Full three-dimensional reconstructions in the form of animated gif files are given for this particular data set (movie 4) and several others in the supplementary materials to this paper.
Figure 11.
On-axis image of an X-ray-exposed lysozyme crystal compared with an ‘on-axis-like’ view of the same crystal reconstructed from an off-axis microscope direction. Confocal microscopy requires only one camera direction to reconstruct a full volumetric model of the sample. Off-axis views can be obtained as projections of the volume, but with typically lower resolution that is determined by the number of focal planes scanned and by the point-spread function normal to those planes. While the on-axis view (a) gives the maximum resolution in this experiment, the same view reconstructed from a confocal scan taken 90° off axis (b) still resolves important features of the crystal.
Because commercial confocal microscopes are not practical for beamline use owing to their bulky form factor, we assembled and carried out preliminary tests of a prototype device customized for beamline use. The 6 × 6 × 40 cm optical cage and 25 × 20 × 10 cm box were mounted parallel to the optical table at the CHESS G1 beamline and 45° diagonal to the X-ray beam (Fig. 3 ▶). Confocal images of a lysozyme crystal (soaked in acridine orange dye) on a polymer mount were taken in fluorescence mode prior to X-ray exposure (shown in the inset at the top right of the figure). The bright triangular area on the left in the inset is the actual illuminated slice of the crystal. Portions of the crystal outside the focal plane are also visible as a result of enhanced contrast in this figure. The polymer mount (right) is also illuminated, either by reflection or by intrinsic fluorescence.
4. Discussion
The confocal imaging technique has been tested for frozen crystals in a cold stream environment using an Oxford Cryostream system with temperatures of 100 K. Three-dimensional views of crystals are easily achieved without actually moving or rotating the crystal. On-axis views, which are popular at beamlines and valuable for X-ray exposure planning, can be generated from three-dimensional stacks in place of in-line optics. In conventional microscopy, refraction of light in the supporting medium (vitreous ice) can cause distortion and displacement of the apparent crystal image, a problem that even in-line optics cannot resolve. Confocal microscopy allows users to choose a sample orientation in which the small incident laser beam is normal to the sample surface. Thus, lateral (xy) image distortions are minimized and off-axis reconstructions could offer unobstructed undistorted views, not obtainable by conventional microscopy. Refraction can, however, shift the apparent axial position (depth) of the laser focal spot for light passing through regions of differing index of refraction. This correction is well known (Hell et al., 1993 ▶) and easily incorporated into the software so that the depths reported are the actual values. For our case of air to ice (n = 1–1.33), the actual focus is ∼0.73 of the mechanical focus depth (at our NA of 0.4).
Optical artefacts are visible in some confocal slices and at various points during rotation of the three-dimensional reconstructed volumes (supplementary material). We have already noted the apparent interference fringes visible on the crystal faces in Fig. 6 ▶ (see also frames 10–18 in movie 2 of the supplementary material). While interference effects would not be surprising given laser coherence and flat reflective crystal faces, the origin and nature of these effects will require further investigation. The highly flat faces of crystals might also lead to unusually bright reflected light at certain angles.
Front-most crystal faces in samples also appear brighter than back faces (supplementary movie 1, for example). In these cases, fluorescent light from deeply buried slices may be reduced by transmission through thicker parts of the crystal, resulting in dark areas within the slice. This effect could be exacerbated in cases of high dye concentration. Such darkened slices could lead to reconstructions with apparent missing, truncated or indented faces. Such effects could potentially be corrected during image processing and reconstruction in the future.
Confocal microscopy, in principle, can have very good resolution down to a few hundred nanometres. It is limited mainly by the profile (FWHM) of the focal spot in the lateral (xy) and axial (z) directions. The z resolution, which determines the depth of a voxel, is typically worse and at best only half the resolution of the pixel in the lateral direction. Factors affecting axial resolution are the objective numerical aperture and the size of the confocal pinhole. Increasing the NA and/or decreasing the diameter of the pinhole will increase the z resolution. In any case the z resolution is always worse than the x y resolution. Assuming a confocal pinhole of less than 1 Airy disc unit, the best z resolution that can be realized in a typical confocal microscope system at the highest numerical aperture (∼1.4) is 0.5 µm (FWHM), which is two to three times larger than the xy resolution. The axial-to-lateral (z to xy) resolution is expected to increase as ∼1/NA. When using lower NA objectives like that required for adequate working distances on the beamline (NA = 0.4), the z resolution is approximately 5 µm while the xy resolution is 0.74 µm (Zipfel et al., 2003 ▶).
The protein crystals in this experiment were chosen to illustrate particular problems such as lack of dye uptake and formation of obscuring precipitates. As such, they do not necessarily represent protein samples as a whole. The dyes used were high-quantum-yield compounds widely used in cellular microscopy. Cryogenic temperatures did not appear to alter the fluorescence properties of the crystals sufficiently to pose any problems for confocal microscopy. Dye molecules could potentially alter crystallization conditions, compete with other ligands or induce unwanted protein conformational changes. The high quantum yield of commonly used fluorescent dyes, however, means that a crystal need absorb only small concentrations of a dye to be visible. By keeping concentrations of dye small (∼µM), the chances of altering protein behavior are minimized, as are potential light-absorption properties.
Our custom-designed confocal system, tested on CHESS G1 beamline, utilizes a low-power (15 mW) laser. Even in our preliminary tests, crystal samples typically required attenuation of the laser to avoid detector saturation. Exposure time for beamline-based confocal microscopy is thus not a limiting factor in live three-dimensional data acquisition. The current factor limiting data collection speed is mechanical scanning of the xy galvanometer scanning mirrors. With improved cooling and bi-directional scanning, we estimate that the current design could acquire 512 × 512 pixel images at two frames per second. Resonant galvanometers are able to reach speeds of up to 23 frames per second (12 kHz). Beyond 30 frames per second, z positioning requires piezo stepper hardware. Faster speeds can also be achieved by limiting the image frame size to 384 × 384 pixels or smaller.
Our prototype confocal design utilizes a 6 × 6 × 40 cm optical cage to facilitate insertion into the sample area of the crystallographic beamline. The field of view of the present model was limited to 600 × 600 µm with a 48 µm depth along the z axis. Larger z-axis ranges are easily attainable with existing stepper motor and piezo technology. The lateral field of view is customizable with a choice of objective lenses similar to conventional microscopy. For easy sample alignment, we included a vertically mounted conventional microscopy camera. A confocal system could be modified for use as a conventional microscope either by opening the pinhole aperture or by introducing a moveable mirror within the optical cage, diverting the image to a separate camera.
The optical setup used in this technique is compatible with other recently introduced forms of imaging protein crystals such as second harmonic nonlinear imaging and two-photon excitation fluorescence. While none of the existing work on these other methods (as it applies to crystallography) has focused on full three-dimensional scanning, both techniques can be adapted, in principle, to support this mode of operation. The primary difference between these methods and the confocal microscopy performed in this paper is the presence of an aperture and the power of the laser. A single experimental setup could, in principle, support all three methods.
5. Conclusions
In this study we have demonstrated that confocal microscopy is a potentially powerful technique for locating and imaging protein crystals under cryogenic conditions with good contrast either in fluorescence or in reflection mode. Individual confocal images consist of optical sections (slices) along the depth of the sample, which can be used to reconstruct full three-dimensional volumetric models without the need for sample rotation.
Microcrystals are often hard to locate and position on the synchrotron beamline, either because of their small size or because they are transparent and colorless. These problems are compounded when an amorphous precipitate is present. Crystals that do absorb dye give high-contrast images with a dark background in fluorescence mode. Those in turbid environments can be easily viewed with good contrast and distinguished from salt crystals. Small crystals, which are particularly hard to image and align on conventional setups, can also be seen with good contrast. In the case of crystals that may not absorb dye, or in situations where the dye may alter protein properties, reflection mode is still available to give useful images, albeit images that are more sensitive to cracks, defects and surface details.
Cryogenic temperatures in our samples did not alter the fluorescent properties of the dyes sufficiently to present any signal strength problems, though more systematic studies of temperature effects on dyes would be valuable. Even in the absence of fluorescence, reflection-mode confocal imaging yields surface and structural details that cannot easily be seen with conventional light microscopy.
Projected on-axis views of protein microcrystals were obtained by reconstructing images taken from an off-axis direction. Therefore, this technique can be regarded as an alternative to setups where in-line optics can only be implemented with difficulty or where samples cannot be easily rotated. Further, confocal microscopy offers the possibility of views of crystals from directions that would be obscured by the sample holder or distorted by refraction in ordinary microscopy.
Supplementary Material
. DOI: 10.1107/S002188981203470X/he5548sup1.gif
Movie 1
. DOI: 10.1107/S002188981203470X/he5548sup2.gif
Movie 2
. DOI: 10.1107/S002188981203470X/he5548sup3.gif
Movie 3
. DOI: 10.1107/S002188981203470X/he5548sup4.gif
Movie 4
Supplementary material file. DOI: 10.1107/S002188981203470X/he5548sup5.pdf
Captions to movie files
Acknowledgments
The housing for the confocal prototype was designed by Mike Cook and assembled and mounted by Scott Smith and Bill Miller. Thanks also to Arthur Woll for access to the CHESS G1 beamline for prototype testing and to the CHESS machine shop staff for fabrication. This work is based upon research conducted at the Cornell High Energy Synchrotron Source (CHESS), which is supported by the National Science Foundation and the National Institutes of Health/National Institute of General Medical Sciences under NSF award DMR-0936384, using the Macromolecular Diffraction at CHESS (MacCHESS) facility, which is supported by award GM-103485 from the National Institute of General Medical Sciences Health, National Institutes of Health. WRZ and RW acknowledge support from NIH/NIBIB P41 RR04224.
Footnotes
Supplementary material for this paper is available from the IUCr electronic archives (Reference: HE5548). Services for accessing this material are described at the back of the journal.
References
- Abramoff, M. D., Magalhaes, P. J. & Ram, S. J. (2004). Biophotonics Int. 11, 36–42.
- Brockhauser, S., Di Michiel, M., McGeehan, J. E., McCarthy, A. A. & Ravelli, R. B. G. (2008). J. Appl. Cryst. 41, 1057–1066.
- Caylor, C. L., Dobrianov, I., Kimmer, C., Thorne, R. E., Zipfel, W. & Webb, W. W. (1999). Phys. Rev. E, 59, R3831–R3834.
- Cvetkovic, A., Straathof, A. J., Hanlon, D. N., van der Zwaag, S., Krishna, R. & van der Wielen, L. A. (2004). Biotechnol. Bioeng. 86, 389–398. [DOI] [PubMed]
- Eckert, K., Ernst, H. A., Schneider, E., Larsen, S. & Lo Leggio, L. (2003). Acta Cryst. D59, 139–141. [DOI] [PubMed]
- Gofron, K. J. & Duke, N. E. C. (2011). Nucl. Instrum. Methods Phys. Res. Sect. A, 649, 216–218.
- Hell, S., Reiner, G., Cremer, C. & Stelzer, E. H. K. (1993). J. Microsc. 169, 391–405.
- Jabri, E., Lee, M. H., Hausinger, R. P. & Karplus, P. A. (1992). J. Mol. Biol. 227, 934–937. [DOI] [PubMed]
- Judge, R. A., Swift, K. & González, C. (2005). Acta Cryst. D61, 60–66. [DOI] [PubMed]
- Kurinov, I. V. & Harrison, R. W. (1996). Protein Sci. 5, 752–758. [DOI] [PMC free article] [PubMed]
- Madden, J. T., DeWalt, E. L. & Simpson, G. J. (2011). Acta Cryst. D67, 839–846. [DOI] [PMC free article] [PubMed]
- Paithankar, K. S., Owen, R. L. & Garman, E. F. (2009). J. Synchrotron Rad. 16, 152–162. [DOI] [PubMed]
- Pawley, J. B. (1995). Editor. Handbook of Biological Confocal Microscopy, 3rd ed. New York: Springer.
- Polekhina, G., Giddings, K. S., Tweten, R. K. & Parker, M. W. (2004). Acta Cryst. D60, 347–349. [DOI] [PubMed]
- Pothineni, S. B., Strutz, T. & Lamzin, V. S. (2006). Acta Cryst. D62, 1358–1368. [DOI] [PubMed]
- Rasband, W. S. (2008). Image J. US National Institutes of Health, Bethesda, Maryland, USA. http://rsb.info.nih.gov/ij/.
- Riekel, C. (2004). J. Synchrotron Rad. 11, 4–6. [DOI] [PubMed]
- Snell, E. H., van der Woerd, M. J., Miller, M. D. & Deacon, A. M. (2005). J. Appl. Cryst. 38, 69–77.
- Unge, T. (1999). Protein Crystallization: Techniques, Strategies and Tips, edited by T. M. Bergfors. La Jolla: International University Line.
- Vernede, X., Lavault, B., Ohana, J., Nurizzo, D., Joly, J., Jacquamet, L., Felisaz, F., Cipriani, F. & Bourgeois, D. (2006). Acta Cryst. D62, 253–261. [DOI] [PubMed]
- Wampler, R. D., Kissick, D. J., Dehen, C. J., Gualtieri, E. J., Grey, J. L., Wang, H. F., Thompson, D. H., Cheng, J. X. & Simpson, G. J. (2008). J. Am. Chem. Soc. 130, 14076–14077. [DOI] [PMC free article] [PubMed]
- Webb, R. H. (1996). Rep. Prog. Phys. 59, 427–471.
- Wilkosz, P. A., Chandrasekhar, K. & Rosenberg, J. M. (1995). Acta Cryst. D51, 938–945. [DOI] [PubMed]
- Zheng, R., Zheng, X., Dong, J. & Carey, P. R. (2004). Protein Sci. 13, 1288–1294. [DOI] [PMC free article] [PubMed]
- Zipfel, W. R., Williams, R. M. & Webb, W. W. (2003). Nat. Biotechnol. 21, 1368–1376. [DOI] [PubMed]
Associated Data
This section collects any data citations, data availability statements, or supplementary materials included in this article.
Supplementary Materials
. DOI: 10.1107/S002188981203470X/he5548sup1.gif
Movie 1
. DOI: 10.1107/S002188981203470X/he5548sup2.gif
Movie 2
. DOI: 10.1107/S002188981203470X/he5548sup3.gif
Movie 3
. DOI: 10.1107/S002188981203470X/he5548sup4.gif
Movie 4
Supplementary material file. DOI: 10.1107/S002188981203470X/he5548sup5.pdf
Captions to movie files


