Abstract
Objective
The paper presents a new trend of weight-for-height index of 2397 school children (1268 boys and 1129 girls) aged 6.5-11.5 years by sex in a representative sample from primary schools of Shiraz (Southern Iran) at an interval of 15 years (1988–2003) and its relation to the Center for Disease Control and Prevention (CDC) data (2000).
Methods
The data relate to a multi-stage random sample of healthy school children in Shiraz, southern Iran, collected in 2002–2003 academic year. The mean±SD age of these children was 9.1±1.4 yaers. The weight and height were estimated as 28.2±6.9 kg and 131.3±9.6 cm, respectively. Cross-sectional weight-for-height curves were constructed for both sexes. Parametric Lambda-Median-Standard Deviation (LMS) method was applied to estimate weight-for-height centiles.
Findings
Weight-for-height centiles for boys and girls were nearly close to each other, except for the children of older age in which boys' centiles lay below those of girls. Centiles of the present study lay above previous ones. In both sexes CDC weights were greater than those of Iranians for a given height. This discrepancy was more pronounced in extreme high centiles.
Conclusion
The necessity for updating local weight-for-height reference data for clinical work in Iran is emphasized. The positive trend in weight-for-height had been influenced by socio-economic development and improvement of health indicators in Iran during the post war reconstruction period.
Keywords: Body weight, Body height, Charts, CDC, Children
Introduction
The rapid increase in childhood overweight and obesity in recent decades represents a major health problem, not only in the Western world[1–3], but also in developing countries[4]. There is certainly a need for a simple method to assess overweight or underweight in children, which weight-for-height standards appear to satisfy[5].
Weight-for-height is generally defined as a quantity which measures shape largely independent of size. It is widely used in nutritional status assessment because shape is felt to be, in the broadcast sense, indicative of body composition[6]. The value of weight-for-height as a screening tool is particularly marked in two areas of public health, viz. protein-energy malnutrition and obesity[7]. The main advantage of this index is that it can be used when the child's age is either unknown or unreliable, as is often the case in the developing world[8]. On the other hand weight and height are highly correlated during childhood so that children's weight centiles tend to be strongly influenced by their height centiles[9].
The aim of this paper is to update weight-for-height charts of South Iranian school children and compare the weight-for-height centiles references of a representative sample of 2397 school children of Shiraz aged 6.5–11.5 years and born at least 2 years after the 8-year imposed war of Iraq against Iran (1980-1988) and carried out in 2003 with their peers in a representative sample of 1207 school children carried out in 1988 and fully described elsewhere[8]. Although, this issue in children of developed countries is well documented[10–12], there is no study in Iran about secular trend of weight-for-height charts. Only one study in Iran studied the secular trend of weight and height independently[13]. In addition, this paper explores the relationships of South Iranian weight-for-height reference centiles with those of CDC centiles in 2000.
Subjects and Methods
The current study is cross-sectional and includes measurements of height and weight of 2397 healthy school children (1268 boys and 1129 girls) aged 6.5-11.5 years that were randomly selected in multistage method forming a 2% of the school children from the four educational districts of Shiraz, the capital of Fars province and one of the five principal cities of Iran, with a population of 1.5 million of whom 87.2% are literate, in academic year of 2002-2003. Therefore, this can be considered as a representative sample of urban children of Iran.
Height and weight were measured to the 0.1 cm and 0.1 kg respectively, using a SECA marked stadiometer and the techniques presented by Cameron and fully described elsewhere[9]. The data were compared with a cross-sectional study of 1207 school children of the same age carried out 15 years earlier (1988) who experienced at least 6 years of the imposed war of Iraq against Iran started in 1980 and ceased fire in 1988[8].
The LMS method was applied to calculate smoothed weight-for-height related centiles. This method summarizes the changing distribution by three curves representing the median, coefficient of variation and skewness, the latter expressed as a Box-Cox power. Using penalized likelihood the three curves can be fitted as cubic splines by non-linear regression, and the extent of smoothing required can be expressed in term of smoothing parameters or equivalent degree of freedom[14, 15].
LMS chart maker (professional)[16] and Excel softwares were used for construction weight-for-height centiles.
Findings
Table 1 presents the mean and coefficient of variation of heights and weights of children by age and sex. Boys' heights were larger than girls up to age 8.5 years and then the trend changed. In addition, boys' weights were greater for all groups except for the last one. It can be seen that the variation as measured by the coefficient of variation increased constantly for height and weight in both sexes with age except for boys in the last group. However, weight was fourfold more variant than height.
Table 1.
Mean and Coefficient of Variation (CV; %) of height (cm) and weight (kg) of school children by age and sex, Shiraz (Iran), 2003
| Age(Years) | Number | Height (cm) | CV (height) | Weight (Kg) | CV (weight) | |||||
|---|---|---|---|---|---|---|---|---|---|---|
| Boys | Girls | Boys | Girls | Boys | Girls | Boys | Girls | Boys | Girls | |
| 6.5–7.49 | 210 | 165 | 119.6 | 119.3 | 4.3 | 4.3 | 21.9 | 21.8 | 14.1 | 15.1 |
| 7.5–8.49 | 205 | 193 | 124.8 | 124.3 | 4.4 | 4.2 | 24.4 | 24.1 | 16.8 | 14.9 |
| 8.5–9.49 | 229 | 204 | 130.4 | 130.1 | 4.6 | 4.7 | 27.7 | 27.2 | 19.5 | 18.0 |
| 9.5–10.49 | 239 | 229 | 135.5 | 135.9 | 4.5 | 4.6 | 30.8 | 30.5 | 20.4 | 19.3 |
| 10.5–11.5 | 261 | 254 | 139.6 | 141.6 | 4.4 | 5.0 | 33.1 | 34.6 | 18.4 | 21.1 |
| Total | 1144 | 1047 | - | - | - | - | - | - | - | - |
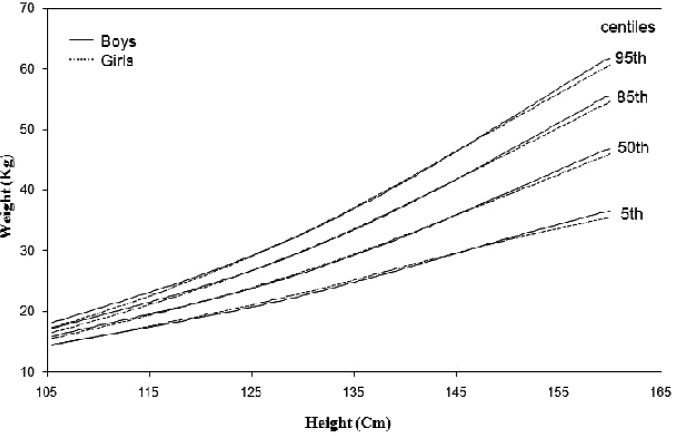
Fig. 1 illustrates the weight-for-height reference charts of boys and girls. As illustrated for all centiles boys' and girls' charts were nearly close to each other, even in some parts they correspond each other exactly, except for the older children where the boys' centiles lay below the girls'.
Fig. 1.
Comparison of weight-for-height charts of boys and girls of Shiraz (Southern Iran), aged 6.5–11.5 years, 2003
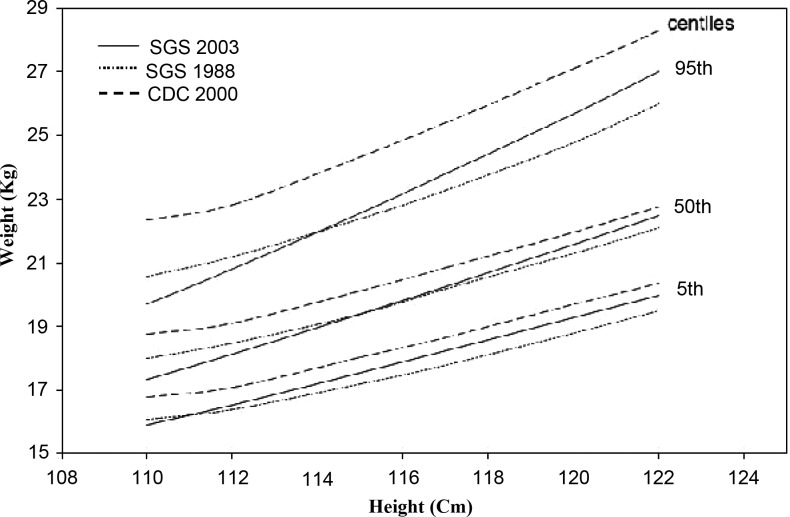
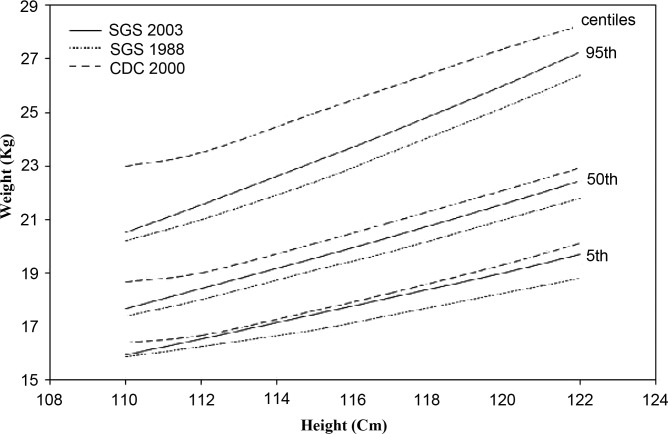
In addition, figures 2 and 3 compare charts of weight-for-height centiles in the present study (SGS 2003) with the old one carried out in 1988 (SGS 1988)[8] and CDC (2000) standards. There is an overall trend towards higher values in both sexes for the present study. As indicated in figure 2 and 3 all centiles lay above SGS 1988 data. Although for shorter boys (shorter than 114 cm) the previous centiles were higher, this difference was trivial. The positive trend shows that our children are now more obese than their peers about 15 years ago were.
Fig. 2.
Comparison of weight-for-height charts of boys: Shiraz Growth Study (SGS) 2003 vs 1988 and CDC 2000
Fig. 3.
Comparison of weight-for-height charts of girls: Shiraz Growth Study (SGS) 2003 vs 1988 and CDC 2000
Furthermore, these figures show that in both cases CDC weights were greater than those of Iranian children for a given height. This discrepancy was more pronounced for extreme upper centiles, so our children are, thinner than their peers in the USA.
Discussion
As indicated in figure 1 the boys' and girls' centiles are very close to each other, up to 145 cm height, the girls' centiles lie above those of the boys, indicating the effect of pubescent ages on the growth indices that occur sooner for girls than for boys.
As figures 2 and 3 illustrate, there has been a positive trend in weight-for-height index in Shiraz as compared with SGS 1988[8]. The upward shift is evident for all percentiles and is Shiraz as compared with SGS 1988[8]. The upward shift is evident for all percentiles and is more pronounced in the upper centiles. This may be due to changes in lifestyle such as socioeconomic, health and cultural developments as well as modernization process in Iran in post war reconstruction period. In addition, changing dietary habits and physical activity patterns due to rapid urbanization and modernization and technological transformation can influence this secular trend in weight-for-height index as a reliable measure of obesity, especially when the age is unknown or unreliable[7, 8]. Therefore, our data supports the fact that update local standard centiles should be used.
A major difference between the present study and previous one is the statistical method that was applied for constructing reference chart. In the present study parametric LMS method was used, this method has the advantage that after a suitable power transformation the data are normally distributed and provide more smooth centiles. Another advantage of the LMS method is that the three curves, L, M and S, completely summarize the measurement's distribution over the range of covariates, and in addition they may be interest in their own right. A key assumption of the LMS method is that after a suitable power transformation the data are normally distributed. Anthropometric measurements, particularly weight and height, tend to follow this pattern[14]. In the previous study nonparametric Healy-Rasbash-Yang (HRY) method[17] was applied. Before applying this method on anthropometric measurements, for normalizing the variables some transformation such as log transformation should be applied.
These figures show that Iranian weight-for- height index charts lie below those of CDC standards and these discrepancies were more pronounced in the upper centiles in both sexes. A main advantage of this study is that our method is comparable with CDC, since both studies have applied parametric LMS method.
One should notice that, no widespread malnutrition is reported in Iran and the subjects were healthy school children. As a result this supports the fact that local growth standards should be used for assessing nutritional and growth status. The previous studies in Iran confirmed our findings too; however, most of them were conducted on the infants’ population[18–20].
Most of the previous studies used Body-Mass-Index (BMI) as a measure of obesity and in assessing a new trend in growth[21–25], fewer studies used weight-for-height for this purpose[10–12]. This index has a main advantage over BMI, as it can be used when the child's age is either unknown or unreliable, as is often the case in the developing world[8].
Although age independence of weight-for-height is a useful statistical assumption, it is not quite true generally. Age dependence in the weight-for-height relationship is most marked in the first year of life and again at puberty[5–7].
Cole presented a method for the assessment of weight-for-height which he claimed to overcome age independence in the weight-height relationship[26], but Ayatollahi showed that his method leads to errors in the assessment of Iranian school children; therefore he presented a new method for solving this problem that is simple and stable and is likely to be useful for any sort of growth data[5]. CDC assumed age independency in constructing of weight-for-height charts[27].
Therefore, for comparative purposes the same line was followed in this paper. However, age dependency in weight-for-height has been examined by the principal author[6, 7] and a unified pattern standard score method for its construction proposed[8], which can be validated in a coming paper.
Conclusion
The paper provided local weight-for-height charts for Shirazi (South Iran) school children which should be updated periodically. The authors suggested such studies in other provinces of Iran. Until then, these charts are likely to present weight-for-height charts of urban school children for Iran, as the demographic as well as general structure of Shiraz is similar to other principal cities of Iran. Weight-for-height proved to be a simple tool for assessing human obesity. On the other hand, socio-economic development and improvement of health indicator in Iran may be among the causes of positive trend in growth status of our children.
Acknowledgment
This work was supported by a grant 86–3723 from Shiraz University of Medical Sciences Research Council.
Conflict of Interest
None
References
- 1.Chinn S, Rona RJ. Prevalence and trends in overweight and obesity in three cross-sectional studies of British children 1974–94. BMJ. 2001;322(7277):24–6. doi: 10.1136/bmj.322.7277.24. [DOI] [PMC free article] [PubMed] [Google Scholar]
- 2.Fredriks AM, van Buuren S, Wit JM, et al. Body index measurements in 1996-7 compared with 1980. Arch Dis Child. 2000;82(2):107–12. doi: 10.1136/adc.82.2.107. [DOI] [PMC free article] [PubMed] [Google Scholar]
- 3.Lobstein T, Frelut ML. Prevalence of overweight among children in Europe. Obesity Review. 2003;4(4):195–200. doi: 10.1046/j.1467-789x.2003.00116.x. [DOI] [PubMed] [Google Scholar]
- 4.Mendez MA, Monteiro CA, Popkin BM. Overweight exceeds underweight among women in most developing countries. Am J Clin Nutr. 2005;81(3):714–21. doi: 10.1093/ajcn/81.3.714. [DOI] [PubMed] [Google Scholar]
- 5.Ayatollahi SMT. Age standardization of weight-for-height in children using a unified Z-score method. Ann Human Biol. 1995;22(2):151–62. doi: 10.1080/03014469500003802. [DOI] [PubMed] [Google Scholar]
- 6.Ayatollahi SMT. Age-related weight-for-height charts for south Iranian school children. J Trop Pediatr. 1995;41(3):181–5. doi: 10.1093/tropej/41.3.181. [DOI] [PubMed] [Google Scholar]
- 7.Ayatollahi SMT. A unified pattern standard score method for construction of age-related weight-for-height. J Tropical Pediatr. 1995;41(3):169–73. doi: 10.1093/tropej/41.3.169. [DOI] [PubMed] [Google Scholar]
- 8.Ayatollahi SMT. Weight-for-height of South Iranian school children and the NCHS reference data. Int J Obes. 1993;17(8):471–4. [PubMed] [Google Scholar]
- 9.Ayatollahi SMT. A comparative study of reference data for Body Mass Index of school children in Shiraz (Southern Iran) and CDC standards. Iranian Red Cresc Med J. 2007;9(4):185–90. [Google Scholar]
- 10.Chinn S, Rona RJ. Secular trends in weight, weight-for-height and triceps skinfold thickness in primary schoolchildren in England and Scotland from 1972 to 1980. Ann Hum Biol. 1987;14(4):311–9. doi: 10.1080/03014468700009101. [DOI] [PubMed] [Google Scholar]
- 11.Hughes JM, Li L, Chinn S, et al. Trends in growth in England and Scotland, 1972 to 1994. Arch Dis Childh. 1997;76(3):182–9. doi: 10.1136/adc.76.3.182. [DOI] [PMC free article] [PubMed] [Google Scholar]
- 12.Roelants M, Eide GE, Hauspie R, et al. Overweight and obesity in Norwegian children: Secular trends in weight-for-height and skinfolds. Acta Pædiatrica. 2007;96(9):1333–7. doi: 10.1111/j.1651-2227.2007.00421.x. [DOI] [PubMed] [Google Scholar]
- 13.Ayatollahi SMT, Pour-ahmad S, Shayan Z. Secular trend in growth among school children of Shiraz (southern Iran) born in post-war period. Med J Islamic Republic Iran. 2006;20(3):147–50. [Google Scholar]
- 14.Cole TJ, Green PJ. Smoothing reference centile curves: The LMS method and penalized likelihood. Stat Med. 1992;11(10):1305–19. doi: 10.1002/sim.4780111005. [DOI] [PubMed] [Google Scholar]
- 15.Cole TJ. Fitting smoothed centile curves to reference data. J Royal Stat Soc. 1988;15(3):385–418. [Google Scholar]
- 16.Pan H, Cole TJ. User's guide to lmschartmaker; Medical Research Council, UK. 1997-2005. [Google Scholar]
- 17.Healy MJR, Rasbash J, Yang M. Distribution-free estimation of age-related centiles. Ann Hum Biol. 1988;15(1):17–22. doi: 10.1080/03014468800009421. [DOI] [PubMed] [Google Scholar]
- 18.Heydari ST, Emamghoreishi F, Amini M. Infants’ growth charts in Jahrom, Iran. Iran J Pediatr. 2009;19(1):25–34. [Google Scholar]
- 19.Mohammadi M, Emadi H, Gholam-Alian A. Are NCHS growth charts useful in Iran? Iran J Pediatr. 2000;10(1):17–23. [Google Scholar]
- 20.Majlesi F, Nikpoor B, Golestan B, et al. Growth chart study in children under 5 years old in rural area of Khoramabad province. Iran J Public Health. 2001;30(3-4):107–10. [Google Scholar]
- 21.Schröder H, Elosua R, Vila J, et al. Secular trends of obesity and cardiovascular risk factors in a Mediterranean population. Obesity. 2007;15(3):557–62. doi: 10.1038/oby.2007.574. [DOI] [PubMed] [Google Scholar]
- 22.Meigena C, Keller A, Gauschea R, et al. Secular trends in body mass index in German children and adolescents: a cross-sectional data analysis via CrescNet between 1999 and 2006. Metab Clin Exper. 2008;57(7):934–9. doi: 10.1016/j.metabol.2008.02.008. [DOI] [PubMed] [Google Scholar]
- 23.Lahti-Koski M, Jousilahti P, Pietinen P. Secular trends in body mass index by birth cohort in eastern Finland from 1972 to 1997. Int J Obesity. 2001;25(5):727–34. doi: 10.1038/sj.ijo.0801588. [DOI] [PubMed] [Google Scholar]
- 24.Tremblay MS, Willms JD. Secular trends in the body mass index of Canadian children. CMAJ. 2000;163(11):1429–33. [PMC free article] [PubMed] [Google Scholar]
- 25.Lazarus R, Wake M, Hesketh K, et al. Change in body mass index in Australian primary school children, 1985-1997. Int J Obesity. 2000;24(6):679–84. doi: 10.1038/sj.ijo.0801218. [DOI] [PubMed] [Google Scholar]
- 26.Cole TJ. A method for assessing age-standardized weight-for-height in children seen cross-sectionally. Ann Hum Biol. 1979;6(3):249–68. doi: 10.1080/03014467900007252. [DOI] [PubMed] [Google Scholar]
- 27.CDC Growth Charts: United States. Advanced Data 2000 (Revised), No. 314. [PubMed] [Google Scholar]


