Abstract
Objective
Growth charts are widely used to assess children's growth status and can provide a trajectory of growth during early important months of life. Racial differences necessitate using local growth charts. This study aimed to provide standardized growth curves of body mass index (BMI) for children living in northeast Iran.
Methods
A total of 23730 apparently healthy boys and girls aged 25 to 60 months recruited for 20 days from those attending community clinics for routine health checks. Anthropometric measurements were done by trained health staff using WHO methodology. The LMSP method with maximum penalized likelihood, the Generalized Additive Models, the Box-Cox power exponential distribution distribution, Akaike Information Criteria and Generalized Akaike Criteria with penalty equal to 3 [GAIC(3)], and Worm plot and Q-tests as goodness of fit tests were used to construct the centile reference charts.
Findings
The BMI centile curves for boys and girls aged 25 to 60 months were drawn utilizing a population of children living in northeast Iran.
Conclusion
The results of the current study demonstrate the possibility of preparation of local growth charts and their importance in evaluating children's growth. Also their differences, relative to those prepared by global references, reflect the necessity of preparing local charts in future studies using longitudinal data.
Keywords: Body Mass Index, Growth Charts, Anthropometry, Children, Reference Growth Curves
Introduction
Age-related reference curves are widely used in pediatric clinics and infant health units for growth screening of children. These charts are used to determine the trajectory of growth as a marker of nutritional status at individual and population levels to assist clinicians and public health policy makers. Differences between populations with respect to growth patterns because of racial, environmental and genetic factors affecting growth beside nutrition, necessitates the use of curves obtained from local data. Using the National Center for Health Statistics (NCHS) and international norms for assessing growth in Iranian children may be misleading and therefore, we aimed to develop local growth charts from our standardized and representative local data[1–4].
Several methods for developing age-related curves have been developed, some of them are based on distributional assumptions and others are not. One of the methods of growth chart drawing named LMS method is based on distributional assumptions. This method had been offered by Cole and Green in 1992[4, 5]. The LMS method is widely used to fit a centile curve[6]. In this method, to fit a suitable model, one has the measurement in the reference sample following a standard normal distribution on all ages after a chosen Box-Cox transformation. In this research, we have used the LMSP model, a generalized model of LMS method. This model is proposed by Rigby and Stasinopoulos[7]. LMSP provides a model for a dependent variable which shows both skewness and kurtosis. On the other hand, LMSP summarizes the changing distribution with age according to 4 curves representing the median (M), the coefficient of variation (S), skewness (L), and kurtosis (P). In this method the maximum penalized likelihood is also used. The use of the maximum penalized likelihood approach allows us to provide smooth estimates of L, M, S, P curves directly[8]. In this paper, percentile curves of body mass index [BMI=weight/ (height)2] for Iranian boys and girls aged 25–60 months are presented based on data on children living in northeast Iran. The paper compares the results with the newest World Health Organization (WHO) and Center for Dieses Control (CDC) results.
Subjects and Methods
A total of 23730 apparently healthy boys and girls aged 25 to 60 months recruited for 20 days from those attending community clinics for routine health check. This study was conducted in Grand Khorasan Province (northeast Iran) during 2005. Weight and height of the subjects were measured based on WHO methodology by trained health staff and their age was recorded in months. Data quality control showed that the data follow the world health organization standards with respect to the sample quantity in each age category, the mean weight standard deviation and data distribution.
In this study, BMI charts for boys and girls were constructed using LMSP method proposed by Rigby and Stasinopoulos, and implemented in the Generalized Additive Model for Location, Scale and Shape (GAMLSS) package in R software[9]. In LMSP method, GAMLSS parameters[8] and the Box-Cox power exponential distribution (BCPE) were used for model fitting to data[7]; Also Worm plot and Q-test were used for goodness of fit test[10, 11]. The GAMLSS is a general class of statistical models for a univariate response variable. For maximizing the penalized likelihood of data under GAMLSS, Rigby and Stasinopoulos and Cole and Green algorithms were used[8]. The BCPE distribution has 4 parameters and is denoted as BCPE µ, σ, υ, τ. The para-meters µ, σ, υ and τ may be interpreted as relating to location (median), scale (approximate coefficient of variation), skewness (transformation to symmetry) and kurtosis (power exponential parameter), respectively.
Smooth centile curves are drawn by modeling each of the 4 parameters of the distribution as a smooth non-parametric function of an explanatory variable[7]. Now, we introduce the 2 tools for goodness of fit tests that was used in this research. 1) Worm plot: This is a graphical diagnostic tool for assessing goodness of fit and for analysis of residuals. The shapes of the Worm plot indicate how the data differ from the assumed underlying distribution, and suggest useful modifications of the model[10]; 2) Q-tests: Q-tests are described by Royston and Wright[12]. These tests include tests for location, scale, skewness, kurtosis and non-normality[11]. Comparison of the 2 tools for goodness of fit, shows that the Worm plot is the ideal tool for preliminary model building and the Q-test is useful to determine the final model[4]. In fitting procedure, before fitting the model, an age transformation was needed to stretch the age scale for values close to zero. For this, a power transformation is applied to age, i.e. f(λ)=ageλ [4]. Therefore, at first we should search the best λ for the age power transformation and then determine the age power transformation and then determine the best degrees of freedom for the parameter curves. In order to draw centile curves by the LMSP method, the following sequence of steps should be implemented. At first, the M curve should be selected and then S curve, then L curve and finally P curve. The sequence of steps is sensible because the M curve describes the most important variation, while the influence of S, L and P is relatively small. Also in order to select the best model for µ parameter, we used the Akaike Information Criteria (AIC)[13], defined as: AIC=-21+ 2p, where l is the penalized maximum likelihood and p is the number of parameters (or the total number of degrees of freedom); to determine the best model for σ, υ and τ, we had used the Generalized Akaike Criteria with penalty equal 3 [GAIC (3)] as defined in Rigby and Stasinopoulos: GAIC=−21+3p. According to these 2 criteria, the best model was the one with smallest AIC or GAIC value.
There were 11897(50.2%) and 11833 (49.8%) observations for boys and girls respectively. A total of 23730 records with both weight and height were available for constructing the BMI-for-age curves for girls and boys. The cross-sectional sample sizes by age and sex are given in Table 1.
Table 1.
Cross-sectional sample sizes for body mass index-for-age for boys and girls
| Girls | Boys | ||||||
|---|---|---|---|---|---|---|---|
| Age group (months) | No | Age group (months) | No | Age group | No | Age group(months) | No |
| 25–27 | 1431 | 43–45 | 665 | 25–27 | 1410 | 43–45 | 689 |
| 28–30 | 1313 | 46–48 | 1143 | 28–30 | 1385 | 46–48 | 1120 |
| 31–33 | 1292 | 49–51 | 707 | 31–33 | 1143 | 49–51 | 689 |
| 34–36 | 1274 | 52–54 | 922 | 34–36 | 1340 | 52–54 | 939 |
| 37–39 | 799 | 55–57 | 681 | 37–39 | 740 | 55–57 | 611 |
| 40–42 | 834 | 58–60 | 833 | 40–42 | 977 | 58–60 | 854 |
Findings
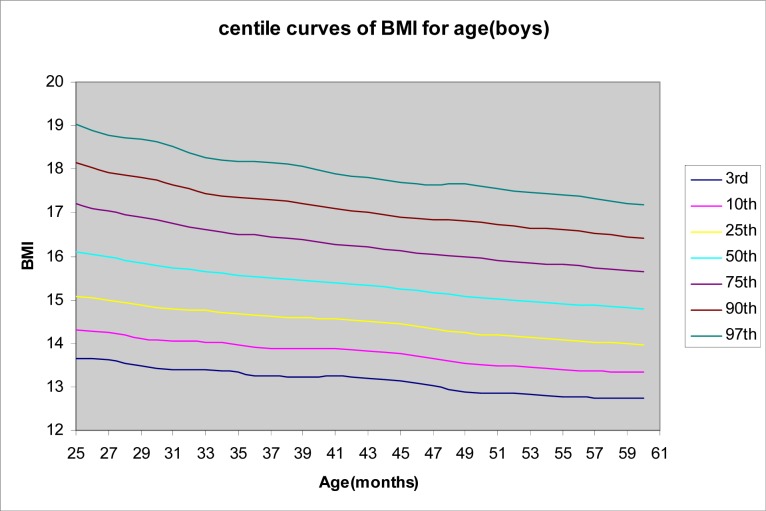
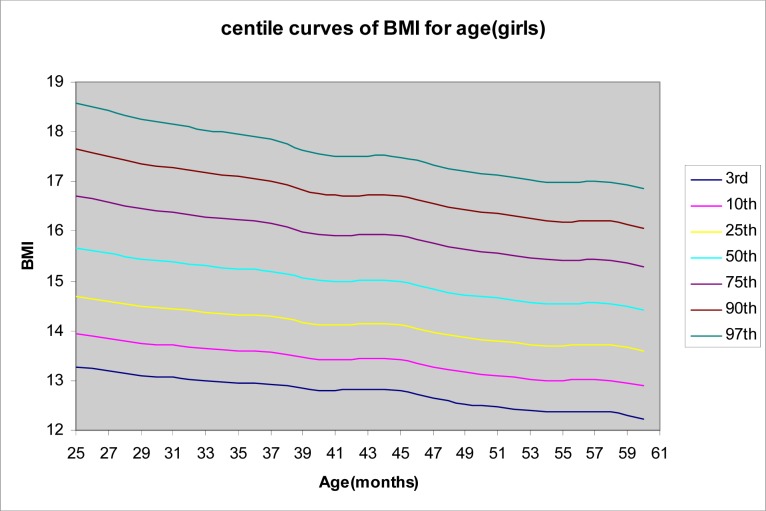
Centile curves (3rd, 10th, 25th, 50th, 75th, 90th, 97th) were generated using the LMSP method for BMI-for-age. These are shown by sex in Figs. 1 and 2.
Fig. 1.
Body mass index (BMI) percentiles curves for northeast Iranian boys. Centiles are: 3rd, 10th, 25th, 50th, 75th, 90th, 97th
Fig. 2.
Body mass index (BMI) percentiles curves for northeast Iranian girls. Centiles are: 3rd, 10th, 25th, 50th, 75th, 90th, 97th
The fitted models of data are listed below:
BCPE [x=age, df (µ)=3, df (σ)=9, df(υ)=1, df(τ)=1]; for boys
BCPE [x=age, df (µ)=9, df (σ)=4, df(υ)=1, df(τ)=1]; for girls
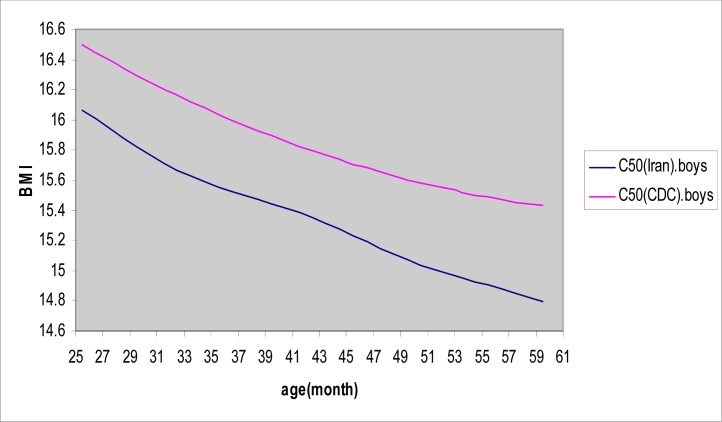
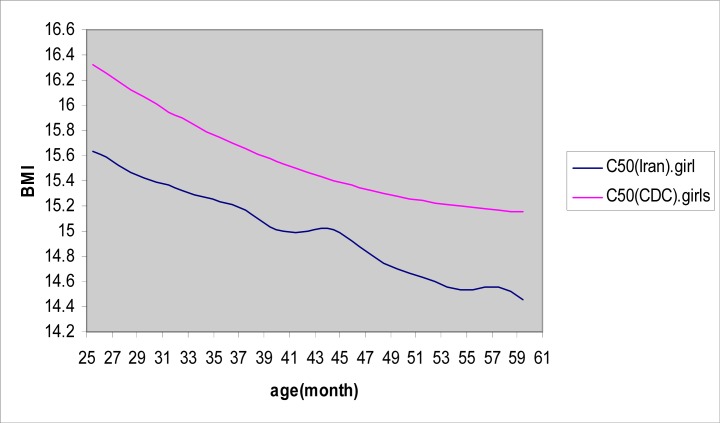
Comparisons of BMI 50th percentile curves for northeast Iran and references from United States are shown in Figs. 3 and 4. In Tables 2 and 3, values of BMI 50th percentile of northeast Iran and WHO reference are given.
Fig. 3.
Comparisons of body mass index 50th percentile curves for northeast Iranian boys with U.S. reference data
Fig. 4.
Comparisons of body mass index 50th percentile curves for northeast Iranian girls with U.S. reference data
Table 2.
50th percentile values of BMI by age for northeast Iranian boys and WHO reference data
| Age Group | 50th Iran | 50th WHO | Age Group | 50th Iran | 50th WHO |
|---|---|---|---|---|---|
| 25 | 16 | 16 | 43 | 15.3 | 15.4 |
| 26 | 16 | 15.9 | 44 | 15.2 | 15.4 |
| 27 | 15.9 | 15.9 | 45 | 15.2 | 15.4 |
| 28 | 15.9 | 15.9 | 46 | 15.2 | 15.4 |
| 29 | 15.8 | 15.8 | 47 | 15.1 | 15.3 |
| 30 | 15.7 | 15.8 | 48 | 15.1 | 15.3 |
| 31 | 15.7 | 15.8 | 49 | 15 | 15.3 |
| 32 | 15.6 | 15.7 | 50 | 15 | 15.3 |
| 33 | 15.6 | 15.7 | 51 | 15 | 15.3 |
| 34 | 15.6 | 15.7 | 52 | 14.9 | 15.3 |
| 35 | 15.5 | 15.6 | 53 | 14.9 | 15.3 |
| 36 | 15.5 | 15.6 | 54 | 15.3 | 15.3 |
| 37 | 15.5 | 15.6 | 55 | 14.9 | 15.2 |
| 38 | 15.4 | 15.5 | 56 | 14.8 | 15.2 |
| 39 | 15.4 | 15.5 | 57 | 14.8 | 15.2 |
| 40 | 15.4 | 15.5 | 58 | 14.8 | 15.2 |
| 41 | 15.3 | 15.5 | 59 | 14.8 | 15.2 |
| 42 | 15.3 | 15.4 | 60 | 14.7 | 15.2 |
BMI: Body mass index/ WHO: World health organization
Table 3.
50th percentile values of BMI by age for northeast Iranian girls and WHO reference data.
| Age Group | 50th.Iran | 50th.WHO | Age Group | 50th.Iran | 50th.WHO |
|---|---|---|---|---|---|
| 25 | 15.6 | 15.7 | 43 | 15 | 15.3 |
| 26 | 15.6 | 15.6 | 44 | 15 | 15.3 |
| 27 | 15.5 | 15.6 | 45 | 14.9 | 15.3 |
| 28 | 15.4 | 15.6 | 46 | 14.9 | 15.3 |
| 29 | 15.4 | 29 | 47 | 14.8 | 15.3 |
| 30 | 15.4 | 15.5 | 48 | 14.7 | 15.3 |
| 31 | 15.3 | 15.5 | 49 | 14.7 | 15.3 |
| 32 | 15.3 | 15.5 | 50 | 14.6 | 15.3 |
| 33 | 15.3 | 15.5 | 51 | 14.6 | 15.3 |
| 34 | 15.2 | 15.4 | 52 | 14.6 | 15.2 |
| 35 | 15.2 | 15.4 | 53 | 14.5 | 15.3 |
| 36 | 15.2 | 15.4 | 54 | 14.5 | 15.3 |
| 37 | 15.1 | 15.4 | 55 | 14.5 | 15.3 |
| 38 | 15.1 | 15.4 | 56 | 14.5 | 15.3 |
| 39 | 15 | 15.3 | 14.5 | 14.5 | 15.3 |
| 40 | 15 | 15.3 | 58 | 14.5 | 15.3 |
| 41 | 14.9 | 15.3 | 59 | 14.4 | 15.3 |
| 42 | 14.9 | 15.3 | 60 | 14.4 | 15.3 |
BMI: Body mass index/ WHO: World health organization
In this research, the Worm plot and Q-test were used together for selecting the preliminary model but for refining the final model the Q-test was used. Group-specific Q-test statistics resulting in absolute values of z1, z2, z3 or z4 that were larger than 2 were interpreted to indicate a misfit of, mean, variance, skewness or kurtosis respectively. The overall Q-test statistics combining all groups were based on Chi-square distribution, which assumes that observations from different groups are independent. The results of Q-test show misfits in fitted models of 4 parameters (µ, σ, υ and τ) of distribution for a few age groups for boys and girls, although overall Q-test statistics for 4 parameters were non-significant or P-values were large than 0.05 (for boys: P-values for M, S, L and P curves were 0.1, 0.06, 0.9 and 0.2 respectively, and for girls: 0.07, 0.07, 0.6 and 0.1 respectively).
Discussion
The present study was conducted in Grand Khorasan Province (Iran) during 2005. The main purpose of this study was to obtain smoothed growth charts for children aged 25 to 60 months. The recruited sample was 11% of the total children living in Grand Khorasan province with above-mentioned age. Children were apparently healthy and attended local community health clinics for routine health checking. It was conducted as a cross sectional study with a representative sample of children living in northeast Iran. Racial similarities, population distribution characteristics and the extension ofGrand Khorasan province probably make these curves applicable to children in Iran. The present study shows that the BMI of children aged 25 to 60 months living in northeast Iran were lower than WHO centiles for both genders.
Regarding data quality, WHO standards were followed by the obtained data[4]. Construction of local curves to measure growth pattern in pediatric clinics and to determine the population at risk of malnutrition may be much more helpful than using international norms or charts obtained from other populations. Comparing our charts with those of WHO and CDC showed significant differences between growth patterns of Iranian children and other populations. Similar differences have been highlighted in other studies of various countries[6].
Comparisons of Qatari children of less than 5 years old with NCHS showed a significant deviation from NCHS pattern[14]. In comparison with NCHS, 11% of children suffered from dwarfism and 4.4% were underweight and only 4.9% were above +2SD of NCHS indicating growth pattern differences. Similar study in Saudi Arabia for children under 3 years has also reported a significant difference between NCHS charts and Saudi children[15]. In Iran, though a study in Isfahan, in 1997, reported that the NCHS curve can be suitably used for growth evaluation in Iranian children[16], others have reported reverse. In a study in Shiraz in 1996, all Shirazi children curves were lower than the corresponding NCHS curves[17].
Recently, In Jahrom, the study carried out on infants growth charts showed that height and weight of children under two years were generally lower than those of NCHS[18]. Although the WHO or NCHS charts can give a good measure of children's growth status and may be used for risk assessment, they cannot reliably be applied to other populations such as Iranians and because of inconsistency with the growth pattern of Iranian children, they may even be misleading. Therefore, constructing local charts seem to be of high priority in health policies for child care. Because of the nature of cross-sectional studies as in this study, obtained charts may need to be reconstructed or be confirmed by longitudinal data with more representative samples across the country.
It is important to consider limitations of current study when using obtained charts. First of all, data regarding general health and nutritional practices were not available. However, the obtained charts are regarded as reliable considering the sample size and healthy condition of the recruited children. Secondly, there is not enough data regarding feeding practice of children younger than two years of age, namely, the age of commencing the complementary feeding or weaning age and whether they have been breast-fed or bottle fed.
Growth patterns of these two groups may be different and our study was unable to recognize these differences. Thirdly, the data used in this study are cross-sectional and obviously of less validity compared to longitudinal data.
Despite all these obstacles, the charts prepared by using well-known methods and based on a data set of a representative sample of Iranian children maybe preferred over those prepared by using data of other populations. Therefore, we recommend using our local charts instead of international ones until our longitudinal data has been prepared or our charts updated.
Conclusion
The current study demonstrates the possibility of local growth charts preparation and their importance for evaluating children's growth and risk assessment. The differences between our local charts and those prepared using international references, showed the necessity of preparing and using local charts for clinical and epidemiologic applications.
Obviously further studies and longitudinal data would be required to confirm these results. Constructing similar charts using longitudinal studies and regular updating to account the secular trends is recommended.
Acknowledgment
The authors appreciate the Deputy of Health of Mashhad University of Medical Sciences for their financial support and give an especial thank to Dr. Abasalti and Dr. Shakeri for editorial assistance and preparing the data and finally the University Review Board for approval of this study.
Conflict of Interest
None
References
- 1.Panpanich R, Garner P. The Cochrane Library. Oxford: Update Software; 2003. Growth monitoring in children (Cochrane Review) Issue 3. [DOI] [PubMed] [Google Scholar]
- 2.Hamill PV, Drizd TA, Johnson CL, et al. Physical growth: National Center for Health Statistics Percentiles. Am J Clin Nutr. 1979;32(3):607–29. doi: 10.1093/ajcn/32.3.607. [DOI] [PubMed] [Google Scholar]
- 3.Ogden CL, Kuczmarski RJ, Flegal KM, et al. Centers for Disease Control and Prevention 2000 growth charts for the United States: improvements to the 1977 National Center for Health Statistics version. Pediatrics. 2002;109(1):45–60. doi: 10.1542/peds.109.1.45. [DOI] [PubMed] [Google Scholar]
- 4.WHO Child Growth Standards; Geneva: World Health Organization; 2006. [Google Scholar]
- 5.Cole TJ, Green PJ. Smoothing reference centile curves: the lms method a penalized likelihood. Stat Med. 1992;11(10):1305–19. doi: 10.1002/sim.4780111005. [DOI] [PubMed] [Google Scholar]
- 6.Hosseini M, Carpenter RG, Mohammad K, et al. Standardized percentile curves of body mass index of Iranian children compared to the US population reference. Int J Obes Relat Metab Disord. 1999;23(8):783–7. doi: 10.1038/sj.ijo.0800924. [DOI] [PubMed] [Google Scholar]
- 7.Rigby RA, Stasinopoulos DM. Smooth centile curves for skew and kurtotic data modelled using the Box-Cox power exponential distribution. Stat Med. 2004;23(19):3053–76. doi: 10.1002/sim.1861. [DOI] [PubMed] [Google Scholar]
- 8.Rigby RA, Stasinopoulos Generalized additive models for location, scale and shape. Appl Statist. 2005;54(part 3):1–38. [Google Scholar]
- 9.Stasinopoulos D, Rigby B, Akantziliotou C. Instructions on how to use the GAMLSS package in R. 2nd ed. Availabe at: http://studweb.north.londonmet.ac.uk/∼stasinom/papers/gamlss-manual.pdf. Access date: Jan 11, 2008.
- 10.van Buuren S, Fredriks M. Worm plot: a simple diagnostic device for modeling growth reference curves. Stat Med. 2001;20(8):1259–77. doi: 10.1002/sim.746. [DOI] [PubMed] [Google Scholar]
- 11.Pan H, Cole TJ. A comparison of goodness of fit tests for age-related reference ranges. Stat Med. 2004;23(11):17–22. doi: 10.1002/sim.1692. [DOI] [PubMed] [Google Scholar]
- 12.Royston P, Wright EM. Goodness of fit statistics for age specific reference intervals. Stat Med. 2000;19(21):2943–62. doi: 10.1002/1097-0258(20001115)19:21<2943::aid-sim559>3.0.co;2-5. [DOI] [PubMed] [Google Scholar]
- 13.Akaike H. A new look at the statistical model identification. IEEE Trans Autom Control. 1974;19:716–23. [Google Scholar]
- 14.Kamal AA, Bener A, Kareem Al-Mulla AM. Growth pattern of Qatari preschool children. Croat Med J. 2004;45(4):461–5. [PubMed] [Google Scholar]
- 15.Bamgboye EA, Al-Nahedh N. Factors associated with growth faltering in children from rural Saudi Arabia. Afr J Med Med Sci. 2003;32(4):343–7. [PubMed] [Google Scholar]
- 16.Aminorroya A, Amini M, Naghdi H, Zadeh AH. Growth charts of heights and weights of male children and adolescents of Isfahan, Iran. J Health Popul Nutr. 2003;21(4):341–6. [PubMed] [Google Scholar]
- 17.Ayatollahi SMT, Ahmadi K. Infants'growth chart for southern Iran. Ann Hum Biol. 2001;28(3):337–45. doi: 10.1080/030144601300119142. [DOI] [PubMed] [Google Scholar]
- 18.Heydari ST, Emamghoreishi F, Amini M. Infants'growth charts in Jahrom, Iran. Iran J Pediatr. 2009;19(1):25–34. [Google Scholar]


