

Abstract
Viruses spread between cells, tissues, and organisms by cell-free and cell-cell transmissions. Both mechanisms enhance disease development, but it is difficult to distinguish between them. Here, we analyzed the transmission mode of human adenovirus (HAdV) in monolayers of epithelial cells by wet laboratory experimentation and a computer simulation. Using live-cell fluorescence microscopy and replication-competent HAdV2 expressing green fluorescent protein, we found that the spread of infection invariably occurred after cell lysis. It was affected by convection and blocked by neutralizing antibodies but was independent of second-round infections. If cells were overlaid with agarose, convection was blocked and round plaques developed around lytic infected cells. Infected cells that did not lyse did not give rise to plaques, highlighting the importance of cell-free transmission. Key parameters for cell-free virus transmission were the time from infection to lysis, the dose of free viruses determining infection probability, and the diffusion of single HAdV particles in aqueous medium. With these parameters, we developed an in silico model using multiscale hybrid dynamics, cellular automata, and particle strength exchange. This so-called white box model is based on experimentally determined parameters and reproduces viral infection spreading as a function of the local concentration of free viruses. These analyses imply that the extent of lytic infections can be determined by either direct plaque assays or can be predicted by calculations of virus diffusion constants and modeling.
INTRODUCTION
Viral disease develops from complex interactions of viruses with their hosts during entry, genome uncoating, translation, replication, and assembly and spread of progeny viruses to uninfected cells. Spread of viruses between cells occurs by cell-free or cell-to-cell transmissions (for reviews, see references 14, 72, and 83). Cell-free transmissions require the dissociation of progeny particles from a producer cell and involve large bursts of released viruses or the progressive release of smaller amounts of viruses independent of a particular acceptor cell. This leads to viremia and enables viral spreading throughout blood fluids. Cell-cell transmissions occur at contact sites of neighboring cells. Neurotropic viruses, for example, can be transmitted between synaptic contacts of adjacent cells, and retroviruses establish new cell-cell contacts for transmission, so-called virological synapses (see references 23, 68, and 69). For retroviruses, such as human immunodeficiency virus (HIV) or equine infectious anemia virus, cell-to-cell transmission reduces the neutralization efficacy of antiviral antibodies and antiviral drugs (66, 91, 113). This illustrates that viral transmission modes modulate the efficacy of immune defense and affect antiviral strategies, such as vaccine design and the development of new antiviral compounds.
Little is known about lytic cell-free transmission of viruses, although cell-free transmission occurs with both nonenveloped and enveloped viruses and is key for clinical efficacy of oncolytic viruses (57, 78, 111). Theoretical calculations considering the rate of viral production, life span of the producer cell, and neutralizing capacity of antibodies have suggested that the lytic life cycle with large burst sizes promotes survival in the face of antibody attack (51). The lytic cycle can be modulated by the replication rate and thereby avoid extinction of the host cells and dilution of the virus (114). Accordingly, viral strains with variable replication rates coexist rather than dominate one another. This is illustrated by persistent nonenveloped lytic viruses in vivo and in cell lines, for example, poliovirus (22), coxsackievirus (100), foot-and-mouth disease virus (25), reovirus (1), or human adenovirus (HAdV) (33, 101).
HAdVs replicate in experimentally infected people and are transmitted between individuals (59). They cause infections with epidemic, endemic, or sporadic disease and viremia or massive viral excretions (73, 89). Currently, there are 57 HAdV types grouped in 8 species, including a recently discovered zoonotic titi monkey adenovirus (18). More than one-third of HAdVs are associated with disease in the respiratory, digestive, excretory, and ocular systems (44, 55, 71). Fatal cases of HAdV infections were reported from immunosuppressed patients due to T-lymphocyte deficiencies (52), while infections in immunocompetent individuals are usually self limiting.
HAdVs have a diameter of about 90 nm and a double-stranded DNA genome of 36 kb but have no envelope (7, 61, 82). The protruding fibers mediate virus attachment to cellular receptors. These receptors include transmembrane proteins, such as the coxsackievirus adenovirus receptor (CAR), membrane cofactor CD46 or desmoglein-2, or glycans (8, 32, 75, 92, 105, 108). Infections with HAdV2 (referred to as Ad2), HAdV3, or HAdV5 (referred to as Ad5) are enhanced by integrin coreceptors, which bind to the penton base protein on the viral capsid (2, 60). CAR and integrins are localized on the basolateral and junctional membrane of polarized epithelial cells, facing away from the airways of the lungs. These receptors can be redirected to the apical surface by virus-stimulated macrophages and cytokine signaling and thereby provide a vital passageway for the viruses into the epithelial cells (63). Downstream of receptor binding, Ad2/5 engages drifting motions on CAR and is confined by integrins (15). Drifts and confinements trigger the first steps in the uncoating program, the loss of the fibers, and exposure of the membrane lytic protein VI (15, 39, 112). This is followed by receptor-mediated endocytosis (70) and enables virus escape from endosomes (34). The cytosolic viruses traffic on microtubules using the dynein/dynactin motor complex to reach the nucleus (12, 29, 35, 54, 99). They dock to the nuclear pore complex, disassemble by a kinesin motor-mediated disruption process, and release the viral genome into the nucleus (98, 106). In the nucleus, they initiate the replication program by transcribing the immediate-early activator proteins of the E1 region encoding E1A and E1B proteins, which are essential to drive the expression of all other viral proteins (10). The formation of progeny particles in the nucleus requires the replication of the viral DNA and structural viral proteins from the major late transcript (reviewed in reference 9).
While there is experimental evidence for lytic and nonlytic egress of Ad5 (102), the mechanisms of lytic viral release and spread from infected cells are poorly understood. Proteolytic cleavage of cytokeratin K18 by the viral protease is thought to reduce the mechanical stability of the cytoplasm and facilitate viral release (20, 65). In addition, the release of Ad2/5 is facilitated by the adenovirus death protein 11.6 kDa, which is encoded by early region 3A (E3A) (102). Although encoded by E3, the 11.6 kDa protein is expressed at very low levels in the early phase of infection and at very high levels late in infection from the major late promoter (103).
The early region 3B does not directly affect the replication cycle of the virus. It encodes three proteins which protect the virus from host antiviral responses in acute infections (58). These proteins antagonize cell death triggered by cytotoxic lymphocytes or cytokines released by activated macrophages. Two E3B proteins, 10.4 kDa and 14.5 kDa, form the receptor internalization and degradation complex (RID). RID triggers endocytosis and lysosomal degradation of the Fas receptor and TRAIL receptors 1 and 2 (reviewed in reference 9). The third open reading frame in the E3B region is the 14.7 kDa protein. It inhibits tissue necrosis factor alpha (TNF-α) (36), TRAIL (104), and Fas ligand-induced apoptosis (19) by binding to a caspase downstream of the receptors. This protein also blocks NF-κB signaling, which is crucial for antiviral immunity (reviewed in reference 9).
HAdV egress from an infected cell in a multicellular environment has not been quantitatively described so far. Here, we developed a multiscale hybrid dynamics model using a cellular automaton and particle strength exchange based on experimentally determined parameters. Computational models have been developed to study viral propagation between cells, typically based on ordinary differential equations (11, 79, 97). Cellular automata (CA) have been used to study viral infection spread because of their natural discreteness and the ability to resolve spatial localization (6, 50, 115). They were used to model virus spread in cell culture, albeit without quantifying diffusion dynamics and accounting for bulk currents (4). While CA are useful for the discrete modeling of cell behavior, they are not very suitable for modeling virus particle diffusion in the extracellular space. To relax limitations of discreteness and dimensions, hybrids of established modeling approaches were developed (64). Our hybrid spatiotemporal model for the propagation of HAdV infection combines CA with a partial differential equation formalized by a particle strength exchange (PSE) method (24) to describe diffusion of viruses in the cell-free environment. We show that passive mass transfer of released HAdV progeny in the cell-free environment is sufficient to explain the dynamics of HAdV infection spread in monolayers.
MATERIALS AND METHODS
Cell culture and viruses.
Human lung carcinoma A549 (HLC-A549) cells were purchased from American Type Culture Collection (Rockville, MD). Early region 1 (E1)-transfected human embryonic retinoblast 911 (HER-911) cells (31) were grown as monolayers in Dulbecco's modified Eagle medium (DMEM) supplemented with 10% fetal bovine serum (FBS; GIBCO-BRL) on cell culture dishes or 96-well plates (Matrix, Thermo Fisher Scientific, Lausanne, Switzerland).
Ad2-dE3B-GFP was constructed in E. coli strain SW102 by mutagenesis of a bacterial artificial chromosome (BAC53) carrying the entire Ad2 genome and the phage lambda recombineering genes, which allowed for two-step GalK-positive selection and deoxygalactose counterselection as described earlier (46, 48, 81, 109). The E3B genes were excised at the end of the E3A polyadenylation site (nucleotide 29780) and before the E3B polyadenylation site (nucleotide 30841) and replaced by GalK using the following primer pair: 5′ GAAACCATGTTCTCTTCTTTTACAGTATGATTAAATGAGACCCTGTTGACAATTAATCATCGGCA 3′ and 5′ GCTGGACAAAGATTTGCTGACTGATTTTAAGTAAGTAATTTATTGTCAGCACTGTCCTGCTCCTT 3′. The enhanced green fluorescent protein (eGFP) open reading frame, controlled by a cytomegalovirus (CMV) promoter and a simian virus 40 (SV40) termination site of 1,642 bp, was inserted in place of GalK using the following primer pair: 5′ GAAACCATGTTCTCTTCTTTTACAGTATGATTAAATGAGACTAGTTATTAATAGTAATCAATTACGGGGTC 3′ and 5′ GCTGGACAAAGATTTGCTGACTGATTTTAAGTAAGTAATTTATTGTTAAGATACATTGATGAGTTTGGACAAACC 3′. The final BAC construct was verified by DNA sequencing using primers in the E3A and E4 regions and was found to be correct (not shown). Ad2-E3B-eGFP BAC DNA was purified using a Maxi preparation kit (Sigma), linearized by DpnI restriction, phenol-chloroform extracted, ethanol precipitated, and transfected into 293 cells by calcium phosphate precipitation. Virus particles were grown in HLC-A549 cells and purified by double cesium chloride gradient centrifugation. Ad2-E3B-eGFP was found to be homogeneous by SDS-PAGE and transmission electron microscopy negative-stain analyses (not shown).
For time-resolved infection studies, purified Ad2-dE3B-GFP was added to A549 cells at 5 · 10−7 mg/ml protein, about 3 particles per cell. From the protein concentration measured in the purified virus preparation, we determined a theoretical number of adenovirus particles (TNAP) according to equation 1:
| (1) |
The mass of one virus particle was assumed to be 2.5 · 10−19 kg, about 150 MDa (107).
Transgenic Ad2-dE1-GFP was generated by ET recombination-mediated insertion of a CMV promoter-GFP expression cassette to the E1 region of Ad2 (nucleotides 461 to 3510). BAC DNA was verified for correct insertion of the GFP gene, purified, and transfected into HER-911 cells for virus growth as described previously (81). Ad2, Ad2-dE3B-GFP, and Ad2-dE1-GFP were grown, isolated, and in the case of Ad2-Atto488, Atto-488 dye was used (ATTO-TEC, Germany) as described previously (15, 31, 38, 74). Protein concentrations of purified viruses were measured using the Pierce Micro bicinchoninic acid (BCA) protein assay reagent kit (Thermo Fisher Scientific, Lausanne, Switzerland).
Automated cell segmentation and infection probability calculations.
Automated cell segmentation was performed computationally using CellProfiler 2.0 software (16). Analysis involved a custom-made CellProfiler 2.0 pipeline using the thresholding of multiple signal source images. Thresholding efficiency was calibrated visually for each data set. Results from automated cell segmentations were used to count GFP-positive cells at 72 h postinfection (hpi). These values were used to calculate the fraction of infected cells depending on input virus concentration. These data were used to calculate the probability of infection.
From the protein mass of an individual HAdV particle (107), we defined TNAP using equation 1. From the fraction of GFP-positive cells calculated, we determined the infection probability depending on the amount of input virus and normalized the probability over the typical length of an experiment, which was 72 h. We assumed that the majority of the particles attached onto the cell monolayer during this period. This allows us to calculate the impact of TNAP per arbitrary area unit on the probability of infection.
Complementary cocultures of HER-911 and HLC-A549 cells.
HER-911 and HLC-A549 cells were grown to 95% confluence in separate wells of a 96-well plate. HER-911 cells were inoculated with Ad2-dE1-GFP (MOI, 104; 0.053 μg/μl) in DMEM containing 2% bovine serum albumin (BSA) at 37°C for 1 h, washed 3 times with phosphate-buffered saline (PBS), stained with CellMask deep red dye (Invitrogen), and detached with Accutase (Sigma-Aldrich) at 37°C for 7 min. Singular HER-911 cells were resuspended in DMEM containing 10% FBS, diluted 1:800 with DMEM-FBS, and added to a monolayer of HLC-A549 cells. Infection was imaged 24 hpi as described below. The cooccurrence of CellMask and GFP dyes was quantified by cell segmentation with CellProfiler 2.0.
HAdV neutralization.
Ad5 was incubated with an Ad2/5 neutralizing antiserum (kindly supplied by Anja Ehrhardt [43]) in 96-well dishes containing 50 μl of DMEM and 1% BSA. HLC-A549 cells were added to the wells, incubated at 37°C for 7 days, fixed, and stained with the cell dye crystal violet (0.25 mg/ml crystal violet in H2O containing 5% ethanol).
Semisolid medium.
Semisolid medium was prepared using cell culture-grade ultralow-melting-point agarose, type VII (Sigma, Fluka, Buchs, Switzerland). Agarose was dissolved in PBS at 3 mass percent. This concentrated gel was heated up to 90°C in a microwave oven, cooled down, and controlled for water loss and precise agarose concentration using gravimetry. The volume was adjusted by addition of H2O, diluted with warm cell growth medium, and overlaid on top of the cell monolayers or used for diffusion measurements of purified fluorophore-tagged HAdV particles.
Time-lapse multisite, multichannel microscopy.
Time-lapse multisite, multichannel microscopy images were recorded with an automated ImageXpressMICRO fluorescence microscope (Molecular Devices, Munich, Germany) using a 10× Nikon S Fluor objective with a 0.5 numerical aperture (NA) and equipped with a humidified chamber at 37°C and multiple wavelength excitation/emission filters (Semrock). All live imaging experiments were performed in 96-well black plates (Matrix; Thermo Fisher Scientific, Lausanne, Switzerland). For image acquisitions, cultured cells were maintained in 20 mM HEPES-buffered bicarbonate-free RPMI 1640 medium (GIBCO-BRL) supplemented with 10% FBS (GIBCO-BRL) and penicillin-streptomycin (GIBCO). Image acquisition at multiple sites was enabled with a motorized stage, allowing precise, high-speed selection of regions of interest within a well. Using MATLAB (Mathworks, Natick, MA)-based postprocessing, images were stitched into pictures of high resolution covering roughly 85% of 96 wells in the case of experiments involving plaque (PQ) analyses. This allowed analyses of virus infection spreading over large areas with high resolution.
Imaging of HAdV particles and fluorescent beads.
The movements of adenovirus particles and fluorescent beads were imaged using custom-made total internal reflection fluorescence (TIRF) microscopy based on an Olympus IX81 inverted microscope equipped with a Cascade 128+ camera (Photometrics, Roper Scientific), 1.45-NA oil immersion PlanApo (100× magnification; Olympus) objective, and a custom-made thermostatic chamber (15). A kit of yellow-green Fluoresbrite fluorescent beads of various sizes was purchased from Polysciences. Microscopy was performed at 37°C. The TIRF angle was manually adjusted in each case to obtain the optimal signal-to-noise ratio. The image acquisition was controlled by Metamorph software (Molecular Devices, Visitron Systems, Germany). For the measurements, we used type I ultrapure water (18.2 M Ω/cm) and live imaging medium (termed imaging medium). Imaging medium had the following composition: Hank's buffered salt solution (HBSS), 0.2% BSA (Sigma), 1 mg/ml ascorbic acid, optional 10% FBS (or without addition of 10% FBS in the case of low-serum-concentration imaging medium). Measurements were conducted in media containing different concentrations of agarose. Movies with a high time resolution (0.001 s/frame) were acquired and used to track individual HAdV particles. Particle tracking was performed with the particle tracker 3D plugin in ImageJ (86). The resulting trajectories were used to compute HAdV diffusion constants from the moment scaling spectrum as described previously (30, 37).
Measurement of the HAdV diffusion constants.
The diffusive properties of HAdV particles were determined using high-speed TIRF microscopy of fluorescently labeled viruses at a 1,000-Hz acquisition frequency and single-particle tracking in 2-dimensional mode using the particle tracker 3D ImageJ plug-in (86). Viral trajectories were used to compute diffusion constants from the moment scaling spectrum slope. The procedure was calibrated using fluorescent beads of various sizes and compared to values predicted by the Einstein-Stokes equation (equation 2).
The diffusion constant (D) of a given particle can be calculated theoretically or measured experimentally. Theoretical values of diffusion constants for ideal spherical particles can be predicted using the Einstein-Stokes equation:
| (2) |
where D is the diffusion constant, kB is Boltzman's constant, T is the temperature, η is the viscosity of the environment, and r is the hydrodynamic radius of the particle.
Determination of the mode of diffusive motions.
To confirm the validity of the theoretically calculated D values from equation 2, we characterized the motion mode of the fluorescent beads by estimating the Reynolds number (Re). Re is a measure of the ratio of inertial forces and viscous forces acting on the particle. Equation 2 assumes laminar Stokes flow and is only valid for an Re much smaller than 1. In our system, we estimated Re for Brownian motion of various-sized beads ranging from 38 to 1,000 nm (Table 1). All values of Re were less than 0.1, suggesting laminar motion (28) and justifying the use of equation 2 for HAdVs. Equation 2 is also valid for most of the currently known globular virus particles.
Table 1.
Reynolds numbers (Re) for beads of various sizesa
| Bead diam (m) | Maximal Re from instantaneous speed | Maximal Re from mean speed | Re from theoretical instantaneous speed |
|---|---|---|---|
| 3.98 · 10−08 | 2.01 · 10−2 | ||
| 1.14 · 10−07 | 1.72 · 10−4 | 3.82 · 10−5 | 1.19 · 10−2 |
| 2.09 · 10−07 | 5.20 · 10−4 | 7.29 · 10−5 | 8.77 · 10−3 |
| 5.16 · 10−07 | 1.39 · 10−3 | 3.06 · 10−4 | 5.58 · 10−3 |
| 7.48 · 10−07 | 1.29 · 10−3 | 2.46 · 10−4 | 4.63 · 10−3 |
| 1.02 · 10−06 | 2.56 · 10−3 | 4.68 · 10−4 | 3.97 · 10−3 |
See Materials and Methods for details on the calculation methods.
Computation of the Reynolds number for fluorescent particles.
To confirm the validity of theoretically calculated diffusion constants using equation 2, we estimated the Reynolds numbers for Brownian motion of beads ranging from 38 to 1,000 nm in diameter. Equation 2 is only valid if the flow of medium around the diffusing virus particle is laminar (28), which is the case for Re much lower than 1.
Re can be computed using the following equation:
| (3) |
where ρ is the density of the fluid, η is the dynamic viscosity of the fluid, V is the fluid velocity, and L is the diameter of the spherical particle. The fluorescent beads were purchased from Polysciences. η for distilled water at 37°C was computed from the following equation:
| (4) |
where A = 2.41 · 10−5 Pa · s, B = 247.8 K, and C is the fluid temperature in degrees Kelvin. ρ for distilled water at 37°C is 991.27 kg/m3.
Fluid velocity estimations around the Brownian particle (V) can be obtained using several approaches. For example, it could be measured experimentally, although this is limited by the temporal resolution. From our experimental measurements, we computed two types of V, instantaneous speed (Vinst) and mean speed (<V>). The trajectories from the 1,000-Hz TIRF microscopy experiments were used to estimate Vinst, while <V> was computed from experimental D values according to the following equation:
| (5) |
where t is the time length of the trajectory.
To control for potential underestimations of V values from experimental data, we computed theoretical instantaneous root mean square velocity values (VRMS) from equation 6 according to reference 56:
| (6) |
We then computed Re based on maxima of Vinst, <V>, and VRMS. All values of Re obtained were less than 0.1 (Table 1), which allowed good theoretical predictions of diffusion constants for spherical particles using equation 2. Furthermore, the size range over which we calibrated the method covered most currently known viruses, which allows equation 2 to predict diffusion constants for many other globular virus particles.
Description of the computational model.
The computational model was developed using MATLAB 2010a (MathWorks, Natick, MA). The model consists of a CA and a PSE module. The CA is a discrete module composed of a grid of cells, each of which is in a defined state and conforms to rules that are updated according to the present state of the cells. PSE is a deterministic particle method to simulate diffusion.
The implemented CA uses a hexagonal grid to represent biological cells. The state of the cell describes its infection status and viability. The time step for the CA is 1 h, which is sufficient to resolve key events, such as cell infection and lysis. At each time step, the status of the cell is checked and updated if required. A lysis clock is also updated if the cell state is currently in productive infection mode. The hexagonal CA grid consisted of 200 by 231 cells, 46,200 cells in total. The size of each cell was 24 μm, and the total layer of cells 4,812 by 4,808 μm2.
The state of each cell can be uninfected, dead, infected, or nonlysable. All cells are uninfected at the beginning of the simulation, except for one initially infected cell. An uninfected cell can die or be infected or nonlysable. The proportion of dead cells over the course of the biological experiment was calculated. Uninfected cells were chosen randomly to die during the simulation in order to match the ratio obtained from the biological experiments. An uninfected cell may be infected based on an experimentally determined probability depending on the local concentration of virus. Between different CA time steps, the maximum TNAP concentration was recorded for each cell. This concentration was compared to the probability of infection at the appropriate virus concentration. A random value of 0 or 1 was used to determine if the cell becomes infected compared to the experimentally obtained probability of infection. Probabilities of infection between experimental concentrations were linearly interpolated based on the experimental observation that not all of the infected cells went on to lyse and form PQ. As soon as a cell was infected, this cell was randomly assigned to either proceed to a lytic or a nonlytic infection based on experimentally determined probabilities of infected cell lysis. As soon as a cell was infected, a lysis clock was initiated which then determined the time to lysis from a uniform distribution, which was taken after the first infected cells were observed to lyse between 1 and 5 days pi (dpi). The level of GFP intensity in lytic or nonlytic infected cells was taken as an indicator for the progress of infection. The GFP intensity signal increased over time as determined by linear extrapolation between calculated virus concentrations. The GFP intensity values can be linearly interpolated until selected maximum virus concentrations are measured in the biological experiments for experimental purposes. The PSE diffuses the virus particles released from an infected cell. The time step of the PSE is set to satisfy the forward Euler stability criteria, dt < h2/2D, where h is the space between particles and D is the diffusion constant. The PSE module stopped running when the local concentration of virus was below the infection threshold. As a result of the multiscale nature of the CA and PSE components of the hybrid model in temporal dimension, the PSE module runs between time steps of the CA. As mentioned above, the maximal concentration of virus the cell is exposed to between individual CA steps is tracked during the course of the PSE module execution. The PSE was implemented as described in reference 24. Particles were placed on a regular grid, and the number of particles used was chosen such that approximately nine particles gave support to one CA cell. A cloud-in-cloud assignment scheme was used to add virus to the PSE module after cell lysis and to determine the local concentration of virus at each cell.
RDF for plaques.
A method to determine the radial distribution function (RDF) of intensity was developed to characterize the PQs in biological and in silico experiments. The input for the method was an image (intensity matrix), as well as the user-defined center of the PQ. The perimeter of a PQ was scanned by single-degree resolution, and GFP intensities projecting around the center were averaged in concentric rings with a width of 1 pixel (0.645 μm) with 0-pixel spacing. The average intensity from each ring yielded the RDF values. The center of biological PQs was determined by user input, while the center of in silico PQs was taken as the initially infected cell.
Experimental and simulated time-resolved plaque formation.
Individual PQs from Ad2-dE3B-GFP-infected HLC-A549 cells were imaged by live-cell fluorescence microscopy in hourly intervals as described above, and radii of PQs were fitted using ImageJ software. The simulation of PQ formation was performed using the parameters described above.
RESULTS
Ad2 infection visualized in epithelial cell monolayers.
We used ET mutagenesis (81) to engineer a replicating, E3B-deleted Ad2, which expresses the GFP reporter in the E3 region from the major cytomegalovirus promoter (termed Ad2-dE3B-GFP). This virus was fully replication competent and developed plaques in human airway epithelial lung carcinoma A549 cells (HLC-A549) that were similar in appearance and size to those produced by Ad2 (see Fig. S1 in the supplemental material). Live-cell, multisite time-lapse microscopy showed that inoculation of Ad2-dE3B-GFP led to sporadic occurrence of GFP-expressing cells in the monolayer, indicating infection. About 2 to 3 dpi, larger zones of GFP-positive cells developed around initially GFP-expressing cells. We termed these foci plaques, although in a strict sense they are spreading phenotypes, an example of which is shown in Fig. 1A and B. Our PQs resemble classical viral plaques, which were introduced more than 60 years ago and enabled the first systematic and quantitative measurements of viral infections (27). To visualize cell lysis, we used propidium iodide (PI), a positively charged cell-impermeable phenanthridine dye, which intercalates with double-stranded DNA and RNA and upon binding emits 20- to 30-fold-enhanced orange-red fluorescence at 617 nm compared to the free dye (96). The PI signal can only be observed if the plasma membrane is broken. The transition of a GFP-positive cell to a PI-positive cell occurred faster than the 1-h resolution used in these experiments, that is, it appeared in the frame following the initial GFP signal. For the 10 analyzed PQs, the transition from an initially infected cell to a PQ usually occurred 4 to 14 h after cell lysis (see Movie S1 in the supplemental material).
Fig 1.

Formation of plaques around infected lysed cells. A transgenic, replication-competent Ad2 with the dE3B region replaced by a CMV-GFP cassette (Ad2-dE3B-GFP) was used to infect monolayers of human lung carcinoma A549 (HLC-A549) cells at 5 · 10−7 mg/ml in 200 μl of culture medium. Infection progression was imaged by multisite time-lapse fluorescence microscopy. (A) GFP signals from infected cells at the indicated time points of infection. Note the occurrence of circular zones of GFP-positive cells around an initially infected cell, a so-called plaque. The arrows in the figure point to the lysing infected cell. (B) Overlay of the GFP signal from infected cells (green), Hoechst 33342 nuclear live dye (Hoechst, blue), and propidium iodide for lysed cells (PI, red). See also Fig. S1 and Movie S1 in the supplemental material.
We calculated the probability of a PI signal to occur at the time point of the GFP-PI transition event and the geometric probability of this event to occur inside a circular area large enough to contain both the source of the GFP signal and the PI signal. The probability of a double positive GFP- and PI-stained cell was less than 1 in 1,000 (P = 0.00045 ± 0.00025; n = 10). We conclude that Ad2-dE3B-GFP inoculation leads to a sequential order of events that is suitable for live-cell image analyses, initial infection monitored by intense GFP expression, cell lysis by PI staining, and secondary infections of neighboring cells, which gives rise to a PQ.
HAdV infection spread involves cell-free virus particles.
To test if PQs depend on the release of free progeny viruses into the medium, we tested if convection influenced the shape of the PQs. Convection is a macroscopic description of heat and mass transfer in fluids and consists of advection and diffusion (49). Advection results from bulk fluid motions caused, for example, by local temperature differences. Advection is cancelled in gels by the frictional forces between the liquid and the polymer network (17). PQs with comet-like shapes were observed in liquid medium and circular shapes in semisolid medium (Fig. 2A and B; also see Movie S2 in the supplemental material). In both cases, the GFP signal was more intense in the center of the PQ than the periphery. The strong influence of advection on the development of PQs was underscored by the observation that the comet shapes were uniformly directed uphill in tilted plates, while they were randomly positioned in horizontal plates in liquid medium (see Fig. S2). In gelled medium, the PQs were largely symmetrical, presumably due to dissipation of advection currents caused by friction.
Fig 2.

Cell-to-cell infection occurs through the extracellular medium. (A and B) Monolayers of HLC-A549 were inoculated with Ad2-dE3B-GFP expressing eGFP. Two h later, the inoculum was replaced with liquid or gel-forming (semisolid) medium (0.6% ultralow-melting-point agarose mass). This agarose is liquid at 37°C, gels at room temperature, and remains gelled at 37°C. PQs exhibit comet-like shapes in liquid medium and circular shapes in semisolid medium. The micrographs are composites of stitched images taken from multiple sites in 96-well plates at 113.5 hpi. (C) Neutralizing antiserum against HAdV in the culture medium inhibits viral spreading. HLC-A549 cells grown in monolayers in 96-well plates were inoculated with 0.1 ml of medium containing 10−7 mg/ml Ad2-dE3B-GFP for 24 h, supplemented with antiserum containing medium, and then imaged at the indicated time points. Scale bar, 1 mm. See also Fig. S2 and S3 and Movies S2 and S3 in the supplemental material.
To test if infection spreading involved extracellular viruses, we used an anti-Ad5 neutralizing serum (43). At 1:10 but not at 1:500 dilutions, it blocked single-round Ad2-dE3B-GFP infection of HLC-A549 cells by about 10-fold (see Fig. S3A to C in the supplemental material). At a 1:30 dilution, it neutralized Ad5 infection of HLC-A549 cells by endpoint titration assays at 104 or fewer viruses per cell (see Fig. S3D and E). Larger amounts of antiserum also were effective against 105 Ad5 particles per cell, confirming the high neutralization potency.
We next inoculated HLC-A549 monolayers in 96 wells with Ad2-dE3B-GFP (5 × 10⁻⁷ μg/μl; 3 particles per cell), removed the inoculum 24 hpi, covered the cells with medium containing neutralizing antiserum, and observed the infection by live-cell GFP imaging. At a 1:10 dilution of the serum, we observed 1 PQ per well and 3.5 PQs at 1:500 dilution (Fig. 2C) (see Movie S3 in the supplemental material). Untreated cells or cells treated with heat-inactivated antiserum had an average of about 5 PQs per well, and these PQs were larger than the PQs from cells treated with neutralizing antibody. The data show that most PQs were blocked by the neutralizing antiserum, indicating that extracellular Ad2 drives PQ formation. A small fraction of PQs was resistant to the antibody. PQs only formed from lytic infected cells, which suggests that a small amount of extracellular viruses was not recognized by the antiserum. PQ formation, however, depended on passive transfer of infectious viruses in the medium, which was influenced by bulk liquid motions. These motions comprise advection and diffusive mass transfer. In subsequent experiments, we restrict HAdV mass transfer to diffusion with semisolid medium.
Lysis of a single cell leads to the formation of a plaque.
If HAdV spreads to neighboring cells by passive mass transfer, a single infected cell should produce a PQ. We tested this hypothesis in a coculture system of infected human embryonic retinoblast 911 cells (HER-911), which replicate E1-deleted Ad2 expressing eGFP (Ad2-dE1-GFP). Small amounts of infected HER-911 cells (see Fig. S4 in the supplemental material) were seeded onto uninfected HLC-A549 acceptor cells, which can be infected but do not replicate Ad2-dE1-GFP and thereby allow for a single round of infection. Live-cell, multisite time-lapse microscopy revealed GFP-positive HER-911 donor cells at 54.5 hpi, followed by lysis of one of the donor cells and the formation of a PQ in HLC-A549 cells at 104.5 hpi (Fig. 3). These PQs were similar in size to those observed with replicating Ad2-dE3B-GFP in HLC-A549 cells, and they depended on donor cell lysis and advection (see Fig. S5). We noticed a significant amount of dead cells at late imaging time points of both infected or uninfected cells (Fig. 1 and 3). This was most likely due to imaging-induced phototoxicity. The lysis clock was modeled by a uniform distribution probability. An exponential distribution probability gave similar results (not shown). Importantly, in the wet laboratory experiment, imaging did not affect the size of PQs up to 3 days pi, as concluded from PQ analyses without intermittent imaging, in agreement with our simulations using different lysis clock probabilities (data not shown). Together, the data indicate that viruses spread from a single lysed cell in the absence of lytic viral replication in the acceptor cells.
Fig 3.

Replication-defective HAdV spreads to neighboring cells from an infected donor cell. Ad2-dE1-GFP-infected HER-911 donor cells were seeded at limiting dilutions onto HLC-A549 acceptor cells (1 in 800), which can be infected but do not produce virus particles. The figure shows PQs of Ad2-dE1-GFP, Hoechst, and propidium iodide (PI) composites of a single round of infection. The arrows point to a lysing HER-911 cell. See also Fig. S4 and S5 in the supplemental material.
The foundations of a model for lytic spread of HAdV.
To quantitatively characterize the spreading of HAdV infection by a cell-free mechanism, we developed a novel computational model (Fig. 4 shows an overall workflow of the model and the cell state flowchart). The model hybridizes a CA-PSE. PSE is a mesh-free method to simulate diffusion and is used here to simulate the diffusion of viral particles after cell lysis.
Fig 4.
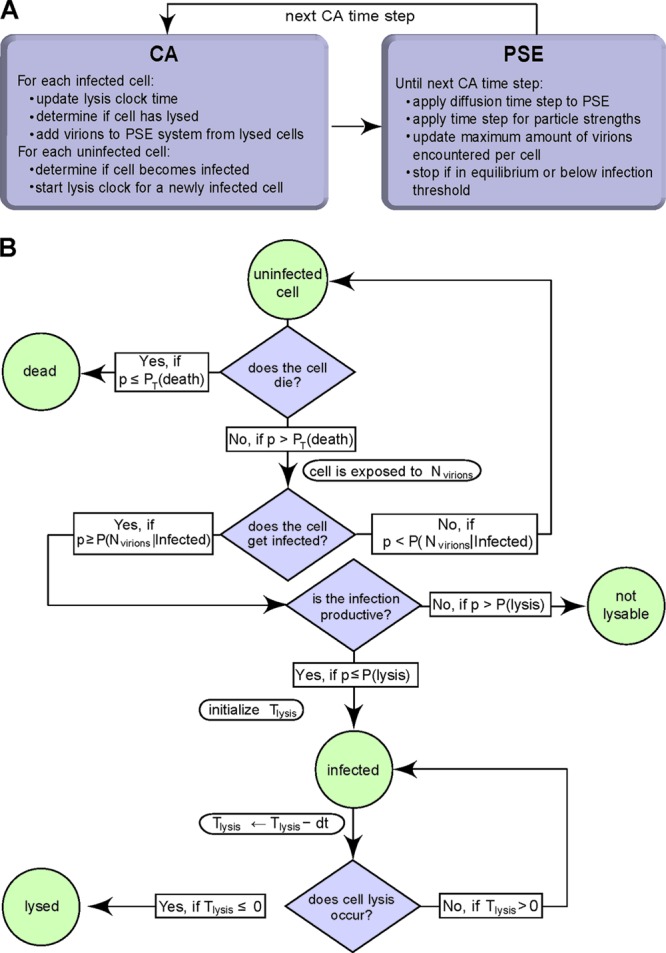
Hybrid model consisting of a CA-PSE. (A) Flow chart of the CA-PSE model; (B) cell state flow chart. Nviruses is the number of diffusing, cell-free viral particles; p has a random value from a uniform distribution, U (0, 1); P(Nviruses | infected) is the probability of infection upon exposure to Nviruses virus particles; dt is the CA time step; P(lysis) is the probability of cell lysis; PT(death) is the time-dependent probability for an uninfected cell to die; and Tlysis is the time until cell lysis.
The CA represents the geometry of a monolayer composed of a grid of hexagonal digital cells representing the biological cells. The CA also tracks the states of all cells, that is, uninfected, infected, infected, nonlysable, or lysed. Uninfected cells can become infected with a certain probability depending on the viral particle concentration at the location of the cell. In addition, not all cells that are infected also lyse and release infectious viruses. In our model, the productively infected cells were assigned an internal clock, which determines when they lyse. The lysis clock starts to tick upon infection, and the expected lysis time is sampled from a uniform distribution between 1 and 5 dpi, as determined from our previous observations (Fig. 1; also see Movie S1 in the supplemental material), in agreement with data from the literature (102). When the clock indicates that a cell should lyse, the emerging viral particles are locally added to the PSE simulation using a cloud-in-cell assignment scheme (47). The PSE then diffuses the viral particles between time steps of the CA.
To enhance the relevance of the model, we included the following experimentally determined parameters: (i) the average size of a cell, (ii) the time lag for an infected cell to lyse, (iii) the probability for a GFP-positive cell to lyse, (iv) the diffusion constant of HAdV in the extracellular medium, (v) the probability of infection as a function of local virus concentration, (vi) the GFP intensity increase rate after infection, and (vii) the probability of cell death for uninfected cells (Fig. 5). The only parameter obtained from the literature was the amount of viral particles released from a lysed cell. It was estimated that one HAdV-infected cell releases 100,000 to 200,000 viral particles (40, 77). For the sake of simplicity we used 100,000 in our model, unless specified otherwise.
Fig 5.
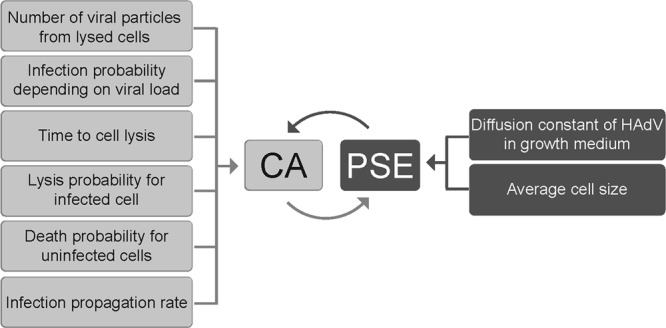
Parameters of the hybrid CA-PSE model. The parameters listed on the left-hand side affect the CA, while parameters listed on the right-hand side affect the PSE. Parameter values were all derived from experiments in this study, except the number of viral particles produced from a lytic infected cell, which was adapted from reference 40.
(i) Average size of a cell.
Our CA model uses a uniform hexagonal cell grid. The cell size was calculated from the average number of Hoechst-stained nuclei on a given area from near-confluent cells (Fig. 1B). Assuming that the approximate cell shape is a hexagon, we computed the inner radius (r) of the hexagon from the average cell area (A) using the formula . The calculated average radius of a cell was 12 ± 1 μm, which is in excellent agreement with direct measurements of cell size (data not shown).
(ii) Time for an infected cell to lyse.
Since cell lysis triggers secondary infection rounds, it is important to accurately estimate this parameter of the model. According to earlier reports, HAdV-infected cells are expected to lyse 1 to 5 dpi (102). Using live-cell imaging of PI, we observed that infected cells started to lyse 1 to 2 dpi, with a uniform probability distribution of up to 120 hpi (Fig. 1; also see Movie S1 in the supplemental material).
(iii) The probability for an infected cell to lyse.
We observed that for unknown reasons, not all GFP-positive infected cells lyse and produce a PQ within 5 dpi. The ratio between the numbers of PQs developed within 5 days and the number of GFP-positive cells before development of PQs (24 hpi) was 7.4% ± 1.2%.
Based on these findings, we defined an infected cell as one that can lyse with a probability of 0.074 during the 5-day time window. The probability that an infected cell entered a nonlysable state was 0.926.
(iv) Diffusion constant of HAdV in the extracellular medium.
The diffusion constant (D) of a given particle can be calculated theoretically or measured experimentally according to equation 2. HAdV particles have a complex shape. The icosahedral capsid is approximately 90 nm in diameter and contains 12 fibers, which project away from the capsid by about 37 nm (61). If Ad2 were an ideal sphere, D would be between 4.06 and 7.31 μm2/s for particles with and without fibers, respectively. We experimentally determined D for Ad2 by total internal reflection fluorescent (TIRF) microscopy of Ad2-atto488 and single-particle tracking analyses using spherical fluorescent beads as internal standards. Comparison of the experimental D values for these beads in cell growth medium, water, or agarose with theoretical values from equation 2 indicated good overall correlations, suggesting that our experimental procedures were valid (see Fig. S6A and B in the supplemental material). The experimentally determined DAd2-atto488 of 6.47 ± 19.45 μm2/s in medium was well within the range of the theoretically predicted values from equation 2. Equation 2 was valid, since our experimental setup involved mostly laminar Stokes flow, as indicated by the computed Reynolds numbers, which were far below 1 for beads from 38 to 1,000 nm in size (Table 1; also see Materials and Methods). As expected, DAd2-atto488 was dependent on the concentration of agarose in the semisolid medium (see Fig. S6C in the supplemental material). At agarose concentrations above 3%, DAd2-atto488 dropped below the values in pure solvent or agarose concentrations less than 3%, consistent with the diffusive behavior of particles in gels with mesh sizes larger than the particles.
(v) Probability of infection as a function of local virus concentration.
To fix the infection probability parameter in our model, we measured the relationship between the concentration of input Ad2-dE3B-GFP and the probability of infection of HLC-A549 (see Movie S4 in the supplemental material). The proportion of infected cells determined by automated computational cell segmentation using CellProfiler (16) increased with increasing amounts of virus 72 hpi (Fig. 6A). Similar results were obtained with Ad2-dE1-GFP see (Fig. S7A in the supplemental material). Based on these values, we determined how the infection probability depends on input virus. To obtain the probability of infection for every CA time step at 1-h sampling frequencies, we used the empirically determined distributions of probabilities at the local virus concentration for 72 h. This approach allowed accounting for the threshold TNAP needed for the successful infection of an individual cell. We thereby took into account potentially noninfectious virus particles and all particles that fail to successfully deliver their genome to the nucleus. The entire infection process was lumped into a single probability, which depends on the amount of input virus.
Fig 6.

Infection probability, GFP expression kinetics, and overall cell death are virus dose dependent. (A) Multisite time-lapse imaging of HLC-A549 cells infected with different amounts of virus. Automated computational cell segmentation using CellProfiler was used to count all cells and determine the fraction of infected cells. This allowed the measuring of the infection probability as a function of input virus protein concentration. Measurements were performed 72 hpi. (B) To convert the virus protein concentration to the number of viral particles, we used a theoretical number of HAdV particles (TNAP). It was determined from the protein mass of an individual adenovirus particle as described in equation 1. The mean GFP intensity (averaged per well) was measured for each virus concentration. Measurements were made per concentration and per time point with a time resolution of 1 h. This allowed calibrating the GFP intensity increase as a function of time and input Ad2-dE3B-GFP (see Fig. S7 and Movie S4 in the supplemental material). (C) Cells were imaged in the presence of propidium iodide dye (PI) and Hoechst 33342 dye (Hoechst) for 120.5 h. The number of PI-positive cells was plotted for infected (blue) and noninfected (red) cells. Quantification was by CellProfiler based on the Hoechst and PI signals. std, standard deviations.
(vi) GFP intensity rate increase after infection.
There was a difference in GFP intensity between the center of a PQ and its periphery (see Movie S1 and Fig. S2 in the supplemental material). A similar difference in intensity could be observed when cells were infected with different amounts of virus (see Movie S4). To quantify this intensity difference, cell monolayers were infected with different concentrations of Ad2-dE3B-GFP, and the mean GFP intensity (averaged per well) was measured for each virus concentration as a function of time (Fig. 6B). We found that the signal-intensity difference correlates with the amount of Ad2-dE3B-GFP used for infection. The obtained values were used to simulate GFP signals in the model. Similar measurements were also carried out and simulated for Ad2-dE1-GFP (see Fig. S7B in the supplemental material). In summary, the correlation of input virus and intensity of infection allows setting the corresponding kinetic parameters in the model.
(vii) Probability of cell death for uninfected cells.
Since dead PI-positive cells cannot be infected, we determined the amounts of dead cells as a function of time. Particularly toward later time points of infection imaging, we observed a significant number of GFP-negative cells turning PI positive (Fig. 1 and 3; also see Movie S1). This was independent of infection, as indicated by comparison of the number of PI-positive cells in infected and noninfected wells (Fig. 6C). The observed cytotoxicity is most likely caused by limiting cell culture and fluorescence imaging conditions. Based on the appearance of PI-positive cells over time, we computed the probability for an uninfected cell to lyse and incorporated this into our model.
In silico and biological plaques have similar features.
We next ran the hybrid CA-PSE model for Ad2-dE3B-GFP infection with the parameters described above and analyzed its output for PQs. We compared 15 in silico PQs to 15 biological PQs. The patterns predicted by the model resemble those of the biological PQs, including features such as noninfected cells inside the zone of PQs and out-lying infected cells (Fig. 7) (see Movie S5 in the supplemental material).
Fig 7.

Simulation output from the hybrid cellular automaton-particle strength exchange. An example of a simulation for AdV2-dE3B-GFP infection is shown. The figure shows the hexagonal CA cell mesh outlined in blue with color-coded cells: red, dead; green, infected. The green color intensities represent relative GFP levels (see Movie S5 in the supplemental material).
Using CellProfiler and custom-made software, we measured a number of phenotypic parameters of biological and in silico PQs, such as the mean radius, the mean number of infected and noninfected cells, and the mean speed of the spreading front, which was computed from the average change of radius over time. The average values of these parameters taken from 15 biological and in silico PQs are listed in Table 2. The radii and the speeds of the spreading front of biological and in silico PQs were qualitatively similar, while there were small differences in the number of total cells and the number of infected cells within PQs. Since both of these phenotypic features depend on the cell shape, we believe that the observed difference is due to the model that assumes a uniform hexagonal grid with all cells having the same shape and size. The model does not account for biological cell-to-cell variability, which can be due to cell division or migration. We conclude that the model has a good overall ability to predict nongeometric phenotypic features of PQs and their emergence and propagation.
Table 2.
Phenotypic parameters of biological and in silico plaquesa (PQ)
| PQ type | Mean radius (μm) | No. of infected cells | Total no. of cells | Speed of spreading front (μm/h) |
|---|---|---|---|---|
| Biological | 471 ± 58 | 629 ± 262 | 1,776 ± 418 | 4 ± 1 |
| In silico | 513 ± 55 | 347 ± 21 | 1,591 ± 334 | 5.8 ± 0.6 |
See Materials and Methods for details on the calculation methods.
Radial distribution function for quantitative model validation.
We next validated quantitative fluorescence intensity distributions of individual cells within zones of PQ predicted by the model. To measure changes of the signal intensity from the center of a PQ to the periphery, we used a radial distribution function (RDF). This renders the readout invariant to sample rotation, a suitable feature of radially symmetric PQs. The RDF quantifies the average fluorescence intensity as a function of distance from the center of a PQ, obtained by averaging the fluorescence intensity along concentric circles (45). We first measured the RDF of a PQ from single-round infections with Ad2-dE1-GFP. As indicated in Fig. 8A, the RDF captures the visual observation that intensity decreased with distance from the PQ center. In addition, the distance-dependent decrease of GFP fluorescence intensity, observed in both experimental and simulated RDFs, quantitatively reflected the signal intensity observed in individual cells of biological PQs. The RDF intensity profile thus is a useful tool to compare in silico PQs to biological PQs, in particular if RDFs from multiple PQs are averaged to iron out the inherent noise in both in silico and biological PQs.
Fig 8.

Model validation by radial distribution function of PQ reveals how local HAdV concentrations affect infection. (A) The micrograph and the fluorescence intensity profile depicted in the line graph represent a PQ from a single round of HLC-A549 infection with Ad2-dE1-GFP as analyzed by the radial distribution function (RDF). The RDF provides a distance-dependent sampling of the mean fluorescence intensity averaged around concentric rings around the PQ center. The radius (r) of a PQ is defined as the distance between the PQ center and the radial position where the fluorescence intensity drops to the level of background intensity, which was estimated from cells in uninfected control wells. Panels B and C show average RDFs from 15 different experimental PQs with Ad2-dE3B-GFP (B) or simulated PQs (C) at 113 hpi (solid line), including the ±1 sigma band (dashed lines), and the background fluorescence from the experimental images (dotted line). Fluorescence values were obtained using linear interpolation of the experimental calibration curve. (C) The number of released progeny virus particles was assumed to be 100,000 per lytic infected cell. Hyperinfection of cells close to the lytic infected cell in the PQ center was allowed in the simulation. (D) Average simulated RDF without hyperinfection at 113 hpi. (E) Average simulated mean RDFs for different numbers of released progeny viruses per lysed cell at 113 hpi, 50,000 particles (green), 100,000 particles (blue), and 200,000 particles (red), allowing for hyperinfection. (F) Three representative examples for time-resolved PQ formation from Ad2-dE3B-GFP-infected HLC-A549 cells (colored lines) and a simulated PQ using 100,000 released particles per cell, allowing for hyperinfection (dashed gray line). The observation period was from 43 to 113 hpi.
The virus concentration gradient determines the size of plaques.
We next compared the RDFs from experimental PQs and simulated PQs using replicating Ad2-dE3B-GFP. From averaged results of 15 experimental and 15 independent simulated PQs, we found that the intensity decrease of infection was similar in both cases and was strongly dependent on the distance from the PQ center (Fig. 8B and C). We conclude that the distance-dependent intensity decrease of infection is a general feature in PQs of both replicating and nonreplicating HAdVs. Our model showed that this distance-dependent intensity decrease was caused by a concentration gradient of free virus particles formed as a result of virus release from an infected cell and free diffusion of virus in the medium. We suggest that this mechanism is responsible for the distance-dependent intensity decrease in the biological system.
High local virus concentrations lead to hyperinfection.
The averaged biological and in silico RDFs had a good overall fit of GFP intensities. For example, the fluorescence intensity dropped to half of the center value at about 4 cell diameters (150 μm) from the PQ center in both cases. We hypothesized that the significant difference between the GFP intensity in the center and the periphery was due to a local hyperinfection of cells (with MOIs much greater than 1) with Ad2-dE3B-GFP or Ad2-dE1A-GFP in close proximity to the lysed donor cell in the center. We simulated conditions to suppress the impact of hyperinfection on the simulated GFP intensity. For this, we fixed the maximum GFP intensity that could be reached by a simulated cell to experimentally measured average GFP intensities obtained with a virus concentration of 0.05 μg/μl (MOI, 104). Here, virus concentrations greater than 0.05 μg/μl have the same impact on the level of GFP intensity as the concentration of 0.05 μg/μl (Fig. 6A). Under these conditions, the GFP intensity peak around the PQ center disappeared from the simulated RDF (Fig. 8D), in contrast to the nonrestricted simulation (Fig. 8C). We concluded that the high level of infection in the closest proximity of the lysed cell was the result of a high local concentration of released virus particles, leading to local hyperinfection.
An estimation of the number of released virus particles.
The number of released virus particles from infected cells may vary from cell to cell. Population values for virus particles produced per cell center around 100,000 (40, 77). We computed different RDFs for different numbers of released particles and averaged them from 15 in silico simulations (Fig. 8E). As expected, the RDF intensity increased with increasing numbers of released viruses from the lytic infected cell in the PQ center. This led to a proportional increase in the radius of the PQs, in the range of 300, 400, and 500 μm for 50,000, 100,000, and 200,000 particles, respectively. This indicated that a value of 100,000 to 200,000 released virus particles per lysed cell best fits with the experimental data (compare Fig. 8B to E). This conclusion was further supported by the notion that the growth of simulated PQ was similar to the growth of experimental PQs (Fig. 8F). We concluded that the RDF-based intensity profile is a sensitive tool to quantify the effective radius of PQs. Moreover, the number of released particles per lysed cell has an important impact on the spread of HAdVs, and approximately 100,000 particles being released from infected cells matches well with the experimental dynamics of our system.
DISCUSSION
The mode of virus transmission contributes to disease progression and pathogenesis, but it is not easy to determine if a virus is transmitted in a cell-free or cell-associated manner, since both modes can involve extracellular viruses. In this study, we used plaque assays for a computational model describing adenovirus spread between cells. Plaque assays are a classical method to determine viral titers (27). The processes occurring during plaque formation or virus spreading are complex and variable between different viruses. For example, the spread of enveloped viruses may occur as a result of mixed processes of cell-free and cell-to-cell transmissions (83). Our work here shows that diffusion has a key role in the cell-free transmission of species C HAdV-2. Employing TIRF microscopy and virus tracking, we directly measured the diffusion constant of HAdV. By incorporating this measurement in a model for cell-free virus transmission, we show that an invariable diffusion constant of HAdV is sufficient to largely describe the spreading of virus in the course of plaque formation in monolayers.
Our study shows that HAdV-2/5 spreads from infected to noninfected cells in a monolayer predominantly by the cell-free mode. We base this conclusion on several lines of experimental evidence. First, HAdV spread occurred only if the infected donor cell underwent lysis. Second, viral spreading was strongly affected by convection. We show by time-lapse epifluorescence microscopy that convection is largely attenuated on cells overlaid with semisolid agarose medium. Significantly, the plaques in tilted plates formed underneath semisolid medium had a round appearance. Third, extracellular antibodies largely neutralized adenovirus spreading.
From these findings, we established a computational model for the propagation of HAdV infection in cultured cells. It is a hybrid, discrete, and spatiotemporal model with two random components, the time from cell infection to lysis and the number of progeny viruses released upon lysis. A uniform distribution for the former is justified, since the mechanism of lysis is not known, and for the latter we found a value of 100,000 virus particles per cell to best fit the experimental data. Our multiscale model combines a CA and a partial differential equation, which was discretized to describe the diffusion of viruses in the cell-free environment using the PSE (24). PSE is a powerful method, as shown previously for simulations of biological diffusion processes (85, 87). To our knowledge, the model presented here is the first CA-PSE hybrid model. The model demonstrates good predictive abilities for both qualitative and quantitative phenotypic features of viral spreading, although it does not take into account the movements of cells and involves simple hexagonal grid geometry (76). The model quantitatively describes that HAdV spreads by diffusion and, under some conditions, advection components.
We anticipate that passive mass transfer processes control the progression of infection in confined environments, particularly those prone to bulk motions, such as the extracellular fluid in epithelial tissues. As shown here, bulk motions affect the local concentrations of virus particles around uninfected cells and influence the probability of infection, as documented by hyperinfection. This suggests that high-multiplicity infections may have pathological relevance. Additionally, cell-free viral transmissions drive lytic infections with large burst sizes, enabling infections of neighboring cells by avidity binding to low-affinity receptors, for example, binding of oncolytic species B1 HAdV to CD46 (105). Large burst sizes can also compensate for genetic deficiencies of individual particles by transcomplementation.
The modeling platform established here provides a basis for analyzing cell-free aspects of both lytic and nonlytic viral transmissions. Cell-free lytic transmissions widely occur for both enveloped and nonenveloped viruses. Examples for the former are poxviruses or measles virus, and the latter are picornaviruses, reoviruses, or adenoviruses (3, 95). Cell-free transmissions require neither particular cell-cell contact sites nor the downregulation of viral receptors from infected cells to detach viruses from the producer cell. Cell-free transmissions are also a major pathway for viral spread between individuals through body fluids or organ transplantations. This is also important for viruses, which use intraorganismic cell-cell transmission routes, such as HIV, HCV, or herpesviruses (reviewed in references 72 and 83). In addition, viral spreading by cell lysis is crucial for the therapeutic efficacy of oncolytic viruses, including HAdV (5, 80, 84).
We expect that our model will be useful to analyze cell-free virus transmissions in different disease processes, where it is difficult to experimentally determine the specific impact of cell-free or cell-cell transmission modes. For this, the diffusive properties of most currently known viruses can be accurately predicted using the Einstein-Stokes equation, and the CA component of the hybrid model can be readily extended to include proximity effects, which will allow the modeling of cell-cell spreading.
Our model for the passive mass transfer of cell-free viruses can potentially be combined with models for cell-to-cell spread, such as a stochastic model described for Sendai virus spread (21). Combining discrete and random modeling in lytic and nonlytic transmissions can be interesting for enveloped viruses. For example, extracellular enveloped vaccinia viruses use a cell-cell transmission mode to enhance spreading beyond the speed of a single replication cycle (26, 88), whereas intracellular viruses and inclusion particles of aggregated viruses are released upon cell lysis (95). Likewise, the impact of cell-free transmission on human cytomegalovirus (HCMV) or hepatitis virus C (HCV) infections are unknown. It is remarkable, however, that HCMV from endothelial cells is transmitted between endothelial cells by cell-cell contacts and avoids the cell-free route, whereas HCMV from fibroblasts chooses a cell-free route to infect fibroblasts or endothelial cells (90). Extracellular HCMVs are prevalent, since hyperimmune globulins against HCMV exhibit strong neutralization effects in decidual organ cultures (110). Similarly, antibodies against the hypervariable region 1 or the CD81 binding site of the HCV E2 glycoprotein have virus-neutralizing effects in cocultures of producer and acceptor cells, although these effects vary between genotypes, suggesting that virus-specific factors also contribute the transmission mode (13). For HCMV, it has been shown that the transmission depends on the protein composition of the viruses (90). In addition, the physiology of the tissue plays a major role for the transmission mode. The tight cell-cell contacts in the liver, for example, may favor cell-cell transmission routes of HCV (62), whereas tissues with looser cell-cell contacts may enable viral spread by diffusion (41, 94).
For therapeutic purposes, this opens the possibility of experimentally degrading parts of the extracellular matrix or triggering apoptosis in tumor tissues to enhance viral spreading within the tumor by diffusive processes (94). Furthermore, inflammatory conditions with rapidly changing compositions of the extracellular matrix, for example, in periodontitis (93), may enhance viral susceptibility by diffusive spreading processes. Our work here lays a foundation for the elucidation of viral cell transmission mechanisms that are determined by parameters which are difficult to measure in tissues, such as diffusive properties of viruses in extracellular matrix of connective tissue, airway mucus, intestines, or cervicovaginal tracts (42, 53, 67).
Supplementary Material
ACKNOWLEDGMENTS
We thank Julia Reinert for help in confirming antiserum activity, Jo Helmuth for discussion, Martin Engelke for support with TIRF microscopy, Bettina Cardel for cell culture, I-Hsuan Wang for materials for the experiments with fluorescently labeled HAdV, and other current and former members of the Greber and Sbalzarini groups for discussions and support. We thank Anja Ehrhardt (Ludwig Maximilians University of Munich, Germany) for the generous gift of neutralizing anti-Ad5 antiserum. We also thank the following members of the MOSAIC Group, ETH Zurich: Janick Cardinale for his help with measuring RDFs from images and Omar Awile, Christian Müller, and Rajesh Ramaswamy for their help with the PSE simulation code.
This work was supported by a grant from the Swiss National Science Foundation (ProDoc PDFMP3_124927 to U.F.G.), the Swiss SystemsX.ch initiative (grant InfectX to U.F.G. and grant LipidX to U.F.G. and I.F.S.), and the Kanton Zürich (U.F.G.).
Footnotes
Published ahead of print 11 July 2012
Supplemental material for this article may be found at http://jvi.asm.org/.
REFERENCES
- 1. Ahmed R, Graham AF. 1977. Persistent infections in L cells with temperature-sensitive mutants of reovirus. J. Virol. 23:250–262 [DOI] [PMC free article] [PubMed] [Google Scholar]
- 2. Amstutz B, et al. 2008. Subversion of CtBP1 controlled macropinocytosis by human adenovirus serotype 3. EMBO J. 27:956–966 [DOI] [PMC free article] [PubMed] [Google Scholar]
- 3. Bais S, Bartee E, Rahman MM, McFadden G, Cogle CR. 2012. Oncolytic virotherapy for hematological malignancies. Adv. Virol. 2012:186512. [DOI] [PMC free article] [PubMed] [Google Scholar]
- 4. Bankhead A, et al. 2011. A simulation framework to investigate in vitro viral infection dynamics. J. Comput. Sci. doi:10.1016/j.jocs.2011.08.007 [DOI] [PMC free article] [PubMed] [Google Scholar]
- 5. Barton KN, et al. 2006. Second-generation replication-competent oncolytic adenovirus armed with improved suicide genes and ADP gene demonstrates greater efficacy without increased toxicity. Mol. Ther. 13:347–356 [DOI] [PubMed] [Google Scholar]
- 6. Beauchemin C, Samuel J, Tuszynski J. 2005. A simple cellular automaton model for influenza A viral infections. J. Theor. Biol. 232:223–234 [DOI] [PubMed] [Google Scholar]
- 7. Benson SD, Bamford JK, Bamford DH, Burnett RM. 1999. Viral evolution revealed by bacteriophage PRD1 and human adenovirus coat protein structures. Cell 98:825–833 [DOI] [PubMed] [Google Scholar]
- 8. Bergelson JM, et al. 1997. Isolation of a common receptor for coxsackie B viruses and adenoviruses 2 and 5. Science 275:1320–1323 [DOI] [PubMed] [Google Scholar]
- 9. Berk AJ. 2007. Adenoviridae: the viruses and their replication, p 2355–2436 In Knipe DM, Howley PM. (ed), Fields virology, 5 ed, vol 2 Lippincott Williams & Wilkins, Philadelphia, PA [Google Scholar]
- 10. Berk AJ. 2005. Recent lessons in gene expression, cell cycle control, and cell biology from adenovirus. Oncogene 24:7673–7685 [DOI] [PubMed] [Google Scholar]
- 11. Bocharov GA, Romanyukha AA. 1994. Mathematical model of antiviral immune response III. Influenza A virus infection. J. Theor. Biol. 167:323–360 [DOI] [PubMed] [Google Scholar]
- 12. Bremner KH, et al. 2009. Adenovirus transport via direct interaction of cytoplasmic dynein with the viral capsid hexon subunit. Cell Host Microbe 6:523–535 [DOI] [PMC free article] [PubMed] [Google Scholar]
- 13. Brimacombe CL, et al. 2011. Neutralizing antibody-resistant hepatitis C virus cell-to-cell transmission. J. Virol. 85:596–605 [DOI] [PMC free article] [PubMed] [Google Scholar]
- 14. Burckhardt CJ, Greber UF. 2009. Virus movements on the plasma membrane support infection and transmission between cells. PLoS Pathog. 5:e1000621 doi:10.1371/journal.ppat.1000621 [DOI] [PMC free article] [PubMed] [Google Scholar]
- 15. Burckhardt CJ, et al. 2011. Drifting motions of the adenovirus receptor CAR and immobile integrins initiate virus uncoating and membrane lytic protein exposure. Cell Host Microbe 10:105–117 [DOI] [PubMed] [Google Scholar]
- 16. Carpenter A, et al. 2006. CellProfiler: image analysis software for identifying and quantifying cell phenotypes. Genome Biol. 7:R100 doi:10.1186/gb-2006-7-10-r100 [DOI] [PMC free article] [PubMed] [Google Scholar]
- 17. Charlotte M, et al. 2001. Light deflection and convection in diffusion experiments using holographic interferometry. J. Phys. D Appl. Phys. 34:3088 [Google Scholar]
- 18. Chen EC, et al. 2011. Cross-species transmission of a novel adenovirus associated with a fulminant pneumonia outbreak in a New World monkey colony. PLoS Pathog. 7:e1002155 doi:10.1371/journal.ppat.1002155 [DOI] [PMC free article] [PubMed] [Google Scholar]
- 19. Chen P, Tian J, Kovesdi I, Bruder JT. 1998. Interaction of the adenovirus 14.7-kDa protein with FLICE inhibits Fas ligand-induced apoptosis. J. Biol. Chem. 273:5815–5820 [DOI] [PubMed] [Google Scholar]
- 20. Chen PH, Ornelles DA, Shenk T. 1993. The adenovirus L3 23-kilodalton proteinase cleaves the amino-terminal head domain from cytokeratin 18 and disrupts the cytokeratin network of HeLa cells. J. Virol. 67:3507–3514 [DOI] [PMC free article] [PubMed] [Google Scholar]
- 21. Clark N, et al. 2011. Stochastic model of virus and defective interfering particle spread across mammalian cells with immune response. arXiv:1108.4901v1 [q-bio.PE]:1–22. Cornell University Library, Ithaca, NY [Google Scholar]
- 22. Colbere-Garapin F, Christodoulou C, Crainic R, Pelletier I. 1989. Persistent poliovirus infection of human neuroblastoma cells. Proc. Natl. Acad. Sci. U. S. A. 86:7590–7594 [DOI] [PMC free article] [PubMed] [Google Scholar]
- 23. Davis DM, et al. 2003. The protean immune cell synapse: a supramolecular structure with many functions. Semin. Immunol. 15:317–324 [DOI] [PubMed] [Google Scholar]
- 24. Degond P, Mas-Gallic S. 1989. The weighted particle method for convection-diffusion equations. Part 1: the case of an isotropic viscosity. Math. Comput. 53:485–507 [Google Scholar]
- 25. de la Torre JC, Davila M, Sobrino F, Ortin J, Domingo E. 1985. Establishment of cell lines persistently infected with foot-and-mouth disease virus. Virology 145:24–35 [DOI] [PubMed] [Google Scholar]
- 26. Doceul V, Hollinshead M, van der Linden L, Smith GL. 2010. Repulsion of superinfecting virions: a mechanism for rapid virus spread. Science 327:873–876 [DOI] [PMC free article] [PubMed] [Google Scholar]
- 27. Dulbecco R. 1952. Production of plaques in monolayer tissue cultures by single particles of an animal virus. Proc. Natl. Acad. Sci. U. S. A. 38:747–752 [DOI] [PMC free article] [PubMed] [Google Scholar]
- 28. Einstein A. 1905. Über die von der molekularkinetischen Theorie der Wärme geforderte Bewegung von in ruhenden Flüssigkeiten suspendierten Teilchen. Annalen Phys. 322:549–560 [Google Scholar]
- 29. Engelke MF, Burckhardt CJ, Morf MK, Greber UF. 2011. The dynactin complex enhances the speed of microtubule-dependent motions of adenovirus both towards and away from the nucleus. Viruses 3:233–253 [DOI] [PMC free article] [PubMed] [Google Scholar]
- 30. Ewers H, et al. 2005. Single-particle tracking of murine polyoma virus-like particles on live cells and artificial membranes. Proc. Natl. Acad. Sci. U. S. A. 102:15110–15115 [DOI] [PMC free article] [PubMed] [Google Scholar]
- 31. Fallaux FJ, et al. 1996. Characterization of 911: a new helper cell line for the titration and propagation of early region 1-deleted adenoviral vectors. Hum. Gene Ther. 7:215–222 [DOI] [PubMed] [Google Scholar]
- 32. Gaggar A, Shayakhmetov DM, Lieber A. 2003. CD46 is a cellular receptor for group B adenoviruses. Nat. Med. 9:1408–1412 [DOI] [PubMed] [Google Scholar]
- 33. Garnett CT, Erdman D, Xu W, Gooding LR. 2002. Prevalence and quantitation of species C adenovirus DNA in human mucosal lymphocytes. J. Virol. 76:10608–10616 [DOI] [PMC free article] [PubMed] [Google Scholar]
- 34. Gastaldelli M, et al. 2008. Infectious adenovirus type 2 transport through early but not late endosomes. Traffic 9:2265–2278 [DOI] [PubMed] [Google Scholar]
- 35. Gazzola M, et al. 2009. A stochastic model for microtubule motors describes the in vivo cytoplasmic transport of human adenovirus. PLoS Comp. Biol. 5:e1000623 doi:10.1371/journal.pcbi.1000623 [DOI] [PMC free article] [PubMed] [Google Scholar]
- 36. Gooding LR, Elmore LW, Tollefson AE, Brady HA, Wold WS. 1988. A 14,700 MW protein from the E3 region of adenovirus inhibits cytolysis by tumor necrosis factor. Cell 53:341–346 [DOI] [PubMed] [Google Scholar]
- 37. Greber UF, Way M. 2006. A super highway to virus infection. Cell 124:741–754 [DOI] [PubMed] [Google Scholar]
- 38. Greber UF, Webster P, Weber J, Helenius A. 1996. The role of the adenovirus protease on virus entry into cells. EMBO J. 15:1766–1777 [PMC free article] [PubMed] [Google Scholar]
- 39. Greber UF, Willetts M, Webster P, Helenius A. 1993. Stepwise dismantling of adenovirus 2 during entry into cells. Cell 75:477–486 [DOI] [PubMed] [Google Scholar]
- 40. Green M. 1962. Studies on the biosynthesis of viral DNA. Cold Spring Harbor Symp. Quant. Biol. 27:219–235 [DOI] [PubMed] [Google Scholar]
- 41. Guedan S, et al. 2010. Hyaluronidase expression by an oncolytic adenovirus enhances its intratumoral spread and suppresses tumor growth. Mol. Ther. 18:1275–1283 [DOI] [PMC free article] [PubMed] [Google Scholar]
- 42. Halliday NL, Tomasek JJ. 1995. Mechanical properties of the extracellular matrix influence fibronectin fibril assembly in vitro. Exp. Cell Res. 217:109–117 [DOI] [PubMed] [Google Scholar]
- 43. Hausl M, et al. 2010. Hyperactive sleeping beauty transposase enables persistent phenotypic correction in mice and a canine model for hemophilia B. Mol. Ther. 18:1896–1906 [DOI] [PMC free article] [PubMed] [Google Scholar]
- 44. Hayashi S, Hogg JC. 2007. Adenovirus infections and lung disease. Curr. Opin. Pharmacol. 7:237–243 [DOI] [PMC free article] [PubMed] [Google Scholar]
- 45. Helmuth JA, Burckhardt CJ, Greber UF, Sbalzarini IF. 2009. Shape reconstruction of subcellular structures from live cell fluorescence microscopy images. J. Struct. Biol. 167:1–10 [DOI] [PubMed] [Google Scholar]
- 46. Hilgendorf A, et al. 2003. Two distinct transport motifs in the adenovirus E3/10.4-14.5 proteins act in concert to down-modulate apoptosis receptors and the epidermal growth factor receptor. J. Biol. Chem. 278:51872–51884 [DOI] [PubMed] [Google Scholar]
- 47. Hockney RW, Eastwood JW. 1989. Computer simulation using particles. Taylor & Francis, Bristol, PA [Google Scholar]
- 48. Imelli N, Ruzsics Z, Puntener D, Gastaldelli M, Greber UF. 2009. Genetic reconstitution of the human adenovirus type 2 temperature-sensitive 1 mutant defective in endosomal escape. Virol. J. 6:174. [DOI] [PMC free article] [PubMed] [Google Scholar]
- 49. Incropera FP, DeWitt DP. 1990. Fundamentals of heat and mass transfer, 3rd ed John Wiley & Sons, New York, NY [Google Scholar]
- 50. Karim MFA, Ismail AIM, Ching HB. 2009. Cellular automata modelling of hantarvirus infection. Chaos Solitons Fractals 41:2847–2853 [Google Scholar]
- 51. Komarova NL. 2007. Viral reproductive strategies: how can lytic viruses be evolutionarily competitive? J. Theor. Biol. 249:766–784 [DOI] [PubMed] [Google Scholar]
- 52. Krilov LR. 2005. Adenovirus infections in the immunocompromised host. Pediatr. Infect. Dis. J. 24:555–556 [DOI] [PubMed] [Google Scholar]
- 53. Lai SK, Wang YY, Cone R, Wirtz D, Hanes J. 2009. Altering mucus rheology to “solidify” human mucus at the nanoscale. PLoS One 4:e4294 doi:10.1371/journal.pone.0004294 [DOI] [PMC free article] [PubMed] [Google Scholar]
- 54. Leopold PL, et al. 2000. Dynein- and microtubule-mediated translocation of adenovirus serotype 5 occurs after endosomal lysis. Hum. Gene Ther. 11:151–165 [DOI] [PubMed] [Google Scholar]
- 55. Lewis PF, et al. 2009. A community-based outbreak of severe respiratory illness caused by human adenovirus serotype 14. J. Infect. Dis. 199:1427–1434 [DOI] [PubMed] [Google Scholar]
- 56. Li T, Kheifets S, Medellin D, Raizen M. 2010. Measurement of the instantaneous velocity of a Brownian particle. Science 328:1673–1675 [DOI] [PubMed] [Google Scholar]
- 57. Liang M. 2012. Clinical development of oncolytic viruses in China. Curr. Pharm. Biotechnol. 13:1852–1857 [DOI] [PubMed] [Google Scholar]
- 58. Lichtenstein DL, Toth K, Doronin K, Tollefson AE, Wold WS. 2004. Functions and mechanisms of action of the adenovirus E3 proteins. Int. Rev. Immunol. 23:75–111 [DOI] [PubMed] [Google Scholar]
- 59. Lichtenstein DL, Wold WS. 2004. Experimental infections of humans with wild-type adenoviruses and with replication-competent adenovirus vectors: replication, safety, and transmission. Cancer Gene Ther. 11:819–829 [DOI] [PubMed] [Google Scholar]
- 60. Lindert S, Silvestry M, Mullen TM, Nemerow GR, Stewart PL. 2009. Cryo-electron microscopy structure of an adenovirus-integrin complex indicates conformational changes in both penton base and integrin. J. Virol. 83:11491–11501 [DOI] [PMC free article] [PubMed] [Google Scholar]
- 61. Liu H, et al. 2010. Atomic structure of human adenovirus by cryo-EM reveals interactions among protein networks. Science 329:1038–1043 [DOI] [PMC free article] [PubMed] [Google Scholar]
- 62. Loo YM, et al. 2006. Viral and therapeutic control of IFN-beta promoter stimulator 1 during hepatitis C virus infection. Proc. Natl. Acad. Sci. U. S. A. 103:6001–6006 [DOI] [PMC free article] [PubMed] [Google Scholar]
- 63. Lutschg V, Boucke K, Hemmi S, Greber UF. 2011. Chemotactic anti-viral cytokines promote infectious apical entry of human adenovirus into polarized epithelial cells. Nature Communications, vol 2 Nature Publishing Group; doi:10.1038/ncomms1391 [DOI] [PMC free article] [PubMed] [Google Scholar]
- 64. Mallet DG, Heymer K-J, Rank RG, Wilson DP. 2009. Chlamydial infection and spatial ascension of the female genital tract: a novel hybrid cellular automata and continuum mathematical model. FEMS Immunol. Med. Microbiol. 57:173–182 [DOI] [PMC free article] [PubMed] [Google Scholar]
- 65. Mangel WF, Baniecki ML, McGrath WJ. 2003. Specific interactions of the adenovirus proteinase with the viral DNA, an 11-amino-acid viral peptide, and the cellular protein actin. Cell. Mol. Life Sci. 60:2347–2355 [DOI] [PMC free article] [PubMed] [Google Scholar]
- 66. Massanella M, et al. 2009. Antigp41 antibodies fail to block early events of virological synapses but inhibit HIV spread between T cells. AIDS 23:183–188 [DOI] [PubMed] [Google Scholar]
- 67. Matsui H, et al. 2006. A physical linkage between cystic fibrosis airway surface dehydration and Pseudomonas aeruginosa biofilms. Proc. Natl. Acad. Sci. U. S. A. 103:18131–18136 [DOI] [PMC free article] [PubMed] [Google Scholar]
- 68. Mazurov D, Ilinskaya A, Heidecker G, Lloyd P, Derse D. 2010. Quantitative comparison of HTLV-1 and HIV-1 cell-to-cell infection with new replication dependent vectors. PLoS Pathog. 6:e1000788 doi:10.1371/journal.ppat.1000788 [DOI] [PMC free article] [PubMed] [Google Scholar]
- 69. McGavern DB, Kang SS. 2011. Illuminating viral infections in the nervous system. Nat. Rev. Immunol. 11:318–329 [DOI] [PMC free article] [PubMed] [Google Scholar]
- 70. Meier O, Greber UF. 2003. Adenovirus endocytosis. J. Gene Med. 5:451–462 [DOI] [PubMed] [Google Scholar]
- 71. Metzgar D, et al. 2007. Abrupt emergence of diverse species B adenoviruses at US military recruit training centers. J. Infect. Dis. 196:1465–1473 [DOI] [PubMed] [Google Scholar]
- 72. Mothes W, Sherer NM, Jin J, Zhong P. 2010. Virus cell-to-cell transmission. J. Virol. 84:8360–8368 [DOI] [PMC free article] [PubMed] [Google Scholar]
- 73. Munoz FM, Piedra PA, Demmler GJ. 1998. Disseminated adenovirus disease in immunocompromised and immunocompetent children. Clin. Infect. Dis. 27:1194–1200 [DOI] [PubMed] [Google Scholar]
- 74. Nakano MY, Greber UF. 2000. Quantitative microscopy of fluorescent adenovirus entry. J. Struct. Biol. 129:57–68 [DOI] [PubMed] [Google Scholar]
- 75. Nilsson EC, et al. 2011. The GD1a glycan is a cellular receptor for adenoviruses causing epidemic keratoconjunctivitis. Nat. Med. 17:105–109 [DOI] [PubMed] [Google Scholar]
- 76. Othmer HG, Scriven LE. 1971. Instability and dynamic pattern in cellular networks. J. Theor. Biol. 32:507–537 [DOI] [PubMed] [Google Scholar]
- 77. Parks WP, Melnick JL, Rongey R, Mayor HD. 1967. Physical assay and growth cycle studies of a defective adeno-satellite virus. J. Virol. 1:171–180 [DOI] [PMC free article] [PubMed] [Google Scholar]
- 78. Pearson JE, Krapivsky P, Perelson AS. 2011. Stochastic theory of early viral infection: continuous versus burst production of virions. PLoS Comput. Biol. 7:e1001058 doi:10.1371/journal.pcbi.1001058 [DOI] [PMC free article] [PubMed] [Google Scholar]
- 79. Perelson AS. 2002. Modelling viral and immune system dynamics. Nat. Rev. Immunol. 2:28–36 [DOI] [PubMed] [Google Scholar]
- 80. Pesonen S, Kangasniemi L, Hemminki A. 2010. Oncolytic adenoviruses for the treatment of human cancer: focus on translational and clinical data. Mol. Pharm. 8:12–28 [DOI] [PubMed] [Google Scholar]
- 81. Puntener D, et al. 2011. Stepwise loss of fluorescent core protein V from human adenovirus during entry into cells. J. Virol. 85:481–496 [DOI] [PMC free article] [PubMed] [Google Scholar]
- 82. Reddy VS, Natchiar SK, Stewart PL, Nemerow GR. 2010. Crystal structure of human adenovirus at 3.5 A resolution. Science 329:1071–1075 [DOI] [PMC free article] [PubMed] [Google Scholar]
- 83. Sattentau Q. 2008. Avoiding the void: cell-to-cell spread of human viruses. Nat. Rev. Microbiol. 6:815–826 [DOI] [PubMed] [Google Scholar]
- 84. Sauthoff H, et al. 2003. Intratumoral spread of wild-type adenovirus is limited after local injection of human xenograft tumors: virus persists and spreads systemically at late time points. Hum. Gene Ther. 14:425–433 [DOI] [PubMed] [Google Scholar]
- 85. Sbalzarini IF, Hayer A, Helenius A, Koumoutsakos P. 2006. Simulations of (an)isotropic diffusion on curved biological surfaces. Biophys. J. 90:878–885 [DOI] [PMC free article] [PubMed] [Google Scholar]
- 86. Sbalzarini IF, Koumoutsakos P. 2005. Feature point tracking and trajectory analysis for video imaging in cell biology. J. Struct. Biol. 151:182–195 [DOI] [PubMed] [Google Scholar]
- 87. Sbalzarini IF, Mezzacasa A, Helenius A, Koumoutsakos P. 2005. Effects of organelle shape on fluorescence recovery after photobleaching. Biophys. J. 89:1482–1492 [DOI] [PMC free article] [PubMed] [Google Scholar]
- 88. Scaplehorn N, et al. 2002. Grb2 and Nck act cooperatively to promote actin-based motility of vaccinia virus. Curr. Biol. 12:740–745 [DOI] [PubMed] [Google Scholar]
- 89. Schmitz H, Wigand R, Heinrich W. 1983. Worldwide epidemiology of human adenovirus infections. Am. J. Epidemiol. 117:455–466 [DOI] [PubMed] [Google Scholar]
- 90. Scrivano L, Sinzger C, Nitschko H, Koszinowski UH, Adler B. 2011. HCMV spread and cell tropism are determined by distinct virus populations. PLoS Pathog. 7:e1001256 doi:10.1371/journal.ppat.1001256 [DOI] [PMC free article] [PubMed] [Google Scholar]
- 91. Sigal A, et al. 2011. Cell-to-cell spread of HIV permits ongoing replication despite antiretroviral therapy. Nature 477:95–98 [DOI] [PubMed] [Google Scholar]
- 92. Sirena D, et al. 2004. The human membrane cofactor CD46 is a receptor for species B adenovirus serotype 3. J. Virol. 78:4454–4462 [DOI] [PMC free article] [PubMed] [Google Scholar]
- 93. Slots J. 2010. Human viruses in periodontitis. Periodontol. 2000 53:89–110 [DOI] [PubMed] [Google Scholar]
- 94. Smith E, Breznik J, Lichty BD. 2011. Strategies to enhance viral penetration of solid tumors. Hum. Gene Ther. 22:1053–1060 [DOI] [PubMed] [Google Scholar]
- 95. Smith GL, Law M. 2004. The exit of vaccinia virus from infected cells. Virus Res. 106:189–197 [DOI] [PubMed] [Google Scholar]
- 96. Spector D, Goldman R. 2006. Basic methods in microscopy. Protocols and concepts from cells: a laboratory manual. Cold Spring Harbor Laboratory Press, Cold Spring Harbor, NY [Google Scholar]
- 97. Stafford MA, et al. 2000. Modeling plasma virus concentration during primary HIV infection. J. Theor. Biol. 203:285–301 [DOI] [PubMed] [Google Scholar]
- 98. Strunze S, et al. 2011. Kinesin-1-mediated capsid disassembly and disruption of the nuclear pore complex promote virus infection. Cell Host Microbe 10:210–223 [DOI] [PubMed] [Google Scholar]
- 99. Suomalainen M, et al. 1999. Microtubule-dependent minus and plus end-directed motilities are competing processes for nuclear targeting of adenovirus. J. Cell Biol. 144:657–672 [DOI] [PMC free article] [PubMed] [Google Scholar]
- 100. Tam PE, Messner RP. 1999. Molecular mechanisms of coxsackievirus persistence in chronic inflammatory myopathy: viral RNA persists through formation of a double-stranded complex without associated genomic mutations or evolution. J. Virol. 73:10113–10121 [DOI] [PMC free article] [PubMed] [Google Scholar]
- 101. Tang Q, Lundholm-Beauchamp U, Ginsberg HS. 1997. Spontaneous occurrence of early region 1A reiteration mutants of type 5 adenovirus in persistently infected human T-lymphocytes. Virology 230:281–291 [DOI] [PubMed] [Google Scholar]
- 102. Tollefson AE, et al. 1996. The adenovirus death protein (E3-11.6K) is required at very late stages of infection for efficient cell lysis and release of adenovirus from infected cells. J. Virol. 70:2296–2306 [DOI] [PMC free article] [PubMed] [Google Scholar]
- 103. Tollefson AE, Scaria A, Saha SK, Wold WS. 1992. The 11,600-MW protein encoded by region E3 of adenovirus is expressed early but is greatly amplified at late stages of infection. J. Virol. 66:3633–3642 [DOI] [PMC free article] [PubMed] [Google Scholar]
- 104. Tollefson AE, et al. 2001. Inhibition of TRAIL-induced apoptosis and forced internalization of TRAIL receptor 1 by adenovirus proteins. J. Virol. 75:8875–8887 [DOI] [PMC free article] [PubMed] [Google Scholar]
- 105. Trinh HV, et al. 2012. Avidity binding of human adenovirus serotypes 3 and 7 to the membrane cofactor CD46 triggers infection. J. Virol. 86:1623–1637 [DOI] [PMC free article] [PubMed] [Google Scholar]
- 106. Trotman LC, Mosberger N, Fornerod M, Stidwill RP, Greber UF. 2001. Import of adenovirus DNA involves the nuclear pore complex receptor CAN/Nup214 and histone H1. Nat. Cell Biol. 3:1092–1100 [DOI] [PubMed] [Google Scholar]
- 107. van Oostrum J, Burnett RM. 1985. Molecular composition of the adenovirus type 2 virion. J. Virol. 56:439–448 [DOI] [PMC free article] [PubMed] [Google Scholar]
- 108. Wang H, et al. 2011. Desmoglein 2 is a receptor for adenovirus serotypes 3, 7, 11 and 14. Nat. Med. 17:96–104 [DOI] [PMC free article] [PubMed] [Google Scholar]
- 109. Warming S, Costantino N, Court DL, Jenkins NA, Copeland NG. 2005. Simple and highly efficient BAC recombineering using galK selection. Nucleic Acids Res. 33:e36 doi:10.1093/nar/gni035 [DOI] [PMC free article] [PubMed] [Google Scholar]
- 110. Weisblum Y, et al. 2011. Modeling of human cytomegalovirus maternal-fetal transmission in a novel decidual organ culture. J. Virol. 85:13204–13213 [DOI] [PMC free article] [PubMed] [Google Scholar]
- 111. Wennier S, Li S, McFadden G. 2011. Oncolytic virotherapy for pancreatic cancer. Exp. Rev. Mol. Med. 13:e18 doi:10.1017/S1462399411001876 [DOI] [PMC free article] [PubMed] [Google Scholar]
- 112. Wiethoff CM, Wodrich H, Gerace L, Nemerow GR. 2005. Adenovirus protein VI mediates membrane disruption following capsid disassembly. J. Virol. 79:1992–2000 [DOI] [PMC free article] [PubMed] [Google Scholar]
- 113. Wu W, et al. 2011. Decreased infectivity of a neutralization-resistant equine infectious anemia virus variant can be overcome by efficient cell-to-cell spread. J. Virol. 85:10421–10424 [DOI] [PMC free article] [PubMed] [Google Scholar]
- 114. Zhang J, Shakhnovich EI. 2009. Slowly replicating lytic viruses: pseudolysogenic persistence and within-host competition. Phys. Rev. Lett. 102:178103. [DOI] [PubMed] [Google Scholar]
- 115. Zorzenon dos Santos RM, Coutinho S. 2001. Dynamics of HIV infection: a cellular automata approach. Phys. Rev. Lett. 87:168102–168101_ 168102-168104 [DOI] [PubMed] [Google Scholar]
Associated Data
This section collects any data citations, data availability statements, or supplementary materials included in this article.