

Abstract
Leukocytes participate in the immune control of herpes simplex virus (HSV). Data from HIV coinfections, germ line mutations, and case reports suggest involvement of CD4 T cells and plasmacytoid dendritic cells (pDC). We investigated the relationships between these cells and recurrent genital herpes disease severity in the general population. Circulating CD4 T-cell responses to HSV-2 were measured in specimens from 67 immunocompetent individuals with measured genital lesion and HSV shedding rates. Similarly, pDC number and functional responses to HSV-2 were analyzed in 40 persons. CD4 responses and pDC concentrations and responses ranged as much as 100-fold between persons while displaying moderate within-person consistency over time. No correlations were observed between these immune response parameters and genital HSV-2 severity. Cytomegalovirus (CMV) coinfection was not correlated with differences in HSV-2-specific CD4 T-cell responses. The CD4 T-cell response to HSV-2 was much more polyfunctional than was the response to CMV. These data suggest that other immune cell subsets with alternate phenotypes or anatomical locations may be responsible for genital herpes control in chronically infected individuals.
INTRODUCTION
Most recurrent genital herpes infections are caused by herpes simplex virus type 2 (HSV-2). For example, a large multicenter U.S. study found that 95.8% of recurrent genital herpes was due to HSV-2 (50). The clinical and virologic severity of genital herpes simplex virus infection varies among otherwise healthy persons (57), from asymptomatic to frequent, painful recurrent genital ulcerations. Similarly, the frequency of viral shedding in the genital area is highly variable. For example, in a recent PCR-based shedding study, some immunocompetent persons had HSV detected in the genital area on greater than 90% of days, whereas 16.6% remained without detectable virus even after daily testing for many weeks (57). The determinants of severity are poorly understood but host immunity is generally felt to control recurrent HSV-2 infection in humans, as it worsens with iatrogenic or HIV-induced immune suppression (10). These conditions are associated with diverse immune dysfunction, so that it has been difficult to determine which responses within which arm of immunity best correlate with HSV-2 severity. Among HIV-infected persons, the frequency of peripheral blood HSV-2-specific CD8 but not CD4 T-cell responses were correlated with HSV-2 severity (42). Because innate and acquired human cellular immune deficiencies influence both CD8 and CD4 T cells to various extents, it has not been possible to discern the relative importance of CD8 versus CD4 T cells from studies of such individuals. Within the immunocompetent population, the roles that acquired and innate immunity, mobile and tissue-resident cells, and cell-intrinsic and cell-extrinsic factors play in the control of recurrent HSV-2 infection are currently unknown. Identification of such factors would facilitate vaccine design.
We investigated two aspects of the HSV-specific immune response for possible association with HSV-2 infection severity in immunocompetent persons. First we studied circulating CD4 T-cell gamma interferon (IFN-γ), interleukin-2 (IL-2) and tumor necrosis factor-α (TNF-α) responses to HSV-2 antigen. HSV-specific CD4 T cells are present in blood, lesion and posthealing skin, the uterine cervix, dorsal root ganglia and corneal tissues (6, 9, 31, 32, 59, 60, 68). These cells secrete antiviral cytokines and can kill HSV-infected cells (25, 65). Next we evaluated the role of innate immunity by measuring the function and frequency of plasmacytoid dendritic cells (pDC). These cells are present in HSV lesions and blood (14) and represent a key link between innate and acquired immune responses as they detect HSV using innate receptors and respond by secreting large amounts of IFN-α, TNF-α, and other cytokines (46, 49). pDC can also prime and recall HSV-specific CD8 T cells (14, 66). A series of genetic lesions and idiopathic conditions are associated with deficient responses to HSV and with severe primary HSV infections (45, 55). HIV coinfection is associated with low pDC numbers and poor pDC responses to HSV (1). Decreased circulating pDC numbers and HSV responsiveness were seen in rare persons with HSV-1 retinitis (27). Furthermore, pDC activation is amenable to pharmacologic manipulation by synthetic agonist compounds (37). Knowledge of the possible association between pDC and genital herpes severity could assist with the design of treatment for HSV infections.
We defined HSV-2 infection severity by prospectively following a cohort of participants for frequency of viral shedding and genital lesions. Two separate cohorts were studied for each aim, with fresh blood samples used for analysis of pDC. Because cytomegalovirus (CMV) drives a very high magnitude antigen-specific CD4 T-cell response and CMV has been associated with immune suppression, we also investigated the influence of CMV coinfection on the magnitude of these responses (12). The antigenic overlap between HSV-1 and HSV-2 led us to predict that HSV-1/HSV-2-coinfected persons might have higher CD4 T-cell responses to HSV-2 than persons infected only with HSV-2. The resultant data were analyzed to detect possible associations between these immune parameters and genital herpes severity.
MATERIALS AND METHODS
Participants and blood specimens.
Two separate cohorts of HSV-2-infected persons participated in studies of immune parameters and genital herpes severity at the Virology Research Clinic. Both groups were HIV uninfected and had known HSV-1 infection status. Genital herpes severity was established by history, subject diaries, and daily self-collection of anogenital swabs for detection of HSV DNA as published (57). Persons in the CD4 T-cell study had peripheral blood mononuclear cells (PBMC) cryopreserved from acid-citrate dextrose-anticoagulated blood. Participants in the pDC cohort donated heparin-anticoagulated blood that was processed within 6 h after phlebotomy. Participants in the CD4 T-cell and pDC studies did not have active genital lesions and were not receiving antiviral medications at the time of phlebotomy. For the pDC study, genital swabs for PCR detection of HSV were obtained on the day of phlebotomy (36) and data from samples taken when genital HSV DNA was detected were excluded. Most subjects in the pDC study contributed two or three independent blood specimens over a few-week period. The clinical and demographic characteristics of persons with HSV-2 infection undergoing intensive swab- and diary-based studies of HSV-2 severity at the Virology Research Clinic have been detailed in previous publications (5, 37, 57, 63). Persons with shedding data and current contact information were contacted without knowledge of their severity data and interested potential participants were serially screened and enrolled if qualified over a 12-month period.
An additional CD4 T-cell specimen set was obtained from persons who donated serial blood specimens after a documented HSV-2 genital recurrence. These individuals had blood obtained during the recurrence, at which time oral acyclovir was administered and then it was readministered periodically thereafter. Antiviral therapy during follow-up was individualized in this group. Genital herpes severity measures were not collected from the CD4 T-cell longitudinal cohort. Cryopreserved PBMC from one HSV-1/HSV-2 doubly seronegative person were used as replicate aliquots as a negative control for the CD4 T-cell studies. Persons who were HSV-1/HSV-2 doubly seronegative were randomly enrolled as controls for the pDC study. HSV-1 and HSV-2 infection status was determined by using the University of Washington immunoblot assay (3), and CMV serostatus by using a CMV IgG enzyme-linked immunosorbent assay (ELISA)-II (Wampole, Princeton, NJ). HIV-1 antibodies were absent according to a screening enzyme immunoassay (EIA) (HIV 1/2 Plus; Bio-Rad, Hercules, CA), and no subjects were receiving immune suppressive medications at the time of phlebotomy. Persons receiving systemic corticosteroids or with active malignancy or autoimmune disorders were excluded. The University of Washington institutional review board approved all protocols and all participants provided written informed consent.
Measurement of HSV-2 severity.
Subjects collected swabs of the anogenital area once per day that were transported to the lab in PCR buffer (24). Detection of HSV DNA was performed with a highly sensitive PCR assay that has been extensively documented (24, 36, 61). Shedding rate was calculated as the number of swabs with detectable HSV DNA divided by the total number of swabs collected (36). Similarly, lesion rate was calculated as the number of days with genital lesions noted in the diary divided by the number of days of observation.
Immune tests.
CD4 responses were measured by intracellular cytokine cytometry (ICC) as described previously (34), with slight modifications. PBMC were stimulated with UV-killed cell-associated HSV-2. This HSV-2 was prepared by lysing, via sonication, Vero cells showing 100% cytopathic effect by light microscopy (68). The HSV-2 antigen is used at an estimated multiplicity of infection of 1 PFU of HSV-2 per responder cell, calculated from the titer of the HSV-2 stock obtained prior to UV inactivation. Negative controls were a similar dilution of an uninfected Vero cell sonicated lysate otherwise prepared identically to the viral antigen preparation and media. UV treatment was done to increase biological safety. Each stimulus was done in duplicate or triplicate using T-cell medium (TCM) (30) for 20 h and included anti-CD28 and anti-CD49d monoclonal antibody (MAb) (BD Biosciences, San Jose, CA). Brefeldin A (Sigma, St. Louis, MO) was included for the terminal 16 h. Cells were split and stained with CD3 PerCP-Cy5.5, CD4 allophycocyanin (APC)-H7, CD8α-fluorescein isothiocyanate (FITC), IL-2 phycoerythrin (PE), IFN-γ PE-Cy7, and TNF-α APC (BD). In control tubes the same cocktail included isotype control MAb labeled with each of the cytokine fluorochromes. Nonviable cells were degated with Live/Dead violet stain (Invitrogen, Carlsbad, CA). Compensation used cell populations with single bright populations on each channel. Gating analyzed single, live CD3+ CD8− CD4+ cells on a Canto II (BD) using Flowjo (Treestar, Ashland, OR). The net endpoint for HSV-2-specific CD4 T cells for each subject, calculated for each cytokine or combination, was calculated with two correction steps for negative controls. The positive-negative fluorescence intensity cutoff for each cytokine was held constant for both corrections. In the first step, the mean percentage of live CD3+ CD8− CD4+ lymphocyte-gate cells responsive to HSV-2 and stained with isotype control antibodies was subtracted from the percentage of these cells stimulated with HSV-2 and staining positive with anticytokine antibodies. In the second step, the mean percentage of cytokine-positive cells for cells stimulated with Vero control lysate and stained with anticytokine antibodies was then subtracted to yield the final values. Human CMV lysate (Advanced Biotechnologies, Columbia, MD) at 1:1,000 and Staphylococcus aureus enterotoxin B (SEB) (Sigma) were additional test stimuli. Endpoints were calculated similarly using media stimulation and anticytokine antibodies as a single negative control. Specimen sets from persons with data for multiple time points were run simultaneously. PBMC from an HSV-1/HSV-2-seronegative control were included in every run.
For absolute pDC counts, 100 μl whole blood was incubated in Trucount bead tubes (BD) with 100 μl fluorescence-activated cell sorter (FACS) buffer containing anti-BDCA2-APC, anti-BDCA4-PE, and anti-CD123-FITC (1:40 final dilution each) (Miltenyi, Auburn, CA). The samples were incubated for 30 min at room temperature, protected from light. Subsequently, 900 μl FACS lysing buffer (BD) was added and samples were similarly incubated. The number of beads detected was used to calculate the absolute number of cells/μl positive for combinations of surface markers. Analysis was gated on single cells in the lymphocyte region (Flowjo). Cells staining doubly positive for any combination of two pDC markers were considered to be pDC. The number of pDC per microliter of blood was calculated using the percentage recovery of beads (22).
pDC reactivity tests used 1 × 10⁶ PBMC immediately after Ficoll enrichment in 96-well U-bottom plates in 200 μl of RPMI 1640 with 10% fetal bovine serum (FBS), 15 mM HEPES, 1:100 nonessential amino acids, 2 mM l-glutamine, and penicillin, streptomycin, and gentamicin (Invitrogen). Positive control stimuli were CL097 [Toll-like receptor (TLR)7/8 agonist] at 2.5 μg/ml, type A CpG ODN2216 (TLR9 agonist) at 5 and 50 μg/ml, Pam3CSK4 (TLR1/2 agonist) at 1 μg/ml, high-molecular-weight poly(I · C) (TLR3 agonist) at 10 μg/ml; negative-control stimuli were media and ODN2216 type A negative control HODNAC-1 at 5 μg/ml (all Invivogen, San Diego, CA). HSV-2 strain 186 was grown in Vero cells (29) that were Mycoplasma-free (Lonza, Allendale, NJ). The titer of viral stocks was determined by plaque assay in Vero cells, and the virus was used at estimated multiplicities of infection of 100, 10, or 1. Live virus was used in accordance with previous reports (1). All stimulations included 2.5 μg/ml brefeldin A (Sigma) for the last 4 of 5 total hours at 37°C, in 5% CO2. Cells were collected by centrifugation and surface stained with 2.5 μl antilineage 1-FITC, 5 μl anti-HLA DR-PerCP (both BD), 4.2 μl anti-CD123-APC (Miltenyi), and 4.2 μl anti-CD11c-PE-Cy7 (eBioscience, San Diego, CA) in a total volume of 100 μl FACS buffer [phosphate-buffered saline (PBS), 0.1% bovine serum albumin (BSA), 0.1% NaN3]. After 30 min on ice, cells were washed twice with FACS buffer, treated with 100 μl of Cytofix/Cytoperm overnight at 4°C, washed twice in PermWash (both BD), and stained with 100 μl FACS PermWash containing 0.5 μl anti-IFN-α-PE (Chromaprobe, Maryland Heights, MO) and 0.125 μl anti-TNF-α-Pacific Blue (Biolegend, San Diego, CA). Analyses included single-color compensation tubes on each active channel with appropriately fluorochrome-coupled MAb specific for CD8α (FITC and PE from Caltag/Life Technologies, Grand Island, NY; PerCP from BD; Pacific Blue from Biolegend), CD4 (PE-Cy7, Biolegend), or CD3 (APC, Caltag). pDC were defined as the subset of singlicate cells that were first gated as CD123high and CD11cneg and then as HLA-DRpos and lineageneg.
Statistical analysis.
Pearson correlations were used to examine the relationships between cytokine expression and severity outcomes, and between expression levels from different cell types. With a sample size of 60, we estimated 63% power to detect correlations of 0.3 or higher, 86% power to detect correlations of 0.4 or higher and 97% power to detect correlations of 0.5 or higher. Because not all samples were collected at the same time as the swabs for HSV, we used linear regression to assess whether the time interval to collection of samples for PBMC might confound the relationship between cytokine response and severity outcomes. The Wilcoxon rank-sum test was used for comparisons between groups such as those subjects with differing CMV status, and the Wilcoxon signed-rank test was used for paired comparisons within persons. Log transformations were used prior to testing for noncentrally distributed measures, including the percentage of CD4 T cells expressing cytokines. Two-sided P values equal to or less than 0.05 were considered significant. Associations between clinical outcomes and pDC number and function were tested using linear regression for correlated measures, also called generalized estimating equations (GEE). These methods account for the association between repeated sampling performed on the same individuals over time (13). Data from repeated blood samples from the same subjects were analyzed using variance components analysis (40). Analysis was performed in SAS 9.3 (Cary, NC).
RESULTS
Correlation of CD4 T-cell responses with genital herpes severity.
Among 67 HSV-2-seropositive participants enrolled in the cross-sectional CD4 T-cell study, 36 (54%) were women and most (87%) were Caucasian. HSV-1 coinfection was present in 30 (45%) of the participants (Table 1). The median interval between collection of severity data and PBMC was 0.8 years (range, −2.0 to 13.6 years).
Table 1.
Participants with HSV-2 infection studied in this report
| Participant characteristic | Value for: |
|
|---|---|---|
| CD4 study (n = 67) | pDC study (n = 40) | |
| White race [n (%)] | 58 (87) | 36 (90) |
| Men [n (%)] | 31 (46) | 23 (58) |
| HSV-1/HSV-2 seropositive [n (%)] | 30 (45) | 20 (50) |
| CMV seropositive [n (%)] | 17/26 (65) | UNKa |
| Age at shedding session (yr) [(median (range)] | 43 (20 to 70) | 43 (23 to 62) |
| History of symptoms [n (%)] | 52 (78) | 32 (80) |
| Yr since acquired [median (range)] | 12.7 (0.1 to 37.8) | 10.6 (0.2 to 34.2) |
| Yr between shedding session and blood draw [median (range)] | 0.8 (−2.0 to 13.6) | 9.0 (0.3 to 20.3) |
| Overall shedding rate [positive swabs/swabs collected (%)] | 664/4,070 (16) | 438/2,326 (19) |
| Overall lesion rate [lesional days/days with diary (%)] | 486/4,396 (11) | 331/2,630 (13) |
UNK, unknown.
The ICC assay performance characteristics were consistent with accurate detection of antigen-specific CD4 T-cell responses (for results for a representative subject, see Fig. 1A and B) with very low background reactivity to negative-control antigens. Every participant had absolute mean percentages of CD4 T lymphocytes responsive to mock Vero antigen and to media of less than 0.2%. The HSV-seronegative control participant had net CD4 T-cell responses to HSV-2 of <0.05% for each cytokine or combination in each of 8 assay runs. All specimens were reactive with SEB. The median percentage of CD4 T cells expressing any cytokine or combination of cytokines in response to SEB was 18.74% (range, 2.18% to 34.96%).
Fig 1.

Representative flow cytometry data. (A) Gating scheme for CD4 T-cell intracellular cytokine cytometry. FSC-A, forward scatter A; SS, side scatter. Black polygons indicate gated cell subsets. (B) Responses of PBMC from an HSV-2-seropositive individual. At left, cells were stimulated with UV-HSV-2 and stained with isotype control MAb. The remaining panels show cells treated with the indicated stimuli and stained with the anticytokine MAb. The numbers are the percentages of gated CD4 T cells in the respective quadrants. (C) pDC enumeration analysis for a representative subject. Black polygons in the left 2 dotplots show cell gating. The right 3 dotplots show the percentages of gated cells positive for the indicated markers enclosed in the small polygons. (D) Gating scheme for DC ICC analyses. The third dotplot shows boxed CD123high CD11cneg cells. The fourth dotplot shows the final pDC gate of HLA-DRpos lineageneg cells. (E) Responses of gated pDC to media, live HSV-2 at MOI 100, and TLR agonists or controls. Numbers in quadrants are percentages of gated cells expressing the indicated patterns of cytokines.
HSV-2-seropositive persons had discrete CD4 T-cell cytokine responses to whole HSV-2 antigen. We noticed a considerable dynamic range for each cytokine. The median abundance of HSV-2-specific CD4 T cells expressing IFN-γ in PBMC was 0.31% and ranged from 0.04% to 3.77%. Nine of the 67 subjects (13%) had greater than 1% response levels, and 11 (16%) had IFN-γ responses of <0.1%. The net IL-2 and TNF-α responses were similarly broad, ranging from 0.05% to 3.39% and from 0.04% to 4.66%, respectively.
The proportions of CD4 T lymphocytes expressing IFN-γ did not correlate with the genital HSV shedding rate or lesion rate (Fig. 2). No statistically significant correlation was found between any pattern of single, double, or triple cytokine expression for IFN-γ, IL-2, and TNF-α by circulating HSV-2-specific CD4 T cells and shedding rates or lesion rates (Table 2). Using interaction terms in linear regression, the time between PBMC collection and the measurement of genital herpes severity did not influence the relationship between severity measures and ICC results (P > 0.2 in all analyses).
Fig 2.

Scatter plots of all subjects' genital herpes shedding (A) and lesion (B) rates versus the net percentages of circulating CD4 T cells expressing IFN-γ after in vitro challenge with UV-killed whole-cell-associated HSV-2.
Table 2.
Correlations between HSV shedding or genital lesion rates and net cytokine expression by circulating, live, CD3+ CD8− CD4 T cells in response to UV-inactivated HSV-2 antigen
| IFN-γ, IL-2, and TNF-α expression by ICC | Median % of cells (range) | Pearson correlation coefficient (sig)a |
|
|---|---|---|---|
| HSV shedding | Genital lesions | ||
| Any cytokine expressed | 0.56 (0.08–4.73) | −0.14 (0.27) | −0.19 (0.13) |
| Any IFN-γ | 0.33 (0.04–3.77) | −0.11 (0.38) | −0.17 (0.17) |
| Any IL-2 | 0.30 (0.05–3.39) | −0.10 (0.40) | −0.14 (0.27) |
| Any TNF-α | 0.50 (0.04–4.66) | −0.16 (0.19) | −0.18 (0.15) |
| Single cytokine expressed | |||
| Only IFN-γ | 0.04 (0.00–0.38) | 0.10 (0.45) | −0.11 (0.40) |
| Only IL-2 | 0.01 (0.00–0.07) | −0.23 (0.33) | 0.01 (0.98) |
| Only TNF-α | 0.07 (0.00–1.24) | −0.19 (0.14) | −0.17 (0.20) |
| Two cytokines expressed | |||
| IFN-γ and IL-2 | 0.02 (0.00– 0.24) | 0.16 (0.20) | −0.08 (0.54) |
| IFN-γ and TNF-α | 0.09 (0.01– 0.78) | −0.14 (0.27) | −0.18 (0.14) |
| IL-2 and TNF-α | 0.07 (0.01– 0.38) | −0.07 (0.56) | −0.05 (0.71) |
| All three expressed | 0.17 (0.01– 2.98) | −0.14 (0.27) | −0.15 (0.25) |
sig, P value for test of null hypothesis that correlation equals 0.
HSV-2-specific CD4 T-cell responses and viral coinfection.
Because HSV-1-specific CD4 T cells can cross-react with HSV-2 (30) and HSV-1 infection may give protection against HSV-2 infection or disease (10), we assessed the relationship between HSV-1 coinfection and the magnitude of the HSV-2-reactive CD4 T-cell population. There was a trend (P = 0.073) for persons infected with both HSV-1 and HSV-2 to have a lower proportion of total circulating HSV-2-reactive CD4 T cells. The median abundance for coinfected persons (n = 30) was 0.37% (range, 0.09% to 1.44%) while the median abundance for persons seropositive for HSV-2 only (n = 37) was 0.68% (range, 0.08% to 4.73%).
CMV infection status was measured in 25 of the 67 participants (37%) and 16 (59%) were positive for CMV infection. Overall, CD4 T-cell responses to CMV were higher than responses to HSV-2. The mean ± standard deviation for the abundance of CD4 T cells with any pattern of response to CMV among the CMV-seropositive participants was 2.95% ± 3.16% (range, 0.21% to 11.78%). CMV-seronegative persons (n = 9) had a mean ± standard deviation of 0.06% ± 0.02% (range, 0.03% to 0.10%) of CD4 T cells with any reactive cytokine pattern in response to CMV (P < 0.001 for difference between CMV seropositive and CMV seronegative). These CMV-specific CD4 T-cell responses had no overlap between the CMV-seropositive and CMV-seronegative persons. This allowed us to set a response cutoff of 0.15% of CD4 T cells reactive with CMV and use this to impute the CMV infection status of the remaining 42 participants. An additional 30 persons were categorized as CMV infected and an additional 12 persons were classified as CMV uninfected on the basis of their CD4 T-cell tests.
We found no association between the presence or absence of CMV infection and the percentage of HSV-2-specific CD4 T cells with any cytokine response pattern, either among the 25 subjects with known CMV serostatus (P = 0.33) or among the overall group of 67 participants, after imputing CMV serostatus as described above (P = 0.44). Among persons coinfected with HSV-2 and CMV (n = 46), the overall magnitude of the CD4 T-cell response was significantly larger for CMV than for HSV-2 (Fig. 3A, most points above the x = y diagonal line) (P < 0.001). CD4 T-cell responses to HSV-2 were not lower in persons with large responses to CMV. To the contrary, there was a weak direct correlation between the magnitude of CMV and HSV-2 CD4 T-cell responses (ρ = 0.29, P = 0.049) such that persons with larger responses to CMV tended to have larger responses to HSV-2.
Fig 3.
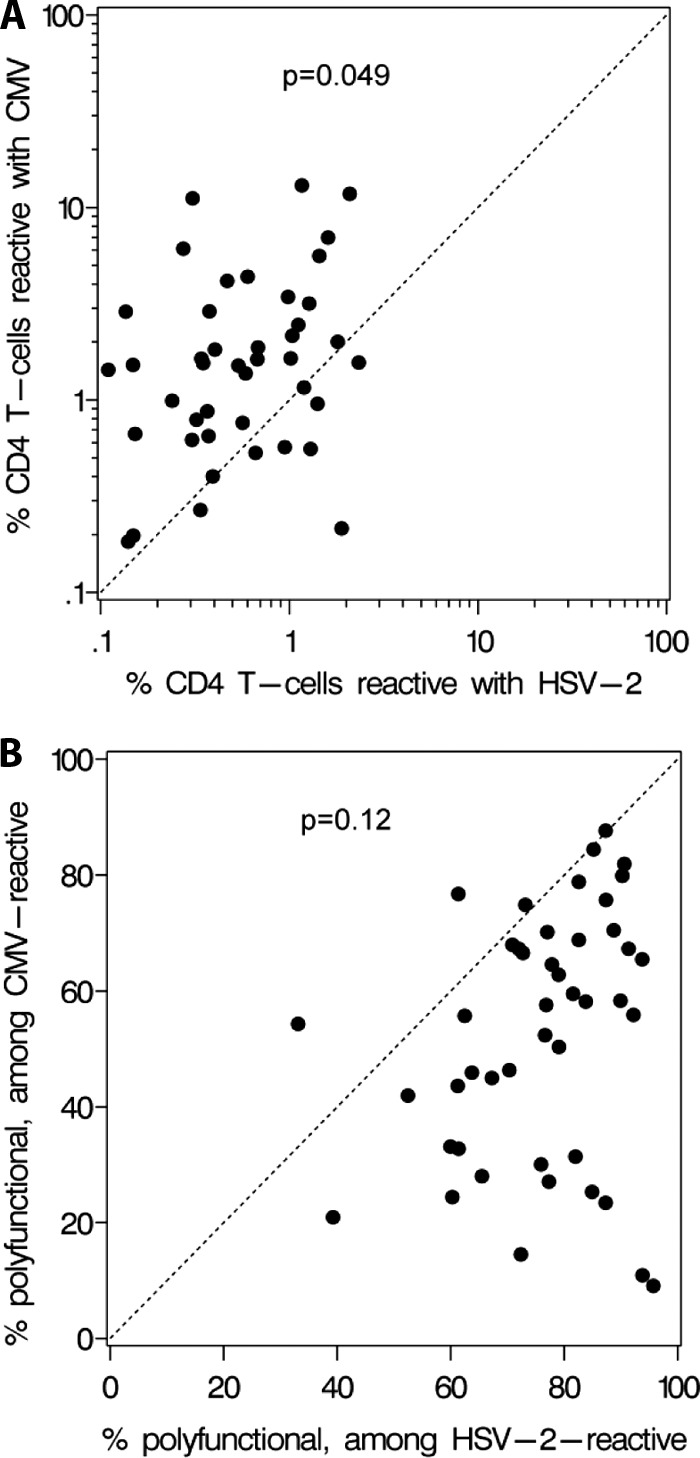
Relationships between CMV-specific and HSV-2-specific CD4 T cells in coinfected persons. P values for Pearson correlations are indicated. (A) Proportions of circulating CD4 T cells responsive with HSV-2 (x axis) and CMV (y axis) in 46 coinfected persons. (B) The proportions of CMV-specific CD4 T cells that express two or three cytokines are indicated on the y axis. The x axis shows the proportion of HSV-2-specific CD4 T cells with polyfunctionality.
Significant differences in CD4 T-cell polyfunctionality were observed between CMV- and HSV-2-specific CD4 T cells. Results for a representative subject (Fig. 1B) show that HSV-2-specific CD4 T cells were likely to have multiple cytokine responses. In contrast, CMV-reactive CD4 T cells were often monofunctional for IFN-γ. Among reactive cells, the median percentage that were polyfunctional, expressing at least two cytokines from among the three measured, was 77.2% (range, 33.1% to 95.7%) for HSV-2 but was only 55.8% (range, 9.1% to 87.7%) for CMV (P < 0.0001) (Fig. 3B, most points below the x = y diagonal line). There was no significant correlation between the proportions of polyfunctional CD4 T cells for the two viruses (ρ = 0.24, P = 0.12).
Stability of CD4 T-cell responses over time.
To further investigate whether CD4 T-cell responses to HSV-2 remain stable over time, we examined PBMC specimens (n = 39) collected longitudinally from five additional subjects during symptomatic genital HSV recurrences (9 specimens) and several weeks to months afterwards (30 specimens). In this substudy participants took oral acyclovir when lesions were present. The percentage of CD4 T cells expressing IFN-γ in response to HSV-2 fluctuated during and shortly after recurrent HSV-2 lesions but then showed relative stability (Fig. 4). Findings were similar for the other patterns of single, double, and triple cytokine responses (not shown). Variance components analysis indicated that 77% of the variability in the percentage of CD4 T cells with any pattern of positive cytokine response to HSV-2, after conversion to a log10 value, was due to interindividual variability (40). The proportion of variability attributable to participant identity increased to 97% when we excluded samples obtained within the first 2 weeks of genital herpes recurrence.
Fig 4.
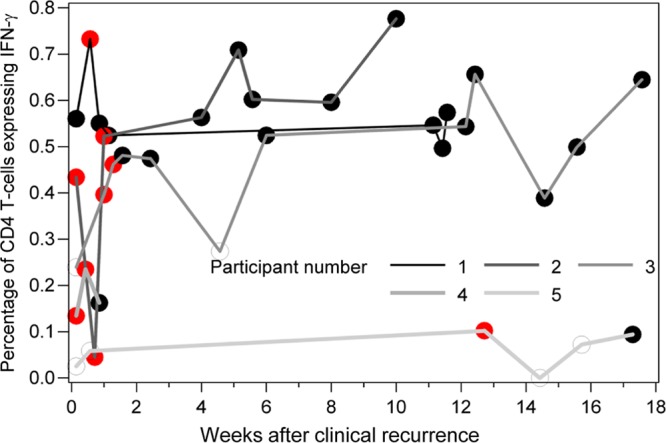
Intracellular cytokine cytometry results for circulating CD4 T-cell expression of IFN-γ for specimens collected during and after symptomatic genital HSV recurrences in five subjects. Peripheral blood mononuclear cells (PBMC) were collected between 3 and 13 times per participant over a course of 5 to 122 days. Results are expressed as percentage of circulating live CD3+ CD8− CD4+ T cells expressing IFN-γ. PBMC were collected and frozen, and then all samples for each participant were run on the same day. Red data points are times at which HSV-2 was detected by PCR from genital specimens.
Correlation between pDC number and HSV-2 severity.
pDC concentrations per volume of blood were measured in 40 HSV-2-infected persons and 8 HSV-uninfected individuals. Each method of counting pDC, using the number of cells positive for two of the three pDC markers, gave almost identical pDC counts for each specimen (for representative data, see Fig. 1C). These three raw counts were averaged to give the final count per specimen. Among the 40 HSV-2-infected participants with samples obtained when not shedding, most contributed two specimens, and 74 samples were assessed. The 8 HSV-1/HSV-2-seronegative control individuals contributed 13 samples. There was a 32-fold range of pDC concentrations in blood, from 1.4 to 45.2 cells/μl (median 11.0 cells/μl), among the 40 HSV-2-infected persons. Within this range, within-person pDC numbers appeared stable over time in most individuals (Fig. 5A). We found that 67% of the variability in pDC concentration in the blood was attributable to interparticipant differences.
Fig 5.
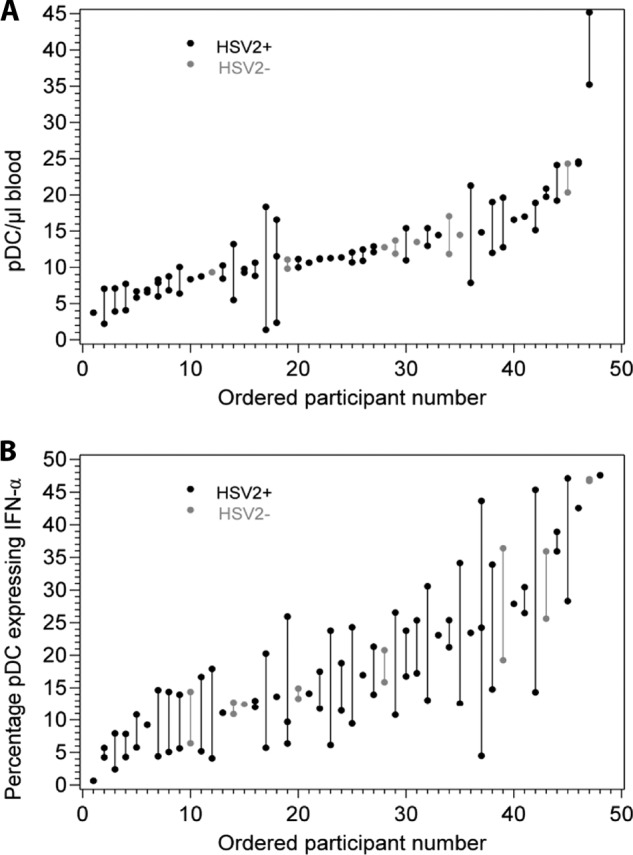
(A) Range and stability of pDC concentrations expressed as cells/μl of blood within individuals over a period of repeated sampling. Lines connect results from the same individuals. The x axis is ordered by mean cell concentration measured over 1 to 3 visits per person among 40 HSV-2-infected and 8 HSV-seronegative subjects. HSV-seronegative subjects are shown in gray. (B) Range and stability of pDC reactivity to live HSV-2 expressed as the percentage of cells expressing IFN-α in response to HSV-2 at MOI 100. Lines connect results from the same individuals. The x axis is ordered similarly to that described for panel A. HSV-seronegative subjects are shown in gray.
pDC number was not associated with genital herpes lesion rates (P = 0.36) or shedding rates (P = 0.31) (Fig. 6A, top). There was no association of pDC concentration per μl of blood with gender. To examine the possible relationship between pDC numbers and innate resistance to HSV acquisition, we compared the average pDC numbers between the 40 HSV-2-infected and 8 HSV-uninfected persons and found no difference (median count, 11.0; mean, 12.4; standard deviation, 7.3) versus 13.1 (mean, 14.2; standard deviation, 4.4) cells/μl, respectively, P = 0.09).
Fig 6.

(A) Mean pDC number and function and genital herpes severity among HSV-2-infected persons. Each data point represents the average pDC data value for one person for 1 to 3 visits. The relationships between pDC number per microliter of blood and genital HSV shedding and between pDC number and genital lesion rate are shown in the upper panels. The relationships between the percentage of circulating pDC accumulating intracellular IFN-α in response to live HSV-2 at MOI 100 and genital HSV shedding and between pDC IFN-α reactivity and genital lesion rate are shown in the lower panels. (B) pDC IFN-α reactivity to HSV-2 correlates with reactivity to a synthetic TLR 9 agonist (left) but not as strongly with a synthetic agonist of TLR7 and TLR8 (right). Each data point represents the average pDC values for one person for 1 to 3 visits. HSV-2-uninfected and -infected individuals are included.
Correlation between pDC function and genital herpes severity.
Next, we examined the possible correlation between pDC functional responses and recurrent genital herpes severity in immunocompetent persons. The pDC were stimulated shortly after phlebotomy and separation from plasma. A distinct population of pDC were readily identifiable (Fig. 1D). Human pDC are known to express TLR7, TLR8, and TLR9 but not TLR2 or TLR3. The reactivity of the gated pDC was consistent with accurate identification. Most subjects had brisk responses for both IFN-α and TNF-α in response to the positive-control TLR7/TLR8 agonist CL0907 and to the TLR9 agonist CpG DNA (for representative data, see Fig. 1E) but only weak responses to the CpG negative control and no response to the TLR1,2 heterodimer agonist PAM3CSK4 or to the TLR3 agonist poly(I · C).
There was a considerable dynamic range in the pDC cytokine response to live HSV-2. The median percentage of pDC expressing IFN-α in response to live HSV-2 at a multiplicity of infection (MOI) of 100 was 14.7 (range, 0.7 to 47.6). Responses to lower doses of HSV-2 were markedly lower. Within-subject stability over time was again observed (Fig. 5B). We found that 38% of the variability in pDC IFN-α responses to HSV-2 at MOI 100 was attributable to participant differences. Similar stability was also detected for responses to the TLR7/TLR8 and TLR9 agonists (not shown).
We found no association between HSV shedding or lesion rate with the expression of the cytokines IFN-α and TNF-α (alone or in combination) in response to HSV-2 (Fig. 6A, lower row; Table 3). Similarly, there was no correlation between either measure of HSV severity and any pattern of cytokine response after stimulation with any of the TLR positive-control agonists (not shown). We compared pDC reactivities to HSV-2 or control stimuli between the HSV-2-infected (n = 40) and HSV-uninfected (n = 8) persons and found no difference in IFN-α production (P = 0.22). Because of the unexpected dynamic range in pDC reactivity to HSV-2, we analyzed whether pDC cytokine responses to HSV-2 were correlated within individuals with responses to TLR9 and TLR7/TLR8 synthetic agonists. In preliminary dose-response experiments, responses to CpG were equivalent at 50 μg/ml and 100 μg/ml while responses to CpG DNA at 5 μg/ml were generally quite low, such that the plateau dose of 50 μg/ml was used throughout. The percentage of circulating pDC expressing IFN-α in response to HSV-2 at MOI 100 was strongly associated with responses to CpG DNA at 50 μg/ml (Fig. 6B, left; ρ = 0.52, P = 0.0002) and somewhat associated with responses to CL097 (Fig. 6B, right; ρ = 0.29, P = 0.044). Similar trends were observed for TNF-α stimulation such that the percentage of pDC expressing TNF-α in response to HSV-2 at MOI 100 was better correlated with TNF-α responses to CpG DNA at 50 μg/ml (ρ = 0.50, P = 0.0003) than to CL097 (ρ = 0.21, P = 0.16).
Table 3.
Expression of cytokines in pDC exposed to HSV-2 at MOI 100
| Cytokine(s) | Median (range) % of cells expressing the cytokine | Change in % of cells expressing cytokine (95% confidence interval) per 10% increase ina |
|
|---|---|---|---|
| Shedding rate | Lesion | ||
| IFN-α only | 0.3 (0.0 to 3.3) | −0.07 (−0.16 to 0.02) (0.11) | −0.05 (−0.16 to 0.05) (0.35) |
| IFN-α and TNF-α | 14.1 (0.7 to 47.4) | −0.02 (−1.94 to 1.90) (0.98) | −1.07 (−2.92 to 0.78) (0.26) |
| TNF-α only | 49.6 (16.8 to 71.8) | −0.16 (−2.64 to 2.33) (0.90) | 0.91 (−1.86 to 3.67) (0.52) |
| Any IFN-α | 14.7 (0.7 to 47.6) | −0.09 (−2.04 to 1.84) (0.92) | −1.12 (−3.01 to 0.76) (0.24) |
| Any TNF-α | 66.1 (20.8 to 89.5) | −0.08 (−3.85 to 3.69) (0.97) | −0.24 (−3.86 to 3.37) (0.90) |
sig, P value for test of null hypothesis that correlation equals 0.
DISCUSSION
In this study, we sought to identify immune correlates of genital herpes severity, defined both clinically and virologically. However, no association between expression of IFN-γ, IL-2 or TNF-α by HSV-2-stimulated circulating CD4 T cells and genital HSV shedding or lesion rates was noted. We also did not observe any correlation between either the number or function of pDC in the blood and genital herpes severity. Other immune cell subsets or functions, cell populations resident at sites of HSV-2 reactivation or latency, or other host or viral factors may be more closely related to the spectrum of recurrent genital severity in the general population. To our knowledge, the only prior report of an immune correlate of genital herpes severity was that circulating HSV-2-specific CD8 T cells were found to have an inverse relationship correlate with genital herpes severity in a cross-sectional study of HIV-coinfected persons (42). More recently, tissue resident-memory HSV-specific CD8 T cells have been convincingly demonstrated using in situ analyses in both animal models and human genital HSV-2 specimens (16, 69). The ability of HSV-specific CD4 memory T cells to persist at sites of infection may differ between species, with human studies also indicating that these T cells can have prolonged residence in healed skin and could participate in modulating HSV recurrences (17, 68). Inclusion of CD8 T-cell and local T-cell measures in future studies is a technically challenging but compelling goal for future research on the correlation of immunity and HSV severity.
Previous studies of PBMC from HSV-infected persons focused mostly on orolabial herpes and suggested a correlation between higher IFN secretion and increased time to next HSV recurrence (11, 44). Similar work with PBMC from patients with symptomatic orolabial HSV infection suggested that lower levels of CD4 T-cell-secreted IFN-γ were associated with more frequent recurrences (19, 38). Spruance et al. found that secretion of IFN-γ and IL-2 by cultured PBMC, in a format emphasizing CD4 T cells, tended to be lower in symptomatic than in asymptomatic HSV-1-infected persons (52). Chentoufi et al. observed an association between fine antigenic specificity of circulating HSV-1-specific CD4 T cells and participant-reported orolabial HSV severity (8). In contrast, in the setting of genital herpes we did not observe a correlation between circulating CD4 T-cell responses to HSV-2, as measured by cytokine-based enumeration, and HSV severity. This agrees with a previous investigation of HSV-2/HIV-1-coinfected persons in whom anogenital HSV-2 clinical severity did not correlate with HSV-2-specific CD4 T-cell responses (42).
An important implication of our findings is that immune manipulations that simply increase the total number of Th1-like circulating CD4 T cells without also inducing other effector cells or cells at sites of infection are unlikely to have a significant impact on genital herpes severity or on the intensity of HSV shedding. CD4 T cells alone do not seem to be biologically active in the setting of preventative vaccination for HSV-2. In a recent phase III study of a subunit HSV-2 vaccine, CD4 T-cell responses analyzed for the cytokines investigated in this study and also for CD40L did not correlate with vaccine efficacy in a case-control analysis (4). Interestingly, the vaccine may have protected against HSV-1 acquisition, and the subunit antigen used was very sequence-similar between HSV-1 and HSV-2. At the level of individual CD4 T-cell epitopes, a quite clear distinction can be drawn between epitopes recognized by HSV-2 only or both HSV-2 and HSV-1 (30). Because of this difference in protection afforded by an antibody and CD4-targeted vaccine, it is possible that studies of acquired CD4 responses and HSV-1 severity could reveal associations not noted in the current work. Vaccine formats that can induce strong antigen-specific CD8 T-cell responses to HSV-2 have already been tested in humans (62). It may be important to combine these types of approaches with methods to optimize the homing of these effector cells to sites of HSV exposure and recurrence.
Our data on viral coinfections revealed two surprising findings. First, HSV-1 coinfection was not associated with an increase in CD4 T-cell responses to HSV-2. As our recent comprehensive discovery effort for HSV-1 T-cell epitopes showed that about 50% are sequence-identical with HSV-2 (25), we expected that total HSV-2 CD4 responses might be higher in coinfected persons if the intensity of local antigenic exposures led to increased systemic T-cell levels. We actually observed a trend toward lower HSV-2-specific CD4 T-cell levels in persons coinfected with HSV-1 and HSV-2 that did not reach statistical significance. HSV-2 infection, typically acquired later in life than HSV-1, does not seem to add an increment to cross-reactive T-cell responses. Our data are in agreement with the findings of Schmid et al. (47), who used a PBMC enzyme-linked immunosorbent spot assay (ELISPOT) and observed the same inverse trend of lower responses to HSV-2 in HSV-1-coinfected persons.
The second surprising finding was the direct correlation between the magnitudes of the HSV-2 and CMV-specific CD4 T-cell immune responses among CMV- and HSV-2-coinfected persons. We did confirm the observations of others that CMV infection can lead to large accumulations of CMV-specific CD4 T cells (54) and found that CMV-specific CD4 T-cell responses were usually but not invariably larger than the corresponding HSV-2-specific responses. The magnitude of integrated CD4 responses to HSV-2 detected in the present study is also generally similar to that noted by two independent labs (2, 21). We initially hypothesized that the magnitude of the HSV-2-specific CD4 T-cell response would be lower in persons coinfected with CMV and HSV-2 than in those not infected with CMV, but in fact our findings were the opposite. The possible immune suppressive effects of CMV (26, 43, 58), including its association, if any, with the severity of HSV infections, require additional study. These effects have been most prominently investigated in the setting of human aging (28), and our study population contained few people in their seventh decade of life or older. The predilection for HSV-2-specific CD4 responses to be more polyfunctional than CMV-specific CD4 T-cell responses has been previously noted, albeit without within-subject pairwise analyses (20). Based on our finding that HSV-2-specific CD4 T cells are mostly polyfunctional, we predict that relatively few will be CD57+ effector-memory cells expressing lytic molecules as are seen for CMV (7), but further research into the phenotype of HSV-2-specific CD4 T cells is required.
Of note, despite the collection of PBMC for CD4 T-cell tests at various time intervals from the collection of genital herpes severity data, our results correlating CD4 responses and genital herpes severity remained robust and did not change after we adjusted for this time interval. Longitudinal CD4 T-cell studies in HSV-2-infected subjects showed that the variable acute changes associated with a clinical recurrence were followed by relative stability. The fact that our specimens for CD4 T-cell analyses were collected during these stable periods argues against a strong influence by time gaps between the collection blood for CD4 T-cell measures and the collection of virologic severity data. Higher-temporal-resolution studies surrounding genital herpes recurrences will be required to determine if recurrences lead to predictable acute fluctuations in circulating CD4 T cells.
pDC were defined by Siegal et al. (49) as the natural interferon-producing cells in PBMC responding to HSV (15). Several genetic defects in TLRs and their signaling pathways are associated with both severe primary HSV-1 infection and deficient responses to HSV and synthetic TLR agonists (41, 45, 67). The precise viral and host molecules involved in HSV detection by pDC are still controversial. Our data are consistent with the sensing of HSV-2 by TLR9, although it is also possible that an underlying variable in the pDC activation threshold could influence reactivity to both HSV-2 and synthetic TLR9 agonists. Animal data indicate that TLR9 can sense HSV and modulate HSV pathogenesis (35, 51). Thus far, the one study of human TLR9 genetic variants and genital HSV severity did not detect any relationship (5). Persons with defects in molecules downstream of TLR7, TLR8, and TLR9 do not exhibit a phenotype of severe HSV infections (39). A recent study (64) correlated TLR3 genotypes and circulating NK-cell responses to TLR3 agonists with HSV-1 severity, indicating that these cells should be included in future work. While we did detect a considerable dynamic range in both circulating pDC number and reactivity to HSV-2, we did not observe any correlation of these pDC measures with either genital herpes lesion severity or viral shedding. This does not rule out a local role for pDC in recurrent genital herpes or the possibility that these mobile cells could shift in or out of the blood or tissues during or after recurrences. Future studies, requiring timely processing of fresh blood on multiple days, will be required to determine if pDC number or function shift is dynamically related to symptomatic recurrent HSV-2.
We chose to study pDC reactivity to HSV-2 for 5 h, based on literature reports (1, 23) and the fact that pDC are labile and start to die upon prolonged culture. It is possible that use of other durations of incubation would lead to contrasting results. pDC can display dynamic differences in maturation status (48) and studies of maturation markers would also be of interest. As the molecular and structural details of pDC triggering by HSV are not completely understood, it is possible that HSV-1 and HSV-2 differ in this regard and that studies of HSV-1 severity and pDC biology would reveal associations that we did not observe in this study for HSV-2. The causes and consequences of the relatively stable interindividual differences in pDC number and function between persons remain undefined. pDC do express chemokine receptors suitable for homing to sites of inflammation and infiltrate the skin in HSV-2 lesions (14) and autoimmune conditions (56). It is not known if pDC are retained at mucosal sites after HSV clearance.
A strength of our study is that it included prospective, objective ascertainment of disease severity as defined by both clinical and virologic outcomes that provide precise data with which to explore the relationship between cellular immunity and the natural history of genital herpes infection. In addition, in our investigation we enumerated antigen-specific CD4 T cells and studied three cytokines. Prior studies used self-reported recurrence frequency for severity, did not enumerate the number of antigen-reactive cells, and focused on IFN-γ alone. Our study focused on anogenital rather than orolabial herpes. It is possible that the immune parameters controlling HSV-1 and HSV-2 infection differ. Because most recurrent orolabial herpes is due to HSV-1 infection and most recurrent genital herpes is caused by HSV-2 (10), the conclusions of previous studies focusing on orolabial herpes and HSV-1 (8, 19, 38, 53) may not apply to recurrent genital herpes.
Perhaps the most important limitation of our study is that it was limited to PBMC. Circulating cells may not reflect mucosal immunity, in which a complex milieu including compartmentalized virus-reactive T cells may influence HSV disease course (68, 69). Antigen-specific CD4 T cells can persist at the site of healed herpes (68) or be recruited from the periphery during recurrences (17). Little is known concerning the comparative phenotype or specificity of tissue-resident memory versus circulating HSV-specific CD4 T cells. HSV-2-specific CD4 T cells have additional effector functions, including cytotoxicity and CD40L expression (18, 30), that were not measured in this study. The limited sample size and sampling period for our HSV-shedding studies could have also led to misclassification of true shedding rates, such that larger cohorts or longer severity measurement periods could have allowed biological signals to emerge. The HSV antigen we used was previously shown to include nonstructural as well as structural viral proteins (25, 33) but it is possible that PBMC could contain T lymphocytes nonresponsive to the HSV-2 preparations used in this report. Another possible limitation of our study was the use of ICC rather than of ELISA to measure cytokine reactivity to HSV-2. ICC has the advantage of positively identifying and enumerating the number of reactive cells but the potential disadvantage of not capturing responses by cell populations not specifically gated for during analysis. Cytokine ELISAs can reflect the net, integrated response of all cells but do not provide information concerning the number or identity of reactive cells. The inclusion of brefeldin A during the stimulation for ICC assays prevents ELISA from being performed on the same set of stimulated cell specimens, because this compound inhibits protein egress from cells. Advances in multiplex cytokine ELISA methods suggest that such assays to identify biomarkers of HSV severity may be rational in the future. Multiplex reverse transcription-PCR (RT-PCR) to measure RNA levels is another attractive assay to measure multiple immune parameters in innate or acquired cell populations responding to microbial antigens.
In summary, we have completed a detailed study of the number and function of circulating HSV-2-specific CD4 T cells and of pDC in immunocompetent persons with recurrent genital herpes infection. No correlations were noted between several parameters concerning these cell types and either objectively measured genital HSV shedding or prospectively noted genital lesions. Our data are consistent with neutral influences of HSV-1 on the CD4 T-cell immune response to HSV-2 and with pDC innate sensing of HSV-2 via TLR9. Our data do not support the simple use of PBMC Th1 CD4 T-cell parameters as either a goalpost for vaccine-induced immune responses or as the sole surrogate immune measure of the efficacy of HSV vaccines. Future research will optimally include detailed analyses of defined subsets of these circulating cell types, of CD8 T cells and NK cells, and also of their trafficking and localization to sites of infection.
ACKNOWLEDGMENTS
This work was supported by NIH grants PO1 AI30731 (to A.W., D.M.K., and A.M.), RO1 AI50132 (to D.M.K.), T32 AI007140 (to A.S.K.), T32 AI07044 (to K.E.M. and N.J.M.), K23 AI087206 (to J.T.S.), and K24 AI071113 (to A.W.). The project described was supported in part by grant 1UL1RR025014 from the Clinical and Translational Science Award (CTSA) program of the National Center for Research Resources, NIH, and the NIH Roadmap for Medical Research.
David Knipe kindly provided HSV-2 strain 186. We thank the study participants, the staff of the Virology Research Clinic, and the University of Washington Department of Laboratory Medicine Molecular Diagnostic and Seattle Children's Hospital Virology laboratory locations for assistance with viral PCR and serology.
D.M.K. and A.W. serve as consultants and investigators for companies involved in vaccines and small-molecule drugs for herpes simplex virus infections. D.M.K. is an inventor on patents owned by his institution, the University of Washington, concerning the identity of candidate HSV-2 vaccines.
The content of this article is solely the responsibility of the authors and does not necessarily represent the official views of the NIH.
Footnotes
Published ahead of print 3 July 2012
REFERENCES
- 1. Abbo L, et al. 2007. Selective defect in plasmacyoid dendritic cell function in a patient with AIDS-associated atypical genital herpes simplex vegetans treated with imiquimod. Clin. Infect. Dis. 44:e25–e27 [DOI] [PubMed] [Google Scholar]
- 2. Asanuma H, Sharp M, Maecker HT, Maino VC, Arvin AM. 2000. Frequencies of memory T cells specific for varicella-zoster virus, herpes simplex virus and cytomegalovirus determined by intracellular detection of cytokine expression. J. Infect. Dis. 181:859–866 [DOI] [PubMed] [Google Scholar]
- 3. Ashley RL, Militoni J, Lee F, Nahmias A, Corey L. 1988. Comparison of Western blot (immunoblot) and glycoprotein G-specific immunodot enzyme assay for detecting antibodies to herpes simplex virus types 1 and 2 in human sera. J. Clin. Microbiol. 26:662–667 [DOI] [PMC free article] [PubMed] [Google Scholar]
- 4. Belshe RB, et al. 2012. Efficacy results of a trial of a herpes simplex vaccine. N. Engl. J. Med. 366:34–43 [DOI] [PMC free article] [PubMed] [Google Scholar]
- 5. Bochud PY, Magaret AS, Koelle DM, Aderem A, Wald A. 2007. Polymorphisms in TLR2 are associated with increased viral shedding and lesional rate in patients with genital herpes simplex virus type 2 infection. J. Infect. Dis. 196:505–509 [DOI] [PubMed] [Google Scholar]
- 6. Burchett SK, et al. 1992. Diminished interferon-gamma and lymphocyte proliferation in neonatal and postpartum primary herpes simplex virus infection. J. Infect. Dis. 165:813–818 [DOI] [PubMed] [Google Scholar]
- 7. Casazza JP, et al. 2006. Acquisition of direct antiviral effector functions by CMV-specific CD4+ T lymphocytes with cellular maturation. J. Exp. Med. 203:2865–2877 [DOI] [PMC free article] [PubMed] [Google Scholar]
- 8. Chentoufi AA, et al. 2008. Asymptomatic human CD4+ cytotoxic T-cell epitopes identified from herpes simplex virus glycoprotein B. J. Virol. 82:11792–11802 [DOI] [PMC free article] [PubMed] [Google Scholar]
- 9. Corey L, Reeves WC, Holmes KK. 1978. Cellular immune response in genital herpes simplex virus infection. N. Engl. J. Med. 299:986–991 [DOI] [PubMed] [Google Scholar]
- 10. Corey L, Wald A. 2008. Genital herpes, p 399–437 In Holmes KK, et al. (ed), Sexually transmitted diseases. McGraw Hill Medical, New York, NY [Google Scholar]
- 11. Cunningham AL, Merigan TC. 1983. Gamma interferon production appears to predict time of recurrence of herpes labialis. J. Immunol. 130:2397–2400 [PubMed] [Google Scholar]
- 12. Derhovanessian E, Larbi A, Pawelec G. 2009. Biomarkers of human immunosenescence: impact of cytomegalovirus infection. Curr. Opin. Immunol. 21:440–445 [DOI] [PubMed] [Google Scholar]
- 13. Diggle PJ, Heagerty PJ, Liang KY, Zeger SL. 2002. Analysis of longitudinal data. Oxford University Press, Oxford, United Kingdom [Google Scholar]
- 14. Donaghy H, et al. 2009. Role for plasmacytoid dendritic cells in the immune control of recurrent human herpes simplex virus infection. J. Virol. 83:1952–1961 [DOI] [PMC free article] [PubMed] [Google Scholar]
- 15. Feldman SB, et al. 1994. Viral induction of low frequency interferon-alpha producing cells. Virology 204:1–7 [DOI] [PubMed] [Google Scholar]
- 16. Gebhardt T, et al. 2009. Memory T cells in nonlymphoid tissue that provide enhanced local immunity during infection with herpes simplex virus. Nat. Immunol. 10:524–530 [DOI] [PubMed] [Google Scholar]
- 17. Gebhardt T, et al. 2011. Different patterns of peripheral migration by memory CD4+ and CD8+ T cells. Nature 477:216–219 [DOI] [PubMed] [Google Scholar]
- 18. Gonzalez JC, Kwok WW, Wald A, McClurkan CL, Koelle DM. 2005. Programmed expression of cutaneous lymphocyte-associated antigen amongst circulating memory T-cells specific for HSV-2. J. Infect. Dis. 191:243–254 [DOI] [PMC free article] [PubMed] [Google Scholar]
- 19. Green JA, Weiss PN, Yeh TJ, Spruance SL. 1985. Immune-specific interferon production by peripheral blood mononuclear leukocytes from patients with primary and recurrent oro-labial herpes simplex virus infections. J. Med. Virol. 16:297–305 [DOI] [PubMed] [Google Scholar]
- 20. Harari A, Vallelian F, Meylan PR, Pantaleo G. 2005. Functional heterogeneity of memory CD4 T cell responses in different conditions of antigen exposure and persistence. J. Immunol. 174:1037–1045 [DOI] [PubMed] [Google Scholar]
- 21. Harari A, Vallelian F, Pantaleo G. 2004. Phenotypic heterogeneity of antigen-specific CD4 T cells under different conditions of antigen persistence and antigen load. Eur. J. Immunol. 34:3525–3533 [DOI] [PMC free article] [PubMed] [Google Scholar]
- 22. Hultin LE, et al. 2010. Comparison of interlaboratory variation in absolute T-cell counts by single-platform and optimized dual-platform methods. Cytometry B Clin. Cytom. 78:194–200 [DOI] [PMC free article] [PubMed] [Google Scholar]
- 23. Ida JA, et al. 2006. A whole blood assay to assess peripheral blood dendritic cell function in response to Toll-like receptor stimulation. J. Immunol. Methods 310:86–99 [DOI] [PubMed] [Google Scholar]
- 24. Jerome KR, Huang ML, Wald A, Selke S, Corey L. 2002. Quantitative stability of DNA after extended storage of clinical specimens as determined by real-time PCR. J. Clin. Microbiol. 40:2609–2611 [DOI] [PMC free article] [PubMed] [Google Scholar]
- 25. Jing L, et al. 2012. Herpes simplex virus type 1 T-cells antigens in humans revealed by cross-presentation and genome-wide screening. J. Clin. Invest. 122:654–673 [DOI] [PMC free article] [PubMed] [Google Scholar]
- 26. Khan N, et al. 2004. Herpesvirus-specific CD8 T cell immunity in old age: cytomegalovirus impairs the response to a coresident EBV infection. J. Immunol. 173:7481–7489 [DOI] [PubMed] [Google Scholar]
- 27. Kittan NA, et al. 2007. Impaired plasmacytoid dendritic cell innate immune responses in patients with herpes virus-associated acute retinal necrosis. J. Immunol. 179:4219–4230 [DOI] [PubMed] [Google Scholar]
- 28. Koch S, et al. 2007. Cytomegalovirus infection: a driving force in human T cell immunosenescence. Ann. N. Y. Acad. Sci. 1114:23–35 [DOI] [PubMed] [Google Scholar]
- 29. Koelle DM, Abbo H, Peck A, Ziegweid K, Corey L. 1994. Direct recovery of HSV-specific T lymphocyte clones from human recurrent HSV-2 lesions. J. Infect. Dis. 169:956–961 [DOI] [PubMed] [Google Scholar]
- 30. Koelle DM, et al. 1994. Antigenic specificity of human CD4+ T cell clones recovered from recurrent genital HSV-2 lesions. J. Virol. 68:2803–2810 [DOI] [PMC free article] [PubMed] [Google Scholar]
- 31. Koelle DM, et al. 1998. Clearance of HSV-2 from recurrent genital lesions correlates with infiltration of HSV-specific cytotoxic T lymphocytes. J. Clin. Invest. 101:1500–1508 [DOI] [PMC free article] [PubMed] [Google Scholar]
- 32. Koelle DM, et al. 2000. Tegument-specific, virus-reactive CD4 T cells localize to the cornea in herpes simplex virus interstitial keratitis in humans. J. Virol. 74:10930–10938 [DOI] [PMC free article] [PubMed] [Google Scholar]
- 33. Koelle DM, Schomogyi M, McClurkan C, Reymond SN, Chen HB. 2000. CD4 T-cell responses to herpes simplex virus type 2 major capsid protein VP5: comparison with responses to tegument and envelope glycoproteins. J. Virol. 74:11422–11425 [DOI] [PMC free article] [PubMed] [Google Scholar]
- 34. Laing KJ, et al. 2010. Diversity in CD8(+) T cell function and epitope breadth among persons with genital herpes. J. Clin. Immunol. 30:703–722 [DOI] [PMC free article] [PubMed] [Google Scholar]
- 35. Lund J, Sato A, Akira S, Medzhitov R, Iwasaki A. 2003. Toll-like receptor 9-mediated recognition of herpes simplex virus-2 by plasmacytoid dendritic cells. J. Exp. Med. 198:513–520 [DOI] [PMC free article] [PubMed] [Google Scholar]
- 36. Magaret AS, Wald A, Huang ML, Selke S, Corey L. 2007. Optimizing PCR positivity criterion for detection of herpes simplex virus DNA on skin and mucosa. J. Clin. Microbiol. 45:1618–1620 [DOI] [PMC free article] [PubMed] [Google Scholar]
- 37. Mark KE, et al. 2007. Topical Resiquimod 0.01% gel decreases herpes simplex virus type 2 genital shedding: a randomized, controlled trial. J. Infect. Dis. 195:1324–1331 [DOI] [PubMed] [Google Scholar]
- 38. McKenna DB, Neill WA, Norval M. 2001. Herpes simplex virus-specific immune responses in subjects with frequent and infrequent orofacial recrudescences. Br. J. Dermatol. 144:459–464 [DOI] [PubMed] [Google Scholar]
- 39. Netea MG, Wijmenga C, O'Neill LA. 2012. Genetic variation in Toll-like receptors and disease susceptibility. Nat. Immunol. 13:535–542 [DOI] [PubMed] [Google Scholar]
- 40. Neter J, Wasserman W, Kutner MH. 1990. Applied linear statistical models, 3rd ed Irwin Press, Homewood, IL [Google Scholar]
- 41. Perez de Diego R, et al. 2010. Human TRAF3 adaptor molecule deficiency leads to impaired Toll-like receptor 3 response and susceptibility to herpes simplex encephalitis. Immunity 33:400–411 [DOI] [PMC free article] [PubMed] [Google Scholar]
- 42. Posavad CM, Koelle DM, Shaughnessy MF, Corey L. 1997. Severe genital herpes infections in HIV-infected individuals with impaired HSV-specific CD8+ cytotoxic T lymphocyte responses. Proc. Natl. Acad. Sci. U. S. A. 94:10289–10294 [DOI] [PMC free article] [PubMed] [Google Scholar]
- 43. Pourgheysari B, et al. 2007. The cytomegalovirus-specific CD4+ T-cell response expands with age and markedly alters the CD4+ T-cell repertoire. J. Virol. 81:7759–7765 [DOI] [PMC free article] [PubMed] [Google Scholar]
- 44. Rasmussen LE, Jordan GW, Stevens DA, Merigan TC. 1974. Lymphocyte interferon production and transformation after herpes simplex infections in humans. J. Immunol. 112:728–736 [PubMed] [Google Scholar]
- 45. Sancho-Shimizu V, et al. 2011. Herpes simplex encephalitis in children with autosomal recessive and dominant TRIF deficiency. J. Clin. Invest. 121:4889–4902 [DOI] [PMC free article] [PubMed] [Google Scholar]
- 46. Sato A, Linehan MM, Iwasaki A. 2006. Dual recognition of herpes simplex viruses by TLR2 and TLR9 in dendritic cells. Proc. Natl. Acad. Sci. U. S. A. 103:17343–17348 [DOI] [PMC free article] [PubMed] [Google Scholar]
- 47. Schmid DS, Thieme ML, Gary HE, Reeves WC. 1997. Characterization of T cell responses to herpes simplex virus type 1 (HSV-1) and herpes simplex virus type 2 (HSV-2) using a TNF-beta ELISpot cytokine assay. Arch. Virol. 142:1659–1671 [DOI] [PubMed] [Google Scholar]
- 48. Schuster P, et al. 2010. Co-ordinated regulation of plasmacytoid dendritic cell surface receptors upon stimulation with herpes simplex virus type 1. Immunology 129:234–247 [DOI] [PMC free article] [PubMed] [Google Scholar]
- 49. Siegal FP, et al. 1999. The nature of the principle type 1 interferon-producing cells in human blood. Science 284:1835–1837 [DOI] [PubMed] [Google Scholar]
- 50. Solomon L, et al. 2003. Epidemiology of recurrent genital herpes simplex virus types 1 and 2. Sex. Transm. Infect. 79:456–459 [DOI] [PMC free article] [PubMed] [Google Scholar]
- 51. Sorensen LN, et al. 2008. TLR2 and TLR9 synergistically control herpes simplex virus infection in the brain. J. Immunol. 181:8604–8612 [DOI] [PubMed] [Google Scholar]
- 52. Spruance SL, et al. 1995. Th1/Th2-like immunity and resistance to herpes simplex labialis. Antiviral Res. 28:39–55 [DOI] [PubMed] [Google Scholar]
- 53. Spruance SL, Kriesel JD, Evans TG, McKeough MB. 1995. Susceptibility to herpes labialis following multiple experimental exposures to ultraviolet radiation. Antiviral Res. 28:57–67 [DOI] [PubMed] [Google Scholar]
- 54. Sylwester AW, et al. 2005. Broadly targeted human cytomegalovirus-specific CD4+ and CD8+ T cells dominate the memory compartments of exposed subjects. J. Exp. Med. 202:673–685 [DOI] [PMC free article] [PubMed] [Google Scholar]
- 55. Tassone L, et al. 2010. Defect of plasmacytoid dendritic cells in warts, hypogammaglobulinemia, infections, myelokathexis (WHIM) syndrome patients. Blood 116:4870–4873 [DOI] [PubMed] [Google Scholar]
- 56. Tomasini D, et al. 2010. Plasmacytoid dendritic cells: an overview of their presence and distribution in different inflammatory skin diseases, with special emphasis on Jessner's lymphocytic infiltrate of the skin and cutaneous lupus erythematosus. J. Cutan. Pathol. 37:1132–1139 [DOI] [PubMed] [Google Scholar]
- 57. Tronstein E, et al. 2011. Genital shedding of herpes simplex virus among symptomatic and asymptomatic persons with HSV-2 infection. JAMA 305:1441–1449 [DOI] [PMC free article] [PubMed] [Google Scholar]
- 58. Vescovini R, et al. 2007. Massive load of functional effector CD4+ and CD8+ T cells against cytomegalovirus in very old subjects. J. Immunol. 179:4283–4291 [DOI] [PubMed] [Google Scholar]
- 59. Vestey JP, Norval M, Howie S, Maingay J, Neill WA. 1989. Variation in lymphoproliferative responses during recrudescent orofacial herpes simplex virus infections. Clin. Exp. Immunol. 77:384–390 [PMC free article] [PubMed] [Google Scholar]
- 60. Wakim LM, Waithman J, van Rooijen N, Heath WR, Carbone FR. 2008. Dendritic cell-induced memory T cell activation in nonlymphoid tissues. Science 319:198–202 [DOI] [PubMed] [Google Scholar]
- 61. Wald A, Huang ML, Carrell D, Selke S, Corey L. 2003. Polymerase chain reaction for detection of herpes simplex virus (HSV) DNA on mucosal surfaces: comparison with HSV isolation in cell culture. J. Infect. Dis. 188:1345–1351 [DOI] [PubMed] [Google Scholar]
- 62. Wald A, et al. 2011. Safety and immunogenicity of long HSV-2 peptides complexed with rhHsc70 in HSV-2 seropositive persons. Vaccine 29:8520–8529 [DOI] [PubMed] [Google Scholar]
- 63. Wald A, et al. 2000. Reactivation of genital herpes simplex virus type 2 infection in asymptomatic seropositive persons. N. Engl. J. Med. 342:844–850 [DOI] [PubMed] [Google Scholar]
- 64. Yang CA, et al. 2012. Association of TLR3-hyporesponsiveness and functional TLR3 L412F polymorphism with recurrent herpes labialis. Hum. Immunol. 73:844–851 [DOI] [PubMed] [Google Scholar]
- 65. Yasukawa M, Zarling JM. 1984. Human cytotoxic T cell clones directed against herpes simplex virus-infected cells. I. Lysis restricted by HLA class II MB and DR antigens. J. Immunol. 133:422–427 [PubMed] [Google Scholar]
- 66. Yoneyama H, et al. 2005. Plasmacytoid DCs help lymph node DCs to induce anti-HSV CTLs. J. Exp. Med. 202:425–435 [DOI] [PMC free article] [PubMed] [Google Scholar]
- 67. Zhang SY, et al. 2007. TLR3 deficiency in patients with herpes simplex encephalitis. Science 317:1522–1527 [DOI] [PubMed] [Google Scholar]
- 68. Zhu J, et al. 2009. Persistence of HIV-1 receptor-positive cells after HSV-2 reactivation is a potential mechanism for increased HIV-1 acquisition. Nat. Med. 15:886–892 [DOI] [PMC free article] [PubMed] [Google Scholar]
- 69. Zhu J, et al. 2007. Virus-specific CD8+ T cells accumulate near sensory nerve endings in genital skin during subclinical HSV-2 reactivation. J. Exp. Med. 204:595–603 [DOI] [PMC free article] [PubMed] [Google Scholar]