

Abstract
We used deep sequencing of poly(A) RNA to characterize the transcriptome of an economically important eel virus, anguillid herpesvirus 1 (AngHV1), at a stage during the lytic life cycle when infectious virus was being produced. In contrast to the transcription of mammalian herpesviruses, the overall level of antisense transcription from the 248,526-bp genome was low, amounting to only 1.5% of transcription in predicted protein-coding regions, and no abundant, nonoverlapping, noncoding RNAs were identified. RNA splicing was found to be more common than had been anticipated previously. Counting the 10,634-bp terminal direct repeat once, 100 splice junctions were identified, of which 58 were considered likely to be involved in the expression of functional proteins because they represent splicing between protein-coding exons or between 5′ untranslated regions and protein-coding exons. Each of the 30 most highly represented of these 58 splice junctions was confirmed by RT-PCR. We also used deep sequencing to identify numerous putative 5′ and 3′ ends of AngHV1 transcripts, confirming some and adding others by rapid amplification of cDNA ends (RACE). The findings prompted a revision of the AngHV1 genome map to include a total of 129 protein-coding genes, 5 of which are duplicated in the terminal direct repeat. Not counting duplicates, 11 genes contain integral, spliced protein-coding exons, and 9 contain 5′ untranslated exons or, because of alternative splicing, 5′ untranslated and 5′ translated exons. The results of this study sharpen our understanding of AngHV1 genomics and provide the first detailed view of a fish herpesvirus transcriptome.
INTRODUCTION
The order Herpesvirales consists of three families, Herpesviridae, Alloherpesviridae, and Malacoherpesviridae (18). Most of the more than 50 species in this order for which genome sequences are available belong to the family Herpesviridae, which contains agents infecting mammals, birds, and reptiles. In contrast, genome sequences are available for members of only five species in the family Alloherpesviridae (termed alloherpesviruses), namely, two frog viruses (4) and the fish herpesviruses ictalurid herpesvirus 1 (IcHV1; channel catfish virus) (3), cyprinid herpesvirus 3 (CyHV3; koi herpesvirus) (1), and anguillid herpesvirus 1 (AngHV1; eel herpesvirus) (25). These viruses differ substantially from each other in sequence relatedness and gene content.
Annotation of predicted functional protein-coding regions in a herpesvirus genome sequence generally commences with identification of ATG-initiated open reading frames (ORFs) above a minimum size, modified according to generally perceived features of herpesvirus gene arrangement, such as rarity of extensively overlapping protein-coding regions and splicing. Alignment-based sequence comparisons among related genes may then be used to enhance the predictions. However, the assumptions that are made to sharpen discrimination may lead to the exclusion of genuine genes, especially if they are small or expressed by splicing, are translated from alternative initiation codons, have lengthy overlapping protein-coding regions, or lack similarity to other genes. Also, analyses based on coding potential cannot identify transcripts that do not encode functional proteins. Consequently, an annotation produced by bioinformatic means, especially one for a virus that has no sequenced close relatives, is likely to require significant improvements in light of experimental data.
Among the alloherpesviruses that have been sequenced, the expression of a limited number of predicted protein-coding regions has been investigated experimentally. For IcHV1, several ORFs have been shown to be transcribed in cell culture (11, 21, 22, 23) or in channel catfish (24). Also, ORFs encoding a dozen virion proteins have been identified by mass spectrometry (5), and an additional ORF encodes a mucin-like glycoprotein (29). Probabilistic proteogenomic mapping has demonstrated the expression of 37 ORFs in cell culture and led to the prediction of 17 additional small protein-coding ORFs, and transcription of 23 ORFs has been confirmed (13). For CyHV3, the transcription of 20 ORFs has been demonstrated in cell culture (6), the expression of an envelope protein has been confirmed (19), and 40 virion proteins have been identified by mass spectrometry (16). A similar number of proteins has been identified in AngHV1 virions by mass spectrometry (27).
To extend the knowledge of alloherpesvirus genome expression, we have characterized the transcriptome of AngHV1 by deep sequencing methods, relying on experience gained during a similar exercise conducted on a mammalian herpesvirus, human cytomegalovirus (7). AngHV1 is of economic importance because it causes a hemorrhagic disease in cultured European eels (Anguilla anguilla) and Japanese eels (Anguilla japonica) and is one of the factors thought to be responsible for the decline of wild European eel stocks since the 1980s (8, 9). AngHV1 belongs to the genus Cyprinivirus and has CyHV3 as its closest completely sequenced relative, although the phylogenetic distance is appreciable and the majority of genes are not detectably conserved between the two viruses (25). As a result of our analysis, a substantial amount of information was garnered on transcript layout, and the AngHV1 genome annotation was adjusted accordingly in regard to gene location and splicing patterns. The results have direct consequences as a vital underpinning of future functional studies on AngHV1, including those directed at diagnostic and therapeutic advances. They also point a way for similar studies on other herpesviruses whose genomics are not yet well developed.
MATERIALS AND METHODS
Virus and cells.
The AngHV1 reference strain CVI500138 was isolated in 1998 from diseased eels at an eel farm in the Netherlands (30). This virus was propagated in 1 day-old confluent EK-1 (eel kidney) cell monolayers that were approximately 80% confluent (2). The cells were cultured at 26°C in 5% (vol/vol) CO2 using a growth medium (GM) consisting of Leibovitz's L-15 medium, 2% (vol/vol) fetal bovine serum, 0.075% (wt/vol) NaHCO3, 2 mM l-glutamine, 0.012% (wt/vol) kanamycin, and 270 U/ml penicillin G. For propagation of virus in 6- or 96-well plates, 0.26% instead of 0.075% NaHCO3 was used. Viral titers were determined as described previously (28).
Preparation of infected-cell RNA.
Total cell RNA was isolated from AngHV1-infected cells at 12 h postinfection (p.i.). This stage was chosen because real-time RT-PCR analysis has shown that late transcription is well underway (S. J. van Beurden, B. P. H. Peeters, P. J. M. Rottier, A. J. Davison, and M. Y. Engelsma, submitted for publication), and one-step growth curves have demonstrated that infectious virus production is in mid-logarithmic phase (20; data not shown). A monolayer of EK-1 cells (approximately 80% confluent) in a 150-cm2 flask was washed once with GM and infected with 5 50% tissue culture infective doses (TCID50) of AngHV1 per cell in a total of 25 ml GM at 26°C for 30 min. The monolayer was washed three times with GM and incubated with 50 ml GM at 26°C. At 12 h p.i., the medium was discarded and the cells were washed with 25 ml phosphate-buffered saline (PBS). The cells were dislodged by using 4 ml 0.01% (wt/vol) trypsin in PBS and resuspended in 25 ml GM. The sample was divided into two. The cells were pelleted by centrifugation at 300 × g for 5 min, the supernatants were discarded, and the pellets were loosened by flicking the tubes thoroughly. RNA was extracted from each suspension with an RNeasy midikit (Qiagen, Hilden, Germany) after disruption by adding 4 ml RTL buffer from the kit and homogenization by vortexing for 10 s and passaging 10 times through a 20-gauge needle. RNA was finally eluted from each extract in two 250-μl volumes of water. The RNA concentration was determined by spectrophotometry (Nanodrop, Wilmington, DE), and RNA integrity was assessed by using a Bioanalyzer (Agilent Technologies, Santa Clara, CA).
Deep sequencing of RNA.
Deep sequencing of poly(A) RNA isolated from the RNA preparation was performed as described previously (7). An mRNA-Seq library prep kit and a small RNA sample prep kit (Illumina, San Diego, CA) were used to prepare material for sequencing, and data were derived by using a Genome Analyzer IIx (Illumina). The data were single ended and directional (i.e., they imparted information on transcript orientation). A data set of unaligned 76-base reads in fastq format, with associated phred quality scores, was generated by using SCS 2.6 or 2.8, RTA 1.12, and CASAVA 1.7 (Illumina).
Transcriptome profile.
The read data set was assembled against a reference sequence by using Maq 0.7.1 (15) with default alignment settings, and the assembly was visualized by using Tablet 1.10.05.21 (17). Alignment utilized the published AngHV1 strain CVI500138 genome sequence initially (25) and a corrected version subsequently. Reads were sorted into those originating from the positive and negative strands in order to generate directional transcription profiles, which were calculated from the number of reads commencing in contiguous 10-base windows and summed over 100-base windows with 10-base increments.
Splice site identification.
Potential splice sites were identified from the read data set as described previously (7). Briefly, reads potentially representing splice junctions were detected on the basis that they must match two regions in the AngHV1 genome located between 50 bases and 32 kb apart, that the potential splice sites must be located on the same strand with the donor upstream from the acceptor, and that the intervening sequence must begin with GT and end with AG (the canonical splice site dinucleotides). By this approach, spliced poly(A) RNAs that contained very short exons, that consisted of exons mapping <50 bases or >32 kb apart, or that utilized noncanonical splicing might not have been detected. Nonpoly(A) RNAs would not have been identified.
Having compiled sets of potential donor and acceptor sites from this analysis, the data set was examined exhaustively for reads supporting each possible splice junction, regardless of the order and orientation of the contributing donor and acceptor sites in the genome. The set of potential splice junctions produced by this process was designated set I. The derivation of sets II and III from set I is described in Results and Discussion.
RT-PCR analysis of splice junctions.
For splice junctions in set II that were supported by >10 reads, 20-base oligonucleotide primers were designed exactly 100 bases upstream and 100 bases downstream, so that they would putatively generate products of 200 bp. A Titanium one-step RT-PCR kit (Clontech Laboratories, Mountain View, CA) was used to generate products in 50-μl reaction mixtures containing 72 ng RNA. The thermal cycling conditions consisted of 1 h at 50°C, 5 min at 94°C, 35 cycles of 30 s at 94°C, 30 s at 65°C, and 1 min at 68°C, and a final extension step of 2 min at 68°C.
Products were visualized on agarose gels stained with ethidium bromide and either photographed under shortwave UV illumination or excised under longwave UV illumination. The region of the gel containing DNA molecules of 200 bp was excised, whether or not a band was visible, and DNA was extracted by using a QIAEX II gel extraction kit (Qiagen). DNA was capillary sequenced directly by using the RT-PCR primers. Data were considered supportive of a splice junction if at least one good-quality sequence obtained per RT-PCR product spanned the junction.
If sequencing was not successful, RT-PCR was repeated using a decreased annealing temperature (60°C). If this also failed, RT-PCR was carried out using alternative primers that matched exactly 120 or 80 bases upstream and 80 or 120 bases downstream, respectively. In one instance of unsuccessful RT-PCR due to dominant alternative splicing, a primer spanning the alternative splice site was used. The primers are listed in Table S1 in the supplemental material.
Construction and analysis of cDNA libraries.
cDNA libraries were generated from the RNA preparation by using an ExactSTART eukaryotic mRNA 5′ and 3′ rapid amplification of cDNA ends (RACE) kit (Epicentre Biotechnologies, Madison, WI). The method involved attaching an RNA adaptor to the 5′ ends of decapped, phosphorylated RNA (thus contributing a 5′-PCR priming site), synthesizing first-strand cDNA by reverse transcription by using a tagged, oligo(dT)-containing primer (thus contributing a 3′-PCR priming site), and amplifying full-length cDNAs by PCR using primers matching the 5′ and 3′ priming sites. Two cDNA libraries (I and II) were made, differing in the 5′ primer used: the primers were 5′-TCA TAC ACA TAC GAT TTA GGT GAC ACT ATA GAG CGG CCG CCT GCA GGA AA-3′, supplied in the kit, for library I, and 5′-TCA TAC ACA TAC GAT TTA GAC AGT GCT ATA GAG CGG CCG CCT GCA GG-3′ for library II; the differing internal nucleotides are underlined. 5′- and 3′-RACE products from a selection of viral transcripts were generated by PCR from library I by using the relevant 5′ primer or 3′ primer from the kit plus a gene-specific primer (see Table S2 in the supplemental material). Specific RACE products (see Table S2) were isolated by agarose gel electrophoresis, and the inserts in plasmid clones were capillary sequenced.
In addition to analyzing transcript ends by RACE, deep sequencing was performed on cDNA libraries I and II as an indexed pair by standard techniques using a Genome Analyzer IIx (Illumina). Data sets of 73-base reads were analyzed by using appropriate Perl scripts (7). To identify the locations of transcript 5′ ends, the data sets were filtered separately for reads containing a sub-sequence of the appropriate 5′ primer, and the portions that represented putative 5′-end sequences were assembled against the AngHV1 reference sequence. To identify the locations of transcript 3′ ends, the reads in the directional RNA sequence data set were trimmed at their 3′ ends to 73 bases and combined with those in cDNA libraries I and II. The combined data set was filtered for reads containing 12 consecutive A residues, which potentially originated from the poly(A) tract at the 3′ end of transcripts. The portions that represented putative 3′-end sequences were assembled against the AngHV1 reference sequence.
A cDNA library was also generated by using a SMARTer RACE kit (Clontech Laboratories, Mountain View, CA). This method involved synthesizing first-strand cDNA by reverse transcription by using a tagged, oligo(dT)-containing primer (thus contributing a 3′-PCR priming site) and a polymerase that adds a few nontemplated residues to the 3′ end of the cDNA. The second DNA strand was synthesized by using a tagged oligonucleotide (thus contributing a 5′ PCR priming site) that primes from the nontemplated residues. Regions containing 5′ ends were amplified by using a primer matching the 5′ priming site and gene-specific primers. Most 5′-end RACE products were then subjected to a second round of PCR using an alternative primer matching the 5′ priming site and alternative gene-specific primers (i.e., nested PCR). Regions containing 3′ ends were amplified similarly, using a primer matching the 3′ priming site and gene-specific primers. The primers used are listed in Table S2 in the supplemental material. RACE products were isolated by agarose gel electrophoresis, and the inserts in plasmid clones were capillary sequenced.
Accession numbers.
The Illumina read data sets reported in this paper have been deposited in the European Nucleotide Archive under accession numbers ERP001424 (data sets from cDNA libraries I and II) and ERP001425 (RNA sequence data set).
RESULTS AND DISCUSSION
Corrections to the AngHV1 genome sequence.
Deep sequencing of the poly(A) fraction of total infected-cell RNA yielded a data set of 34,021,601 reads. Initial alignments showed that the published AngHV1 genome sequence (GenBank accession no. FJ940765.1; 248,531 bp) contained four erroneous regions. These were corrected by (i) deletion of ATG at position 82560 to 82562, (ii) replacement of CC by GT at position 157991 to 157992, (iii) replacement of A by T at position 157997, and (iv) deletion of TG at position 203749 to 203750. Correction (i) is located in ORF51 and results in the deletion of an amino acid residue from the encoded protein. Corrections (ii) and (iii) are located in ORF94 and result in two amino acid substitutions. Correction (iv) is located in ORF116 and results in a C-terminal extension of the large subunit of ribonucleotide reductase (25). In addition to these errors, six polymorphisms were detected where the nucleotide in the published sequence is in the minority, at positions 35824, 37970, 38114, 38201, 74192, and 150546. The genome sequence was corrected to incorporate the majority variant at five of these positions. The exception, at 37970, results in an alteration (ATG to GTG) of the initiation codon of ORF25, which encodes a homolog of interleukin-10 (25, 26). This nucleotide was left as the minority variant in order to retain the amino acid sequence of ORF25 in the GenBank file. The corrected AngHV1 genome sequence (GenBank accession no. FJ940765.3; 248,526 bp) was used in subsequent analyses. A total of 1,786,554 reads in the data set (5.25%) aligned with this sequence.
AngHV1 transcriptome profile.
The analysis resulted not only in a corrected AngHV1 genome sequence but also in an updated genetic map, as described below. Figure 1 depicts this map aligned with the transcriptome profile shown as the densities (on a log10 scale) of reads representing rightward and leftward transcription. Almost all regions of the genome were transcribed, although the level was low in some (particularly the terminal direct repeat). In nearly all locations, most transcription corresponded to expression of predicted protein-coding regions. Indeed, antisense transcripts were rare, amounting to only 1.5% of total transcription from protein-coding regions. The region containing ORF89 and ORF90 is exceptional in that antisense transcription was about five times more abundant than sense transcription. This transcript (ORF89as) accounted for approximately half of the total amount of antisense transcription from the genome. However, ORF89as may not be entirely antisense, as it probably contains ORF91 in its 3′ portion.
Fig 1.

Map of the AngHV1 genome showing transcription and splicing of ORFs predicted to encode functional proteins. The terminal direct repeats are shaded gray. ORFs are depicted as color-shaded arrows, with names (lacking the ORF prefix) below. The ORF colors indicate conservation among alloherpesviruses or families of related genes (see the key). Introns connecting spliced ORFs are shown as narrow white bars. The locations of transcript 5′ and 3′ ends (Tables 2 and 3) are marked, rightward above the genome and leftward below. The light-yellow windows contain the transcriptome profile as two traces, separated into rightward (black) and leftward (gray) transcripts. The vertical lines indicate the locations of splice donor and acceptor sites supported by >10 reads (Table 1; also see data set S1 [set II] in the supplemental material), divided into rightward (magenta) and leftward (cyan) splicing. The height of each line indicates the number of reads supporting transcription of the splice site, plotted on a log10 scale.
Identification of splice sites in the AngHV1 genome.
The notation (e.g., D+199826∧A+200193) used below to denote a splice junction is as follows: D (donor) or A (acceptor), + (rightward transcription) or − (leftward transcription), the nucleotide locations of the exon ends, and ∧ (splice junction). The initial splicing analysis identified 160 potential splice junctions involving 124 donor and 64 acceptor sites (see set I in data set S1 in the supplemental material). Set II (see data set S1) was generated by excluding probable artifactual junctions from set I, namely, 59 for which the two cognate genome locations fell within a tandem reiteration and thus had been mapped ambiguously and 1 for which the two genome locations were characterized by local repeats (two closely located 8-bp regions) that may have promoted template switching during reverse transcription. Set II contains 100 junctions representing the 92 donor and 52 acceptor sites marked in Fig. 1.
All 37 of the splice junctions in set II supported by >10 reads were assessed by RT-PCR and sequencing. When amplification was conducted under standard conditions, the cognate sequences of 21 junctions were detected, even in instances where a DNA band was not visible by agarose gel electrophoresis (Fig. 2A to D). Decreasing the annealing temperature to 60°C resulted in success for 12 of the remaining junctions (Fig. 2E and F). Two junctions were resolved by using alternative primers shifted 20 bases to the left or right (Fig. 2G) and one by using an alternative primer that spanned a nearby dominant alternative donor site (Fig. 2H). One junction (D+104012∧A+104119) was not confirmed in these experiments. Thus, all but one of the junctions in set II that were supported by >10 reads were detected by RT-PCR.
Fig 2.

RT-PCR products generated from AngHV1 splice junctions supported by >10 reads in data set S1 (set II) in the supplemental material and visualized by agarose gel electrophoresis. The lane numbers correspond to the experiments listed in Table S1 in the supplemental material. (A to D) RT-PCR was carried out under standard conditions. (E, F) RT-PCR was carried out using the same primers but under relaxed conditions. (G) RT-PCR was carried out using alternative primers under standard conditions. (H) RT-PCR was carried out under standard conditions using alternative primers, one of which spanned a dominant alternative donor site. Experiment 20 failed under all conditions tried, and data are not shown. “MA” denotes a 100-bp DNA marker ladder with major bands at 500 and 1,000 bp. The 200-bp band, which indicates the region of the gel excised for DNA sequencing, is shown by an arrowhead in each panel.
Set III (see data set S1 in the supplemental material) was generated by excluding junctions (which are not considered artifactual) from set II that are not associated with in-frame splicing between predicted protein-coding regions or splicing of 5′ untranslated regions (5′ UTRs) to protein-coding regions. All but two of the excluded junctions (the exceptions being D−26117∧A−16702 and D+199826∧A+200193) were supported by low proportions of reads in comparison with the support for unspliced transcripts (data not shown). Set III contains 58 junctions contributed by splicing of 57 donor and 29 acceptor sites. This set, which we infer to be the most likely to be involved in the expression of functional proteins, is also listed in Table 1. All 30 of the junctions in set III supported by >10 reads were detected by RT-PCR, as described above.
Table 1.
AngHV1 ORFs transcribed by splicing between protein-coding exons or between 5′ UTRs and protein-coding exons
| ORFa | Splice junction | No. of readsb | Typec |
|---|---|---|---|
| ORF1 | D−3138∧A−2852 | 73 | P |
| D−1938∧A−1810 | 15 | P | |
| ORF6A | D+8474∧A+8715 | 3 | P |
| ORF10 | D−38524∧A−16702 | 5 | P |
| D−16289∧A−16187 | 50 | P | |
| D−15971∧A−14866 | 68 | P | |
| D−14481∧A−12487 | 49 | P | |
| ORF19 | D+23432∧A+27106 | 1 | U |
| D+26343∧A+27106 | 461 | P | |
| D+26544∧A+27106 | 29 | P | |
| ORF29 | D−61206∧A−43244 | 2 | U/P |
| D−46317∧A−43244 | 81 | U | |
| D−46054∧A−43244 | 3 | U | |
| D−45795∧A−43244 | 12 | U | |
| D−45017∧A−43244 | 11 | P | |
| D−44470∧A−43244 | 11 | U | |
| ORF51 | D−84760∧A−82797 | 16 | U |
| D−84106∧A−82797 | 2 | U | |
| D−83959∧A−82797 | 1 | U | |
| D−83109∧A−82797 | 1,073 | P | |
| D−83104∧A−82797 | 1,076 | U | |
| ORF52 | D+80715∧A+82795 | 92 | P |
| D+81069∧A+82795 | 19 | U | |
| D+81947∧A+82795 | 445 | P | |
| D+81958∧A+82795 | 331 | U | |
| D+82357∧A+82795 | 3 | U | |
| D+82648∧A+82795 | 1 | U | |
| ORF59 | D+93589∧A+94994 | 119 | U |
| D+93782∧A+94994 | 5 | U | |
| ORF83 | D+93589∧A+125868 | 1 | U |
| D+104012∧A+125868 | 6 | U | |
| D+111704∧A+125868 | 1 | U | |
| D+125696∧A+125868 | 530 | U | |
| ORF71 | D−111668∧A−111583 | 289 | P |
| D−111311∧A−111234 | 74 | P | |
| ORF90 | D−149349∧A−149249 | 48 | P |
| ORF92A | D+154521∧A+154652 | 5 | P |
| ORF97 | D−166645∧A−162067 | 1 | U |
| D−165222∧A−162067 | 1 | U | |
| D−164962∧A−162067 | 1 | U | |
| D−163629∧A−162067 | 8 | P | |
| D−163486∧A−162067 | 2 | U | |
| ORF100 | D−173459∧A−173267 | 36 | U |
| D−172973∧A−172163 | 186 | P | |
| D−171325∧A−169861 | 335 | P | |
| ORF106 | D−199616∧A−182769 | 1 | U |
| D−193915∧A−182769 | 1 | U/P | |
| D−190222∧A−182769 | 6 | U | |
| D−186050∧A−182769 | 2 | P | |
| D−185616∧A−182769 | 10 | U | |
| D−183047∧A−182769 | 1 | U | |
| ORF112 | D+200109∧A+200193 | 79 | P |
| ORF127 | D−223119∧A−222990 | 262 | P |
| D−222245∧A−222143 | 76 | P | |
| ORF131 | D−228535∧A−228420 | 18 | P |
| D−228091∧A−227970 | 28 | P | |
| ORF134 | D+234296∧A+234913 | 338 | P |
| D+235104∧A+235251 | 133 | P |
Derived from data set S1 (set III) in the supplemental material.
The numbers of reads in the data set containing a 20-base sequence (10 bases on each side) at the splice junction. These provide estimates of relative abundance of spliced transcripts. Derived from data set S1 (set III) in the supplemental material.
P, splicing between predicted protein-coding exons (5′ UTR has appropriate ATG codon); U, splicing of a 5′ UTR to a predicted protein-coding exon (5′ UTR lacks appropriate ATG codon); U/P, not determined (5′ UTR has appropriate ATG codon but 5′ end was not mapped). Derived from the locations of splice sites (Table 1) and 5′ ends (Tables 2 and 3).
Identification of 5′ and 3′ ends of AngHV1 RNAs.
The set of 5′ ends shown in Table 2 was derived by deep sequencing cDNA libraries I and II, which were generated by using an ExactSTART kit. Totals of 12,025/22,282,533 and 4,212/10,488,384 reads, respectively, originated from potential 5′ ends, which were scored when supported by >10 reads in library I. The most likely artifactual 5′ ends would have been caused by mispriming during library construction and were excluded on the basis of possessing one or more of the following characteristics: (i) close proximity to the 3′ end of a highly expressed RNA, (ii) extended (but not necessarily perfect) complementarity of the 5′ primer to the genome sequence immediately upstream, and (iii) absence from library II (which utilized an alternative 5′ primer) in instances where the 5′ end was highly represented in library I. This resulted in a conservative set of 71 candidate 5′ ends, one of which is duplicated in the direct terminal repeat. Of these, 53 are located close to and upstream from an ORF, three could serve to initiate a 5′ UTR spliced to a protein-coding region (see below), and 15 are located within ORFs and might generate N-terminally truncated proteins. This set of 5′ ends is bound to be incomplete, as the approach favored short, abundant RNAs. It is also possible that some artifactual occurrences have been retained.
Table 2.
Locations of 5′ and 3′ ends of AngHV1 RNAs identified by deep sequencing
| Position of enda | ORF |
|---|---|
| 5′ ends | |
| 8018 (−) | ORF5 |
| 11043 (+) | ORF8 |
| 12616 (+) | ORF11 |
| 13619 (+) | ORF12 |
| 19326 (−) | ORF16 |
| 20103 (−) | ORF17 |
| 28964 (+) | ORF20 |
| 33015 (+) | ORF22 |
| 34570 (+) | ORF23 |
| 35843 (+) | ORF23 internal |
| 37952 (+) | ORF25 |
| 38008 (+) | ORF25 internal |
| 39459 (+) | ORF26 |
| 43264 (−) | ORF29 |
| 46408 (−) | ORF29 5′ UTR |
| 48507 (+) | ORF32 |
| 49936 (−) | ORF33 |
| 55324 (+) | ORF35 |
| 57597 (−) | ORF36 |
| 67145 (+) | ORF42 |
| 69125 (−) | ORF43 |
| 75674 (+) | ORF47 |
| 78806 (+) | ORF48 internal |
| 79501 (+) | ORF48 internal |
| 80890 (+) | ORF50 |
| 81792 (+) | ORF52 |
| 82859 (−) | ORF51 |
| 83153 (−) | ORF51 5′ UTR |
| 83219 (−) | ORF51 5′ UTR |
| 84012 (+) | ORF53 |
| 84423 (+) | ORF53 internal |
| 93119 (−) | ORF57.5 internal |
| 93288 (−) | ORF57.5 |
| 99008 (+) | ORF64 |
| 109201 (−) | ORF68 |
| 109753 (−) | ORF69 |
| 110120 (−) | ORF70 internal |
| 110191 (−) | ORF70 internal |
| 115444 (+) | ORF75 |
| 118650 (−) | ORF78 internal |
| 118683 (−) | ORF78 internal |
| 118749 (−) | ORF78 |
| 118844 (+) | ORF79 |
| 123612 (−) | ORF81 |
| 123639 (−) | ORF81 |
| 134811 (+) | ORF83 internal |
| 138235 (−) | ORF85 |
| 146586 (−) | ORF88 internal |
| 156970 (+) | ORF94 |
| 159480 (−) | ORF95 |
| 162216 (−) | ORF97 |
| 167347 (+) | ORF99 |
| 173460 (+) | ORF104 |
| 176449 (+) | ORF104 internal |
| 177530 (+) | ORF105 |
| 187298 (+) | ORF108 |
| 192134 (+) | ORF109 internal |
| 197489 (+) | ORF111 |
| 202975 (−) | ORF114 |
| 202993 (+) | ORF115 |
| 203076 (+) | ORF115 internal |
| 206286 (−) | ORF116 |
| 207022 (−) | ORF117 |
| 208041 (−) | ORF118 |
| 211644 (+) | ORF121 |
| 211710 (+) | ORF121 |
| 212728 (+) | ORF122 |
| 213009 (+) | ORF122 |
| 214719 (+) | ORF124 |
| 220104 (+) | ORF126 |
| 220185 (+) | ORF126 |
| 3′ ends | |
| 585 (−) | ORF1 |
| 4497 (−) | ORF3 |
| 4833 (−) | ORF3 |
| 6015 (−) | ORF4 |
| 7383 (−) | ORF5 |
| 10144 (+) | ORF6A |
| 11840 (+) | ORF8 |
| 11846 (−) | ORF10 |
| 13505 (+) | ORF11 |
| 13578 (+) | ORF11 |
| 14475 (+) | ORF12 |
| 15968 (+) | ORF13 |
| 18324 (+) | ORF14, ORF15 |
| 18378 (−) | ORF16 |
| 19358 (−) | ORF17, ORF18 |
| 30878 (+) | ORF19, ORF20 |
| 33831 (+) | ORF21 |
| 37102 (+) | ORF22, ORF23 |
| 37959 (−) | None |
| 38517 (+) | ORF24, ORF25 |
| 40528 (−) | ORF28 |
| 40534 (+) | ORF26, ORF27 |
| 42200 (−) | ORF29 |
| 46557 (+) | ORF30 |
| 49351 (+) | ORF31, ORF32 |
| 49397 (+) | ORF31, ORF32 |
| 49464 (−) | ORF33 |
| 56376 (+) | ORF34, ORF35 |
| 56380 (−) | ORF36, ORF37, ORF38 |
| 62265 (+) | ORF39 |
| 68468 (+) | ORF40, ORF41, ORF42 |
| 68472 (−) | ORF43, ORF44 |
| 77464 (+) | ORF45, ORF46, ORF47 |
| 80349 (+) | ORF48 |
| 81840 (+) | ORF49, ORF50 |
| 81849 (−) | ORF51 |
| 84956 (+) | ORF52, ORF53 |
| 86174 (−) | ORF55 |
| 86178 (+) | ORF54 |
| 92178 (+) | ORF56 |
| 92183 (−) | ORF57, ORF57.5, ORF58 |
| 95585 (−) | ORF60, ORF61, ORF62 |
| 95631 (+) | ORF59 |
| 95638 (−) | ORF60, ORF61, ORF62 |
| 99973 (+) | ORF63, ORF64 |
| 99977 (−) | ORF65 |
| 103861 (+) | ORF66 |
| 108255 (−) | ORF68 |
| 108295 (+) | ORF67 |
| 109204 (−) | ORF69, ORF70 |
| 110348 (−) | ORF71 |
| 111957 (−) | ORF73, ORF74 |
| 116447 (+) | ORF75 |
| 116452 (−) | ORF76 |
| 116518 (+) | ORF75 |
| 116523 (−) | ORF76 |
| 117520 (−) | ORF77, ORF78 |
| 119726 (+) | ORF79 |
| 119734 (−) | ORF80 |
| 122033 (−) | ORF81, ORF82 |
| 136575 (−) | ORF85 |
| 136580 (+) | ORF83, ORF84 |
| 142583 (+) | ORF86 |
| 145080 (+) | ORF87 |
| 145410 (−) | ORF88, ORF89 |
| 148814 (−) | ORF90 |
| 152499 (+) | ORF91 |
| 155002 (+) | ORF92, ORF92A |
| 155830 (+) | ORF92B |
| 158201 (−) | ORF95 |
| 158264 (+) | ORF93, ORF94 |
| 159533 (−) | ORF96 |
| 160682 (−) | ORF97 |
| 168795 (+) | ORF98, ORF99 |
| 168802 (−) | ORF100 |
| 171336 (+) | ORF101 |
| 172962 (+) | ORF102 |
| 178357 (+) | ORF103, ORF104, ORF105 |
| 178392 (−) | ORF106 |
| 187348 (+) | ORF107 |
| 190548 (+) | ORF108 |
| 193002 (+) | ORF109 |
| 199700 (+) | ORF110, ORF111 |
| 202302 (+) | ORF112, ORF113 |
| 202307 (−) | ORF114 |
| 203433 (+) | ORF115 |
| 203448 (−) | ORF116 |
| 206376 (−) | ORF117 |
| 206983 (−) | ORF118 |
| 211537 (+) | ORF119, ORF120 |
| 213652 (+) | ORF121, ORF122 |
| 215604 (+) | ORF123, ORF124 |
| 219125 (+) | ORF125 |
| 221069 (+) | ORF126 |
| 221281 (−) | ORF127 |
| 224617 (−) | ORF130 |
| 238020 (+) | ORF134 |
+, rightward transcription; −, leftward transcription. Duplicates in the direct terminal repeat are not included. Some ends exhibited heterogeneous distribution over closely located nucleotides, and in these instances, the most frequently identified location is listed.
One of the 5′ ends located within an ORF was postulated to define an abundant transcript encoding a distinct function. This transcript was specified by ORF57.5 (Fig. 1), which encodes an N-terminally truncated form of the ORF57 protein. The argument for this assignment rests on evidence that ORF57 specifies the capsid maturation protease (25, 27). The ORF corresponding to ORF57 in mammalian herpesviruses encodes an internally initiated RNA specifying an abundant protein that lacks the protease domain and functions as the major capsid scaffold protein. This nested arrangement is potentially common to all herpesviruses. It is possible that functional, truncated proteins are encoded by the other AngHV1 ORFs in which internal 5′ ends are present, but there are insufficient data at present to support their annotation.
The set of 3′ ends of AngHV1 RNAs shown in Table 2 was derived from combined deep sequencing data sets from cDNA libraries I and II and the directional RNA sequencing experiment. A total of 17,700/66,792,518 reads originated from potential 3′ ends, which were scored when supported by ≥1 reads. The most likely artifactual 3′ ends were excluded on the basis of possessing one of the following characteristics: (i) lack of any contributing reads that fully matched the genome sequence, (ii) being identified by a single read indicating a 3′ end that is not located close to and downstream from an ORF or a canonical poly(A) signal (AATAAA or ATTAAA), or (iii) being identified by reads indicating a 3′ end that is located at a poly(A) tract (>5 residues) in the genome and not close to and downstream from a poly(A) signal. This resulted in a conservative set of 96 candidate 3′ ends, 7 of which are duplicated in the direct terminal repeat. All but one of these are located close to and downstream from a canonical poly(A) signal, the exception being that for ORF71 (TTTAAA). All identified ends but one are located appropriately to terminate the transcription of at least one ORF, as is visibly the case in many instances from the transcriptome profile (Fig. 1). The exception, at position 37959, is located downstream from a poly(A) signal but is also adjacent to a poly(A) tract of 7 residues and may be artifactual.
In order to confirm the 5′ and 3′ ends mapped by deep sequencing (Table 2), RACE experiments were carried out by using an ExactSTART kit and a SMARTer RACE kit. This dual approach was taken because the ExactSTART kit was used to generate cDNA libraries for both deep sequencing and RACE, whereas the SMARTer RACE kit works in a different way. Figure 3 shows the RACE products that were sequenced, and Table 3 summarizes the ends that were identified. The ends mapped by deep sequencing and RACE show a high degree of concordance.
Fig 3.

RACE products generated from AngHV1 transcripts and visualized by agarose gel electrophoresis. The lane numbers correspond to the experiments listed in Table 3 and Table S2 in the supplementary material. “MA” denotes a 100-bp DNA marker ladder with major bands at 500 bp (arrowheads) and 1,000 bp. The sizes of the bands analyzed are listed in Table S2 in the supplementary material.
Table 3.
Locations of 5′ and 3′ ends of AngHV1 RNAs identified by RACE
| End, method, and expta | ORF | Locationb | Frequencyc | Splicingd |
|---|---|---|---|---|
| 5′ ends, SMARTer RACE | ||||
| 01 | ORF18 | 26335-6 (−) | 4/6 (1) | None |
| 02 | ORF19 | 26232 (+) | 4/6 (2) | D+26343∧A+27106e |
| 03 | ORF19 | 26232 (+) | 8/18 (3) | None |
| 26442 (+) | 3/18 (1) | None | ||
| 04 | ORF25 | 37952 (+)l | 1/18 (1) | None |
| 37967 (+) | 1/18 | None | ||
| 37976 (+)f,m | 5/18 (1) | None | ||
| 37995 (+)f | 1/18 | None | ||
| 38012-3 (+)f,m | 2/18 (1) | None | ||
| 38032-3 (+)f,m | 1/18 | None | ||
| 38052 (+)f | 1/18 | None | ||
| 38099-100 (+)f | 2/18 | None | ||
| 05 | ORF29 | 46424-5 (−)m | 6/18 (4) | D−46317∧A−43244 |
| 46408 (−)l | 2/18 | D−46317∧A−43244 | ||
| 45738 (−) | 1/18 | D−45592∧A−43244g | ||
| 45183 (−) | 1/18 | D−45017∧A−43244h | ||
| 43304-6 (−)m | 2/18 (1) | None | ||
| 06 | ORF43 | 69124 (−)l | 4/6 (2) | None |
| 07 | ORF51 | 82859-60 (−)l | 10/12 (2) | None |
| 08 | ORF51 | 82859-60 (−)l | 5/18 (1) | None |
| 83153-4 (−)l | 4/18 (1) | D−83104∧A−82797 | ||
| 83153-4 (−)l | 4/18 (1) | D−83109∧A−82797 | ||
| 09 | ORF52 | 80341 (+)m | 1/18 | D+80715∧A+82795 |
| 81791-2 (+)l | 6/18 (3) | D+81947∧A+82795h | ||
| 81791-2 (+)l | 3/18 (1) | D+81958∧A+82795 | ||
| 82673-4 (+)m | 1/18 (1) | None | ||
| 10 | ORF59 | 93506-8 (+)m | 3/6 (2) | D+93589∧A+94994 |
| 11 | ORF89asi | 147018-9 (+) | 5/6 (1) | None |
| 12 | ORF97 | 162266-7 (−)m | 2/12 | None |
| 162221-3 (−)m | 3/12 | None | ||
| 162216 (−)l | 1/12 (1) | None | ||
| 162160-1 (−)f,m | 2/12 | None | ||
| 162143 (−)f,m | 2/12 | None | ||
| 13 | ORF100 | 178287 (−) | 1/18 | D−178008∧A−173267g |
| 173550-1 (−)m | 3/18 | None | ||
| 173550-1 (−)m | 3/18 | D−173459∧A−173267 | ||
| 173265 (−) | 3/18 | None | ||
| 14 | ORF105 | 177530 (+)l | 3/6 (2) | None |
| 15 | ORF106 | 186134 (−) | 2/12 (2) | D−185616∧A−182769 |
| 182814 (−) | 6/12 | None | ||
| 16 | ORF115 | 202995 (+)l | 4/6 (2) | None |
| 17 | ORF126 | 220185 (+)l | 5/6 | None |
| 3′ ends, SMARTer RACE | ||||
| 18 | ORF25j | |||
| 19 | ORF42 | 68468 (+)n | 3/6 (2) | None |
| 20 | ORF43 | 68472 (−)n | 3/6 (3) | None |
| 21 | ORF59 | 95631 (+)n | 6/6 | None |
| 22 | ORF126 | 221069 (+)n | 5/6 (1) | None |
| 23 | ORF131 | 227069 (−) | 2/6 (4) | None |
| 5′ ends, ExactSTART | ||||
| 24 | ORF25 | 37952 (+)l | 1/1 | None |
| 25 | ORF43 | 68966 (−)f,k,m | 1/1 | None |
| 26 | ORF100 | 173549 (−)m | 1/1 | D−173459∧A−173267 |
| 27 | ORF126 | 220189 (+)l | 1/1 | None |
| 3′ ends, ExactSTART | ||||
| 28 | ORF25 | 38517 (+)n | 1/1 | None |
| 29 | ORF42 | 68468 (+)n | 1/1 | None |
| 30 | ORF43 | 68471 (−)n | 1/1 | None |
| 31 | ORF59 | 95631 (+)n | 1/1 | None |
| 32 | ORF126 | 221069 (+)n | 1/1 | None |
These numbers correspond to the lane numbers in Fig. 3 and the experiment numbers in Table S2 in the supplemental material.
The most frequently detected genome coordinate is shown; (+), rightward transcription; (−), leftward transcription. Ambiguity is due to the SMARTer RACE method.
Number of plasmids that supported the location/total number sequenced. Parenthetical numbers are the number of additional plasmids from which ends were mapped within a few nucleotides.
D, donor site; A, acceptor site; +, rightward transcription; −, leftward transcription; ∧, splice junction.
Predicted to replace the N-terminal portion of the full-length protein.
Downstream from the first ATG codon. For ORF25, truncated proteins would lack a signal peptide.
Donor site not detected by deep sequencing.
Predicted to extend the N-terminal portion of the annotated protein.
Antisense to ORF89 and ORF90.
No viable bacterial clones were obtained.
A probable artifactual product was analyzed.
Candidate 5′ end also identified from deep sequencing at or within a few nucleotides, supported by >10 reads in library I and included in Table 2.
Candidate 5′ end also identified from deep sequencing at or within a few nucleotides, supported by ≤10 reads in library I and excluded from Table 2.
Candidate 3′ end also identified from deep sequencing at or within a few nucleotides, and included in Table 2.
Of the four 5′ ends assessed by ExactSTART, those for ORF25 and ORF126 are located at or very close to the positions determined by deep sequencing. The 5′ end for ORF100 was not identified by deep sequencing, and that for ORF43 did not match, perhaps because the RACE product analyzed was a result of PCR mispriming. The five 3′ ends assessed by ExactSTART are located very close to the positions determined by deep sequencing. The 5′ ends of nine of the ORFs assessed by SMARTer RACE (ORF25, ORF29, ORF43, ORF51, ORF52, ORF97, ORF105, ORF115, and ORF126) are located very close to those determined by deep sequencing. Those of the other six (ORF18, ORF19, ORF59, ORF89as, ORF100, and ORF106) were not detected by deep sequencing. The SMARTer RACE experiments indicated that certain ORFs may have multiple 5′ ends. Some of these reflect the occurrence of multiple 5′ UTRs for certain ORFs, as discussed below. The possibility that others may also represent alternative, nonspliced 5′ ends rather than artifacts is suggested by their identification among the deep sequencing data (analysis not shown) but supported by ≤10 reads and, hence, they are not included in Table 2 (these occurrences are indicated in Table 3). In addition to indicating the locations of transcript ends, the RACE experiments also confirmed some of the splicing patterns identified by deep sequencing, this depending on the locations of the PCR primers.
The 3′ ends of four of the ORFs identified by SMARTer RACE (ORF42, ORF43, ORF59, and ORF126) are located very close to those mapped by ExactSTART and deep sequencing. The 3′ end of the poorly expressed ORF131 transcript [with a canonical poly(A) signal] was detected by SMARTer RACE but not by deep sequencing, thus bringing the total number of mapped poly(A) sites to 97 (not counting duplicates).
The locations of 5′ and 3′ ends are shown in Fig. 1, along with those of splice sites. The structures and sizes of intact RNAs may be inferred from this information but are not shown because they are not proven directly by the data.
Spliced AngHV1 genes.
Table 1 lists 11 ORFs that the analysis implied are expressed by splicing between protein-coding exons, ORF1, ORF6A, ORF10, ORF71, ORF90, ORF92A, ORF100, ORF112, ORF127, ORF131, and ORF134. Splicing has been predicted previously only for ORF10 and ORF100 (25). The pattern in ORF10 (which encodes the putative ATPase subunit of terminase) was confirmed, and that in ORF100 (which encodes a low-abundance capsid protein [27]), was extended by the confirmation of a previously predicted intron and the addition of another. Among the remaining ORFs, the proportion of spliced to unspliced transcripts is high (these may be estimated from the numbers of reads in data set S1 in the supplemental material [set III] representing the splice junction and donor and acceptor sites), but in ORF6A and ORF92A, it is not. ORF1 and ORF6A, which are located in the terminal direct repeat and, hence, are duplicated in the genome, were transcribed at low levels. The former incorporates the original ORF1 and ORF2 plus an additional exon, and the latter replaces the original ORF6 and ORF7, which are located on the complementary strand. The original ORF72 has been replaced by an extended, spliced version of ORF71 that is encoded on the complementary strand and specifies a virion type 1 membrane protein (27). ORF90, which encodes a nucleoside diphosphate kinase, was found to contain an intron. ORF92A is one of two additional genes introduced between ORF92 and ORF93, though, as mentioned above, most transcripts traversing the splice sites are not spliced. Despite this, the functional ORF92A protein is likely to be expressed by splicing, since the unspliced transcript lacks an ATG initiation codon and would not encode the type 1 membrane protein predicted to be specified by the spliced transcript. ORF112 was originally predicted to consist of a single exon encoding a protein related to chloride channel CLIC-like 1 protein (25) and has been extended by a second exon. ORF127 incorporates the original ORF127, ORF128, and ORF129, ORF131 the original ORF131, ORF132, and ORF133, and ORF134 the original ORF134 and ORF136, plus an exon that replaces ORF135 on the complementary strand.
Table 1 also lists nine ORFs that are expressed by splicing from additional exons at the 5′ ends of predicted protein-coding regions, ORF19, ORF29, ORF51, ORF52, ORF59, ORF83, ORF97, ORF100, and ORF106. In most instances, splicing patterns are complex, with multiple alternative 5′ exons spliced individually to the main protein-coding region, a phenomenon that is reminiscent of a number of human cytomegalovirus ORFs (7). Table 1 summarizes conclusions on whether particular alternative 5′ exons are likely to be protein coding (i.e., N-terminally extending the protein sequence) or noncoding (i.e., forming a 5′ UTR), assuming that translational initiation is restricted to in-frame ATG codons. The relative abundance of individual spliced transcripts can be estimated from the number of reads containing the relevant splice junctions listed in Table 1, and the relative abundance of unspliced transcripts can be estimated from the number of reads containing the unspliced acceptor sites (see data set S1, set III, in the supplemental material). The existence of splicing near the 5′ ends of ORFs does not rule out expression also occurring from unspliced transcripts, and indeed, this was confirmed for several ORFs. Below, we present detailed examples of splicing at the 5′ ends of three ORFs (ORF19, ORF51, and ORF52).
ORF19 encodes an abundant tegument protein (27) and is transcribed divergently with respect to ORF18 (Fig. 4A). ORF19 transcripts are 3′ coterminal with those of ORF20, and ORF18 transcripts are 3′ coterminal with those of ORF17 (Table 2). ORF19 is expressed in unspliced form and as three spliced forms (Tables 1 and 3 and Fig. 4A, transcripts u19 and s19-1 to s19-3). Transcript u19 would be translated into the full-length ORF19 protein. Trancript s19-1 is rare and would generate a truncated form of the ORF19 protein lacking the first 252 residues. Transcript s19-2 is abundant and would be translated into a form of the ORF19 protein in which residues 1 to 215 are replaced by 24 residues specified by a region antisense to the 5′ region of ORF18. Transcript s19-3 would be translated into a form of the ORF19 protein from which residues 29 to 215 are absent.
Fig 4.
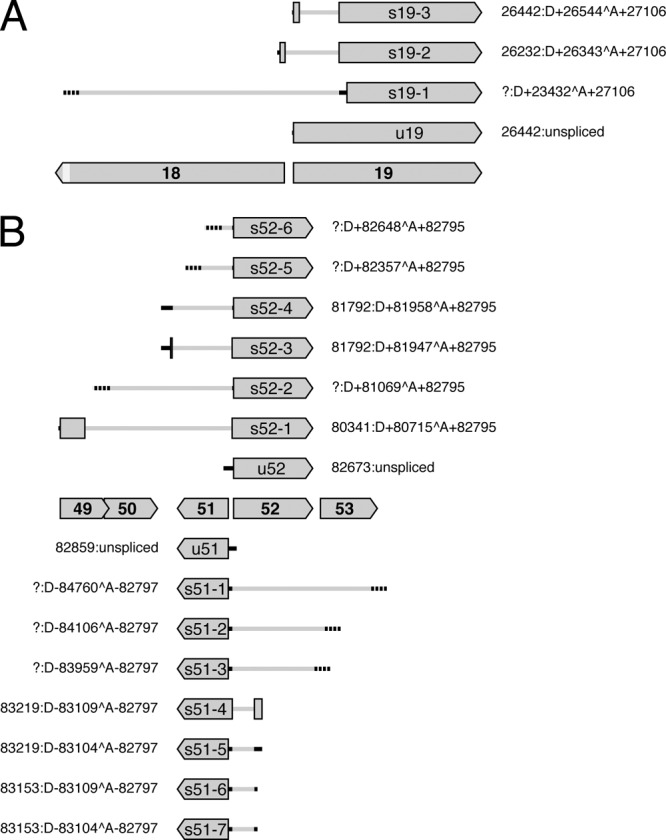
Diagram illustrating splicing patterns at the 5′ ends of ORF19 (A) and ORF51 and ORF52 (B) and their predicted effects on protein expression. Protein-coding regions are shaded gray, with names (lacking the ORF prefix) in bold type. ORF18 is shortened near its 3′ end, as depicted by the lighter gray shading. 5′ UTRs in unspliced transcripts (u19, u51, and u52) and spliced transcripts (s19-1 to s19-3, s51-1 to s51-7, and s52-1 to s52-6) are shown by solid or broken black lines, the former where 5′ ends were mapped and the latter where they were not. Introns are depicted as gray lines. Transcripts s19-2, s19-3, s51-4, s52-1, and s52-3 contain two protein-coding exons, whereas other transcripts contain one. Each set of coordinates indicates the location of the 5′ end (a question mark denotes lack of data), followed by the intron location or a description as unspliced. The 3′ regions of transcripts are not shown.
ORF51 encodes an abundant type 3 membrane glycoprotein (27) and is transcribed divergently with respect to ORF52 (Fig. 4B), which is conserved among alloherpesviruses (25). ORF51 transcripts terminate downstream from the protein-coding region, and ORF52 transcripts are 3′ coterminal with those of ORF53 (Table 2). ORF51 is expressed in unspliced form and as seven spliced forms (Tables 1 and 3 and Fig. 4B, transcripts u51 and s51-1 to s51-7). The unspliced RNA and six of the spliced transcripts (of which s51-1, s51-2, and s51-3 are rare) would be translated into the full-length ORF51 protein. Transcript s51-4 would generate a form of the ORF51 protein extended by 55 residues, 36 of which are encoded antisense to ORF52. ORF52 is expressed in unspliced form and as six spliced forms (Tables 1 and 3 and Fig. 4B, u52 and s52-1 to s52-6). The unspliced RNA and four of the spliced transcripts (of which s52-2, s52-5, and s52-6 are rare) would be translated into the full-length ORF52 protein. Transcript s52-1 would generate a form of the ORF52 protein extended by 123 residues, 116 of which correspond to the N terminus of the ORF49 protein. Transcript s52-3 is abundant and would generate a form of the ORF52 protein extended by 14 residues, 7 of which are encoded by the region between ORF50 and ORF51.
These examples indicate the potential complexity of protein expression by a subset of AngHV1 ORFs, with the examples of ORF19, ORF51, and ORF52 specifying at least four, two, and three forms differing in their N-terminal sequences.
Revision of the genetic map of AngHV1.
The analysis led to significant revisions of the map of predicted functional protein-coding regions in the AngHV1 genome, at length implying a total of 129 genes, 5 of which are duplicated in the terminal direct repeat (Fig. 1). This number does not take into account the effects of alternative splicing. As described above, corrections to sequencing errors affected 3 genes, 11 genes were redefined on the basis of splicing between protein-coding regions, and 4 previously unrecognized genes (ORF6A, ORF57.5, ORF92A, and ORF92B) were added. Reanalyses (not shown) of the mass spectrometry data from a previous study (27) did not identify ORF6A, ORF92A, or ORF92B as encoding virion proteins. Eleven previously annotated genes were deleted (ORF2, ORF6, ORF7, ORF9, ORF72, ORF128, ORF129, ORF132, ORF133, ORF135, and ORF136). In addition, the 5′ ends of 12 ORFs were amended, and information on predicted protein characteristics and functions was updated in the GenBank accession.
Concluding remarks.
Our analysis provides the first high-resolution view of poly(A) transcripts generated by an alloherpesvirus at a time during infection when virions are being produced. This will provide a firmer foundation for work on AngHV1 than was available solely from bioinformatic analysis of the genome sequence. One important finding is that splicing is more common in AngHV1 than had been predicted. In particular, it is possible that alternative expression patterns at the 5′ ends of several ORFs provide subtlety in transcriptional control and add to protein diversity. A similar situation pertains to human cytomegalovirus at this stage during infection (7).
Overall, the AngHV1 transcriptome profile closely matches the locations of predicted functional protein-coding regions. This is in contrast to mammalian herpesviruses, where RNAs that are predicted not to encode functional proteins contribute significantly (7, 10, 12, 14, 31, 32). Some of these apparently noncoding poly(A) RNAs occupy regions of the genome that are dedicated to their synthesis and are therefore likely to be functional. Others are transcribed antisense to recognized ORFs and, if functional, would indicate the dual use of genomic sequences. We found no examples of dedicated noncoding poly(A) RNAs in AngHV1, and antisense transcripts are rare. This finding possibly indicates that mammalian herpesviruses are functionally more complex than alloherpesviruses. The extent to which this is the case, especially in regard to antisense transcription, is a matter of great interest that remains to be elucidated.
Supplementary Material
ACKNOWLEDGMENTS
This study received financial support from the Dutch Ministry of Economic Affairs, Agriculture and Innovation and from the UK Medical Research Council.
We thank Ineke Roozenburg and Michal Voorbergen-Laarman (Central Veterinary Institute [CVI] of Wageningen UR) for technical assistance in cell and virus culture, José Harders-Westerveen (CVI) for technical assistance in cloning and sequencing, and Ruddy Wattiez for performing reanalyses of published mass spectrometry data from AngHV1 virions in light of the updated genome map.
Footnotes
Published ahead of print 11 July 2012
Supplemental material for this article may be found at http://jvi.asm.org/.
REFERENCES
- 1. Aoki T, et al. 2007. Genome sequences of three koi herpesvirus isolates representing the expanding distribution of an emerging disease threatening koi and common carp worldwide. J. Virol. 81:5058–5065 [DOI] [PMC free article] [PubMed] [Google Scholar]
- 2. Chen SN, Ueno Y, Kou GH. 1982. A cell line derived from Japanese eel (Anguilla japonica) kidney. Proc. Natl. Sci. Counc. Repub. China B 6:93–100 [Google Scholar]
- 3. Davison AJ. 1992. Channel catfish virus: a new type of herpesvirus. Virology 186:9–14 [DOI] [PubMed] [Google Scholar]
- 4. Davison AJ, Cunningham C, Sauerbier W, McKinnell RG. 2006. Genome sequences of two frog herpesviruses. J. Gen. Virol. 87:3509–3514 [DOI] [PubMed] [Google Scholar]
- 5. Davison AJ, Davison MD. 1995. Identification of structural proteins of channel catfish virus by mass spectrometry. Virology 206:1035–1043 [DOI] [PubMed] [Google Scholar]
- 6. Dishon A, Davidovich M, Ilouze M, Kotler M. 2007. Persistence of cyprinid herpesvirus 3 in infected cultured carp cells. J. Virol. 81:4828–4836 [DOI] [PMC free article] [PubMed] [Google Scholar]
- 7. Gatherer D, et al. 2011. High-resolution human cytomegalovirus transcriptome. Proc. Natl. Acad. Sci. U. S. A. 108:19755–19760 [DOI] [PMC free article] [PubMed] [Google Scholar]
- 8. Haenen OLM, et al. 2002. Herpesvirus anguillae (HVA) isolations from disease outbreaks in cultured European eel, Anguilla anguilla in the Netherlands since 1996. Bull. Eur. Assoc. Fish Pathol. 22:247–257 [Google Scholar]
- 9. Haenen OLM, et al. 2010. The health status of European silver eels, Anguilla anguilla, in the Dutch River Rhine Watershed and Lake IJsselmeer. Aquaculture 309:15–24 [Google Scholar]
- 10. Hitt MM, et al. 1989. EBV gene expression in an NPC-related tumour. EMBO J. 8:2639–2651 [DOI] [PMC free article] [PubMed] [Google Scholar]
- 11. Huang S, Hanson LA. 1998. Temporal gene regulation of the channel catfish virus (Ictalurid herpesvirus 1). J. Virol. 72:1910–1917 [DOI] [PMC free article] [PubMed] [Google Scholar]
- 12. Johnson LS, Willert EK, Virgin HW. 2010. Redefining the genetics of murine gammaherpesvirus 68 via transcriptome-based annotation. Cell Host Microbe 7:516–526 [DOI] [PMC free article] [PubMed] [Google Scholar]
- 13. Kunec D, Nanduri B, Burgess SC. 2009. Experimental annotation of channel catfish virus by probabilistic proteogenomic mapping. Proteomics 9:2634–2647 [DOI] [PubMed] [Google Scholar]
- 14. Lacaze P, et al. 2011. Temporal profiling of the coding and noncoding murine cytomegalovirus transcriptomes. J. Virol. 85:6065–6076 [DOI] [PMC free article] [PubMed] [Google Scholar]
- 15. Li H, Ruan J, Durbin R. 2008. Mapping short DNA sequencing reads and calling variants using mapping quality scores. Genome Res. 18:1851–1858 [DOI] [PMC free article] [PubMed] [Google Scholar]
- 16. Michel B, et al. 2010. The genome of cyprinid herpesvirus 3 encodes 40 proteins incorporated in mature virions. J. Gen. Virol. 91:452–462 [DOI] [PubMed] [Google Scholar]
- 17. Milne I, et al. 2010. Tablet—next generation sequence assembly visualization. Bioinformatics 26:401–402 [DOI] [PMC free article] [PubMed] [Google Scholar]
- 18. Pellett PE, et al. 2011. Herpesvirales, p 99–107 In King AMQ, Adams MJ, Carstens EB, Lefkowitz EJ. (ed), Virus taxonomy, ninth report of the International Committee on Taxonomy of Viruses. Elsevier Academic Press, London, United Kingdom [Google Scholar]
- 19. Rosenkranz D, et al. 2008. Identification of envelope protein pORF81 of koi herpesvirus. J. Gen. Virol. 89:896–900 [DOI] [PubMed] [Google Scholar]
- 20. Sano M, Fukuda H, Sano T. 1990. Isolation and characterization of a new herpesvirus from eel. In Perkins FO, Cheng TC. (ed), Pathology in marine sciences, 1st ed, p 15–31 Academic Press, San Diego, CA [Google Scholar]
- 21. Silverstein PS, Bird RC, van Santen VL, Nusbaum KE. 1995. Immediate-early transcription from the channel catfish virus genome: characterization of two immediate-early transcripts. J. Virol. 69:3161–3166 [DOI] [PMC free article] [PubMed] [Google Scholar]
- 22. Silverstein PS, van Santen VL, Nusbaum KE, Bird RC. 1998. Expression kinetics and mapping of the thymidine kinase transcript and an immediate-early transcript from channel catfish virus. J. Virol. 72:3900–3906 [DOI] [PMC free article] [PubMed] [Google Scholar]
- 23. Stingley RL, Gray WL. 2000. Transcriptional regulation of the channel catfish virus genome direct repeat region. J. Gen. Virol. 81:2005–2010 [DOI] [PubMed] [Google Scholar]
- 24. Stingley RL, Griffin BR, Gray WL. 2003. Channel catfish virus gene expression in experimentally infected channel catfish, Ictalurus punctatus (Rafinesque). J. Fish Dis. 26:487–493 [DOI] [PubMed] [Google Scholar]
- 25. van Beurden SJ, et al. 2010. Complete genome sequence and taxonomic position of anguillid herpesvirus 1. J. Gen. Virol. 91:880–887 [DOI] [PubMed] [Google Scholar]
- 26. van Beurden SJ, et al. 2011. The alloherpesviral counterparts of interleukin 10 in European eel and common carp. Fish Shellfish Immunol. 31:1211–1217 [DOI] [PubMed] [Google Scholar]
- 27. van Beurden SJ, et al. 2011. Identification and localization of the structural proteins of anguillid herpesvirus 1. Vet. Res. 42:105. [DOI] [PMC free article] [PubMed] [Google Scholar]
- 28. van Beurden SJ, et al. 2011. Development and validation of a two-step real-time RT-PCR for the detection of eel virus European X in European eel, Anguilla anguilla. J. Virol. Methods 171:352–359 [DOI] [PubMed] [Google Scholar]
- 29. Vanderheijden N, Hanson LA, Thiry E, Martial JA. 1999. Channel catfish virus gene 50 encodes a secreted, mucin-like glycoprotein. Virology 257:220–227 [DOI] [PubMed] [Google Scholar]
- 30. van Nieuwstadt AP, Dijkstra SG, Haenen OLM. 2001. Persistence of herpesvirus of eel Herpesvirus anguillae in farmed European eel Anguilla anguilla. Dis. Aquat. Organ. 45:103–107 [DOI] [PubMed] [Google Scholar]
- 31. Xu Y, Ganem D. 2010. Making sense of antisense: seemingly noncoding RNAs antisense to the master regulator of Kaposi's sarcoma-associated herpesvirus lytic replication do not regulate that transcript but serve as mRNAs encoding small peptides. J. Virol. 84:5465–5475 [DOI] [PMC free article] [PubMed] [Google Scholar]
- 32. Zhang G, et al. 2007. Antisense transcription in the human cytomegalovirus transcriptome. J. Virol. 81:11267–11281 [DOI] [PMC free article] [PubMed] [Google Scholar]
Associated Data
This section collects any data citations, data availability statements, or supplementary materials included in this article.