

Abstract
Most bacteria live in the form of adherent communities forming three-dimensional material anchored to artificial or biological surfaces, with profound impact on many human activities. Biofilms are recognized as complex systems but their physical properties have been mainly studied from a macroscopic perspective. To determine biofilm local mechanical properties, reveal their potential heterogeneity, and investigate their relation to molecular traits, we have developed a seemingly new microrheology approach based on magnetic particle infiltration in growing biofilms. Using magnetic tweezers, we achieved what was, to our knowledge, the first three-dimensional mapping of the viscoelastic parameters on biofilms formed by the bacterium Escherichia coli. We demonstrate that its mechanical profile may exhibit elastic compliance values spread over three orders of magnitude in a given biofilm. We also prove that heterogeneity strongly depends on external conditions such as growth shear stress. Using strains genetically engineered to produce well-characterized cell surface adhesins, we show that the mechanical profile of biofilm is exquisitely sensitive to the expression of different surface appendages such as F pilus or curli. These results provide a quantitative view of local mechanical properties within intact biofilms and open up an additional avenue for elucidating the emergence and fate of the different microenvironments within these living materials.
Introduction
Biofilms constitute a widespread bacterial lifestyle and their development on natural and man-made surfaces have a profound impact on many human activities (1). In addition to having positive roles in bioprocess engineering, such as wastewater treatment and soil bioremediation, bacterial biofilms formed on industrial surface or in-dwelling medical devices are difficult to eradicate and therefore cause severe nuisances. In addition to these practical issues, development of three-dimensional biofilm structures also raises exciting fundamental questions. Indeed, biofilms exhibit several distinct features compared to planktonic cell populations like gene expression and bacterial metabolisms' alteration or transient multifactorial tolerance to most biocides (2). Hence, understanding and controlling the mechanisms underlying the emergence of biofilm-specific properties is a significant socio-economic issue and a major focus of contemporary fundamental microbiology.
In this context, several groups have recognized the importance of a relevant description of biofilm mechanical properties and have implemented various approaches, including the following: observation of biofilm streamer deformation as a function of fluid flow rates (3,4), uniaxial compression of biofilm fragments (5,6), shear of biofilm collected from the environment and then transferred to a parallel plate rheometer (7,8), atomic force spectroscopy using a glass bead and coated with a bacterial biofilm attached to an AFM cantilever (9), and a dedicated microcantilever method for measuring the tensile strength of detached biofilm fragments (10,11). Results indicated that biofilms are viscoelastic liquids or solids, depending on the amplitude of the applied stress and on the timescale of the experiment. These approaches provided a better understanding of biofilm macroscopic response to external stress. However, due to the variety of technical approaches and experimental conditions, values for biofilm elastic modulus or viscosity differed by several orders of magnitude. Moreover, very few studies have investigated the link between biofilm physical parameters and molecular properties expressed by biofilm microorganisms, and no clear conclusion has emerged. Contradictory results are reported concerning the effects of bacterial surface lipopolysaccharides on biofilm stiffness (9,12).
Above all, although biofilms are characterized by remarkable temporal and spatial heterogeneity in terms of biomass distribution, chemical and molecular gradients, and division rates (13–15), there are almost no data on spatial mapping of intact biofilm mechanical properties. Furthermore, many results were obtained on biofilm fragments or on biofilms removed from their native developing environment, which very likely caused blurring of information on intact biofilm properties. As a consequence, the impact of physical parameters encountered by bacteria on biofilm development and properties is currently unknown.
Here we present a microrheology study designed to measure bacterial biofilm mechanical properties at the micron scale in order to reveal spatial distribution of biofilm viscoelastic parameters. For this purpose, we developed a strategy for sowing micrometric magnetic particles in growing biofilms formed by an Escherichia coli bacterium expressing F-conjugative pili adhesion factors. We then built dedicated magnetic tweezers to remotely actuate the particles within the biofilm. Using this additional tool, we carried out three-dimensional mapping of the viscoelastic parameters of E. coli biofilms grown under different conditions and studied the influence of a defined molecular factor expressed by biofilm upon the mechanical profile using a different strain of E. coli constitutively expressing curli, an adhesion factor.
Our results therefore provide, to our knowledge, the first realistic and quantitative view of local mechanical properties at the micron scale within intact biofilms and pave the way for examining the link between biofilm mechanical and molecular properties.
Materials and Methods
Bacterial strains and growth conditions
Bacterial strain MG1655gfpF carries a derivative of the F-conjugative plasmid (F′tet) and produces F pili at its surface. Constitutive curli producers (MG1655gfpompR234) were obtained by transducing, into gfp-tagged MG1655, the ompR234 mutation as in Vidal et al. (16). Both strains were grown in lysogeny broth medium and in defined M63B1 medium with 0.4% glucose (M63B1Glu) in the presence of ampicillin at 100 μg/mL or tetracycline 7.5 μg/mL at 37°C or 30°C for curli experiments.
Biofilm growth and particle insertion
Biofilms were grown in a flow chamber made of a glass (borosilicate) square, 800-μm internal-side and 160-μm wall-thickness capillaries (Composite Metal Services, Shipley, UK), under continuous flow using a syringe push-pull pump. Flow rates were kept between 0.1 and 5 mL/h to generate a laminar flow (Reynolds number <2) and wall shear stress was kept between 4.4 × 10⁻⁴ and 2.2 × 10⁻² Pa. Exponentially growing bacteria were introduced at optical density, OD = 0.05, at the same time as the magnetic particles (Dynabeads M-270 Amine; Invitrogen, Carlsbad, CA), 2.8 μm in diameter at a final concentration of 2.5 × 10⁶/mL. The mixed suspension was allowed to sediment under static conditions for 1 h before starting the flow for the entire growth period.
Magnetic tweezers
The magnetic setup consisted of two magnetic poles, each made of a copper coil with 2120 turns of 0.56 mm in diameter copper wire and soft magnetic alloy cores (Supra 50; ArcelorMittal, Strasbourg, France). We shaped square poles instead of pointed ones to avoid excessive concentration of the field lines and maintain an almost constant field gradient in the zone of particle actuation. The two cores were mounted on an inverted TE-300 microscope (Nikon, Melville, NY) with a 1.7-mm gap, north pole facing south pole, to generate a magnetic force in one direction along the length of the capillary. The experimental setup is shown in Fig. 1 A. The coil current was produced by a function generator (33210A; Agilent Technologies, Massy, France) and a homemade power amplifier giving a current signal with amplitudes up to 4 A. The effective magnetic field yielded by the poles was controlled using a Hall magnetometer (AlphaLab USA, Salt Lake City, UT).
Figure 1.
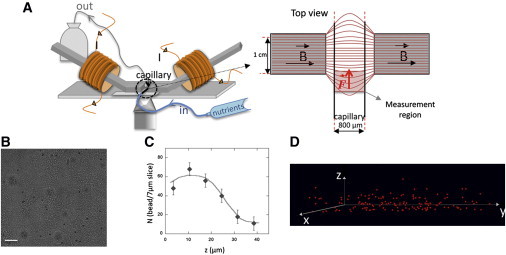
Magnetic setup and magnetic particle distribution. (A) Schematic of the magnetic tweezers mounted on the microscope stage on each side of the biofilm growth capillary continuously supplied in nutrients. (Top view) Geometry of the measuring unit with the schematic representation of the field lines and the measurement region. (B) Bright-field microscope image of an F+ biofilm 1 mL/h, 24 h growth seeded with particles; z = 26.5 μm from the bottom slide; bar is 20 μm. (C) Particle distribution in a biofilm volume (700 × 200 × 40 μm3). (D) Three-dimensional view of the particle distribution in the region of analysis.
Force calibration
In order to determine the absolute force acting on the beads embedded in the biofilm, we measured the velocity of beads dispersed in a purely viscous mixture of glycerol and water (39.8 g in 200 μL water). We derived the force from Stokes' law neglecting the inertia of the particles and checked linear dependence between force and current indicating full magnetization of the bead. To take in account the variation in the force with the distance to the poles, we recorded particle trajectories in the entire volume of interest in the capillary, and stored the velocities with their coordinates (xi,yi,zi) in a calibration file of 8000 entries, which was used to derive viscoelastic parameters from particle displacement curves in the biofilm. For any given particle, we determined the local applied force by averaging velocities stored in the calibration file for a 25-μm-side virtual cube centered on coordinates of the particle of interest. On this length scale, the force standard deviation was found to be equal to 10–12%, which took into account the error in particle size. The viscosity was measured in parallel with a rheometer at the same temperature and found to be very stable—the standard error on the measurements was <1%. The amplitude of force in the zone of interest varied from 29 pN in microvolumes most distal from the poles at the center of the capillary to 104 pN at the side walls of the capillaries near the pole pieces (see Fig. S1 in the Supporting Material).
Using 1-μm diameter nonmagnetic beads (Fluoresbrite 18660; Polysciences, Eppelheim, Germany) dispersed in the biofilm at the same time as the magnetic particles, we checked that the displacement field generated by local forces on the magnetic particles induced no motion of the nonmagnetic particles at distances >10 μm (data not shown).
Imaging and particle tracking
Particles in biofilm were imaged in the capillary using an S-Fluor ×40 objective (NA 0.9, WD 0.3; Nikon). The microscope image was recorded by an electron-multiplying charge-coupled device camera (C 9100-02; Hamamatsu Photonics, Massy, France). Particles were imaged using their large-spectrum intrinsic fluorescence signal (filters Exc:540/25 nm; DM:565; Em:605/55). To monitor particle motion upon magnetic force application, image sequences were recorded at a frequency of 30 Hz over a period of 20 s and further analyzed using an ImageJ particle tracker (National Institutes of Health, Bethesda, MD), as developed by Sbalzarini and Koumoutsakos (17), that yielded particle trajectories from which individual particle creep curves giving material strain versus time could be plotted. The error made on the particle position was evaluated by monitoring the position of resting beads and found to be equal to 0.02 μm.
Confocal microscope images were obtained as described in the legend to Fig. S11.
Creep curve analysis
Material compliance was derived from particle motion using the strain-stress relation previously established for a probe particle of radius R embedded in an incompressible, homogeneous viscoelastic medium (18), which gives the time-dependent creep compliance of the network J(t) (equal to the reciprocal macroscopic shear modulus), knowing probe deflection d(t) and applied force ƒ as
| (1) |
Next, we extracted viscoelastic moduli by fitting the creep curves to the time-dependent viscoelastic behavior of Burger's model—an equivalent mechanical circuit made of a spring and a dashpot combined in parallel and a second spring and dashpot added in series—as classically done to quantify viscoelastic materials, but also more complex and biological polymers rheological properties (19,20). Upon constant force, ƒ, this element combination exhibits a three-regime mechanical response: fast elastic, viscoelastic relaxation, and a viscous regime (shown in Fig. S2 B) with a unique analytical solution as
| (2) |
where J0 is elastic instantaneous compliance, τ is the relaxation time required for the transition from the elastic to the viscous regime, J1 gives the amplitude of elastic relaxation, and η0 measures the effective viscosity of the material. Curve fitting was performed using a nonlinear least-mean-square algorithm; accuracy in adjustment was checked using a bootstrap method. Noise at the bead position was evaluated at 0.01 μm, and represented the main source of error in the determination of the rheologic parameters from the creep curves.
Boundary conditions were evaluated using the theoretical approach of Perkins and Jones (21,22) for both hard wall and free surface effects. The correction function g(z) was calculated to the fifth order and taken into account to correct particle velocity in the capillary in the limit of 20% correction, i.e., from 4 μm from the bottom of the capillary to 3 μm from the free surface (see Fig. S3). Particles located outside of these limits were not taken into account in the analysis.
Results
Micrometric magnetic particle distribution within growing E. coli biofilm
We began the experiments using an F pilus-producing E. coli strain known to develop mature biofilms in flow cells (23). Biofilm growth was initiated by introducing a mixed suspension of exponentially growing bacteria and magnetic particles in the capillary mounted on our microrheology setup (Fig. 1 A). A typical magnetic probe spatial distribution in such a biofilm, grown for 24 h under continuous feeding at a flow of 1 mL/h, is shown in Fig. 1, B–D, for a biofilm average thickness of 45 μm. The particles initially adhering to the capillary bottom detached after 3–4 h biofilm growth (see Movie S1 in the Supporting Material). As biofilm thickened with cell division, the particles were randomly transported and distributed throughout the entire biofilm volume. Particles were found at all biofilm depths, although the upper layers were less concentrated than the rest of the volume (Fig. 1 C). Particle initial concentration was chosen to obtain an average distance between the particles equal to 30 μm after 24 h growth of the biofilm in order to avoid near-neighbor interactions. However, particle spatial distribution was not fully homogeneous, and due to density fluctuations, two particles were sometimes found very close to one another. In this case, they were not taken into account in the analysis.
Local mechanics of F pilus-producing E. coli biofilm is dominated by elastic deformation
At the stage of growth and particle distribution reached after 24 h, magnetic tweezers are used to apply a 16 s force step of amplitude comprised between 30 and 100 pN depending on the coordinates of the particle in the capillary. In response to this force, each individual particle embedded in the biofilm undergoes a deflection recorded versus time, providing a creep curve from which we extract the viscoelastic parameters. Interestingly, particle displacements reported different local mechanical environments, as shown in Fig. 2 and Fig. S2.
Figure 2.
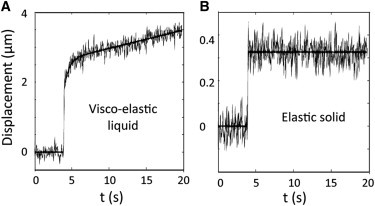
Mechanical behaviors in biofilm. Experimental points and fit of two typical creep compliances found in an F pilus biofilm grown for 24 H at 1 mL/h nutrients flow. (A) Viscoelastic liquid with viscoelastic relaxation and (B) elastic solid environment. Curve-fitting was performed using a nonlinear least-mean-square algorithm. The error on the adjustment was evaluated using a bootstrap method and found equal to 0.01 (N/m2)−1. The overall range of behaviors (and their occurrence) is presented in Fig. S2.
To check the linearity of the viscoelastic response, creep curves were recorded successively on the same particle at applied forces ranging from 20 to 100 pN. We obtained homothetic curves demonstrating our measurements were actually performed in the linear regime—superimposed creep curves were obtained when the same force was applied successively on the same particle (see Fig. S4). Deflection curves were converted into compliance curves using force calibration data and function g(z) accounting for boundary conditions (see Fig. S3). Then, for the sake of homogeneity, we adjusted all creep curves using the same analytical framework given by Burger's model—a mechanical equivalent circuit that provides four parameters: elastic compliance, J0; relaxation time, τ; viscosity, η0; and the amplitude of elastic relaxation, J1 (see Fig. S2 B). Only those parameters with values at least twice as high as the noise were retained.
Thus, viscoelastic liquid behavior was characterized by a four-parameter set (J0, J1, τ, η0) (Fig. 2 A), while a purely elastic response, as in Fig. 2 B, was characterized by only one parameter J0—J1, with τ and η0 values yielded by Burger's adjustment being, in the latter case, too small to be considered in the analysis. Based on these parameter sets, particle mechanical responses were sorted into four different mechanical behaviors—viscoelastic liquid with, or without, short-time relaxation (see Fig. S2 A, charts 1 and 4); viscoelastic solid (see Fig. S2 A, chart 3); and elastic solid (see Fig. S2 A, chart 2). A total of 20% of the beads displayed no measurable deflection (see Fig. S2 A, chart 5); their mechanical environment is hereafter referred to as a rigid environment. The entire behavior was dominated by elastic compliance, which supported the major part of material deformation (see Fig. S2, C and D) and exhibited the widest spread of values. Although, in 75% of cases, effective fluid viscosity comprised between 20 and 2000 Pa.s was measured, the associated viscous deformation generally remained lower than that of elastic at the scale of the experiment—as evaluated via derivation of an equivalent compliance tc/η0, which reflected the viscous flow-induced strain after a time of creep tc (see Fig. S2 C). We then primarily examined J0 value spatial distribution.
Mapping of local compliance reveals biofilm mechanical heterogeneity
For a given F pilus-producing E. coli biofilm grown under reference conditions, i.e., 37°C, 1 mL/h growth flow for 24 h, J0 values reported by ∼200 beads differed by >2 orders of magnitude from locus to locus in the same biofilm, while the maximal error on the measurement was equal to 20%. In order to specify the degree of this heterogeneity, we examined more closely the distribution of J0 values. We first normalized the J0 distribution with its ensemble-average to focus on the parameters characterizing the distribution independently of the mean and to evaluate the degree of heterogeneity in comparison with other biomaterials (24–26).
In addition, normalized distribution of the compliance values obtained in glycerol (only viscous contribution as expected) was taken as a control distribution for a mechanically homogenous material as already described in the work of Apgar et al. (24). Median, variance, and skewness derived from the normalized distributions are shown in Table 1 (see normalized distributions themselves in Fig. S5). Parameters derived from experiments in glycerol were very close to what is expected from a normal distribution with a small variance (<0.1) indicating a narrow range of values, a small skewness, and a median equal to unit showing up the symmetry of the distribution consistently with the homogeneity of the medium. In contrast, the normalized distribution of J0 from an F-pilus-expressing biofilm exhibited high variance and skewness reflecting the large scale of values recorded and the high asymmetry of biofilm compliance value distribution. Median was found equal to 0.5, indicating a significant contribution of the most rigid environments to the whole material despite the large positive skewness of the distribution. Maximal normalized compliance values >10 were observed as in the case of the most heterogeneous actin gels obtained by Apgar et al. (24) and Tseng and Wirtz (25) at high monomer concentration in the presence of cross-linkers.
Table 1.
Statistical parameters extracted from the normalized distribution of the creep curve parameters (η0 and J0) in E. coli-expressing F pilus biofilm and homogeneous solution of glycerol 10% water w/w
| Material | Median | Variance | Skewness |
|---|---|---|---|
| F pilus biofilm | 0.5 ± 0.06 | 2.4 ± 0.1 | 3.6 ± 0.1 |
| Glycerol | 0.99 ± 0.005 | 0.04 ± 0.002 | 0.29 ± 0.04 |
Values given are mean ± standard error.
To our knowledge, this constitutes the first signature of material mechanical heterogeneity. When examining J0 value distribution in the three dimensions of the biofilm, we found sharp dependence on the distance-to-vertical boundaries of the particle (z position), whereas the distribution was wide but invariant across the width (x position) and length of the capillary (y position) (Fig. 3). The entire data collection provides a mechanical description according to three vertically stratified zones, this formal description implying no net physical limit between the layers. The lower zone, extending at ∼10-μm thickness close to the adhesive surface, displayed the highest rigidity (low compliance values) and narrowest distribution of the values (normalized distribution variance and skewness equal to 0.7 ± 0.1 and 0.66 ± 0.05, respectively). The median zone, which extended over 20 μm under reference conditions, exhibited the total range of compliances measured in the biofilm, with a wide value distribution (normalized distribution variance and skewness equal to 1.5 ± 0.1 and 2.6 ± 0.1, respectively) (see Fig. S6), indicating that highly rigid and very soft environments coexisted in this intermediate layer of the biofilm. Although the third upper layer, of ∼15-μm thickness, was usually rather poorly populated in particles, it was clearly characterized by the absence of the most rigid environment and thus a higher average elasticity than the rest of the material. Yet the compliance values in this superficial slice differed at times by more than an order of magnitude from point to point on the same plane.
Figure 3.
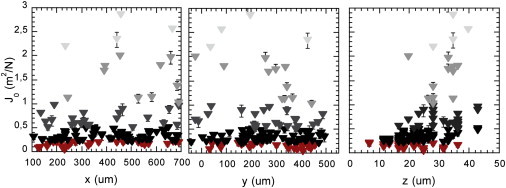
Spatial distribution of elastic compliance J0 in three-dimensional biofilm. F pilus biofilm grown at 37°C under 1 mL/h nutrient flow after 24 h. Compliance values reported by each particle are represented according to the three dimensions of the biofilm—width, length, and depth (left to right). Symbol colors give the compliance ranges: 0.005–0.2 m2/N (red); 0.2–0.5 m2/N (black); 0.5–1 m2/N (dark gray); 1–2 m2/N (medium gray); and >2 m2/N (light gray). Error bars are mean ± SE.
Viscosity and delayed elastic compliance followed the same z-dependent trend as J0, although the spread of the values was lower (see Fig. S7). The viscoelastic relaxation characterized by τ (in 55 ± 3% of the cases) did not exhibit any oriented spatial distribution. We also observed that viscoelastic moduli were weakly correlated with each other, showing a correlation coefficient close to 0.7 (0.74 for J0 vs. 1/η0; 0.78 for J1 vs. J0; 1/η0 vs. J1), which suggests that the different mechanical behaviors might have multifactorial molecular origins (see Fig. S8).
Thus, the mechanical signature of an F pilus-producing E. coli biofilm grown for 24 h under 1 mL/h nutrient flow held a three-layer profile across the biofilm thickness, with a rheological behavior dominated by an elastic response the amplitude of which extended over two orders of magnitude. In addition, this biofilm exhibited a high degree of mechanical heterogeneity characterized by compliance distributions of large variance and skewness.
Biofilm growth conditions impact mapping of its viscoelastic properties
To evaluate the versatility of the mechanical profile evidenced above in a given situation, we varied growth conditions and mapped viscoelastic parameters as above.
We first increased the growth period. Fig. 4 shows vertical distribution of elastic compliance (J0) for an F pilus-producing E. coli biofilm grown for 48 h with a similar biofilm grown for only 24 h. As expected, the 48 h biofilm thickness was higher—particles were found up to 80 μm compared to 45 μm for the 24 h biofilm. Considering the range and spread of the values, the J0-value general z-profile of the 48 h biofilm was fairly similar to that of the 24 h biofilm. We also found three-layer division across the thickness of the material, but with a net increase in the lower rigid zone, which extended to 25–30 μm for the 48 h biofilm compared to 10 μm for the 24 h biofilm. The intermediate, most heterogeneous zone occupied a 25-μm height, as was the case for the 24 h biofilm. The upper layer, softer and rather poor in particles, similarly extended over 15 μm. This suggests that this F pilus-producing E. coli biofilm matures by extension of its rigid basis, maintaining the heterogeneous softer superficial layers at the interface with the fluid.
Figure 4.
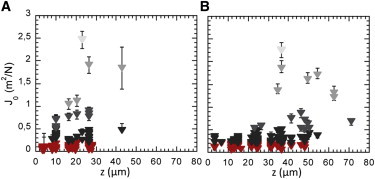
Spatial distribution of elastic compliance J0 evolution with age of the biofilm. The z-depth dependence is shown for an F pilus biofilm grown at 37°C under 1 mL/h nutrient flow for 24 h (A) and 48 h (B). Details as in Fig. 3.
Next, we changed the shear stress applied to the biofilm by changing the growth flow. Fig. 5 shows the compliance profile across the height of an F pilus-producing E. coli biofilm grown for 24 h at 0.1, 1, and 5 mL/h. The growth flow rates strongly affect biofilm mechanical properties. The highest flow (5 mL/h) rate produced a biofilm exhibiting high rigidity characterized by a mean value of 0.06 N/m2 and a sharp compliance value distribution (normalized distribution variance and skewness equal to 0.27 ± 0.04 and 0.68 ± 0.05, respectively). Only the superficial layer showed higher compliance values, up to 1 N/m2. In contrast, the biofilm grown at 0.1 mL/h exhibited greater and more widely distributed compliance (mean value equal to 0.56 and normalized distribution variance and skewness equal to 1.05 ± 0.1 and 2.9 ± 0.1, respectively) throughout the entire biofilm thickness, with no clear-cut difference between the bottom and top of the structure. Yet it should be mentioned that these low-flow-grown biofilms were usually thinner than biofilms grown at higher flow rates. It is interesting to note that these flow rates, from 5 mL/h to 0.1 mL/h, corresponded to low shear stresses in the range of 3 × 10⁻⁴ N/m2 to 2 × 10⁻² N/m2—i.e., much lower than the material cohesion strength inferred from compliance values. These results suggested the production of a biological response to increasing shear stress, leading to an increase in biofilm rigidity.
Figure 5.
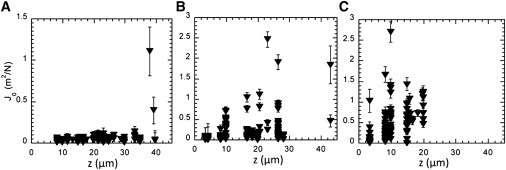
Spatial distribution of the elastic compliance J0 depends on shear stress. The z-depth dependence is shown for an F pilus biofilm grown at 37°C for 24 h under three different nutrient flows (A) 5 mL/h; (B) 1 mL/h; and (C) 0.1 mL/h. Details as in Fig. 3.
Adhesin expression strongly affects the biofilm mechanical profile
Several bacterial adhesins are known to promote E. coli biofilm development. In order to evaluate whether these proteinaceous structures affect the biofilm mechanical profile, we analyzed the spatial distribution of mechanical properties in a biofilm built by E. coli cells constitutively producing another adhesin than the F pilus. Fig. 6 and Fig. S9 show the distribution of compliance values for biofilms formed by an E. coli strain constitutively expressing curli appendages after 24 h at 1 mL/h. The biofilm was grown either at 37°C, for the sake of comparison with F+ biofilms, or at 30°C to foster curli expression. Both compliance profiles were drastically different from that exhibited by a biofilm grown under the same conditions by cells producing F pilus. Average compliance values were found equal to 0.08 and 0.02 N/m2 at 30 and 37°C, respectively (versus 0.23 N/m2 for an F pilus-producing biofilm at 37°C).
Figure 6.

Curli-induced spatial distribution of elastic compliance J0. The z-depth dependence is shown for a curli biofilm under 1 mL/h nutrient flow at 30°C for 24 h. Details as in Fig. 3.
The decrease in mean values was also accompanied by reduced spreading of the values (normalized distribution variance and skewness equal to 0.4 ± 0.05 and 0.63 ± 0.06, respectively at 30°C; see also the Supporting Material and Fig. S10). In contrast to the three-layer compliance profile obtained for F pilus-producing biofilm, no clear-cut variation in compliance across the biofilm was observed with only a slight decrease in the mean value calculated per individual plane with the distance to the bottom of the capillary. Biofilms grown at 37° and 30°C displayed similar general compliance profiles, but biofilms grown at 30°C, a temperature that induces maximal curli expression, was stiffer than that grown at 37°C, suggesting that increasing the amount of curli in the biofilm induces stiffening of the material.
To evaluate whether the drastic increase in the biofilm stiffness induced by curli expression was correlated with an increase in cell density (potentially driven by the ability of curli-expressing cells to strongly self-associate (27)), we acquired confocal microscope image stacks on curli and F-pilus-expressing biofilms grown for 24 h with or without particles under the same conditions as those used for mechanical parameter determination. We imaged both cell and particle fluorescence. Only the lowest layers (<15 μm) of the biofilm could be imaged due to the strong screening effect produced by the dense material upon both exciting and emitted light and to the reduction of GFP fluorescence in 24 h biofilms. However, the images enabled good qualitative description of the cell biomass distribution. Surprisingly, curli-expressing biofilm displayed less compact architecture, exhibiting a structure made up of cell clusters and holes whereas F pilus biofilms showed a more even biomass texture (see Fig. S11 and Fig. S12). The images also revealed that the two strains differentially colonized the substrate that was completely covered with cells in the case of F-pilus-expressing biofilm and exhibited almost half the surface free of cells with curli-expressing biofilm even after 24 h growth of a 40- to 50-μm-high biofilm. These experiments also showed that the presence of the magnetic particles did not affect the general biofilm organization. Results clearly indicated that biofilm mechanics was not directly correlated with cell density.
Discussion
Despite similarities with artificial soft matter, bacterial biofilms are not conventional complex fluids (28). Their specific organization and consequent properties, which develop through attachment and growth, are expected to be destroyed when biofilms are scraped or removed from their initial anchoring. To uncover biofilm native properties and local heterogeneities, we devised a unique in situ approach, thereby conserving material integrity.
We describe here the experimental setup enabling the first—to our knowledge—active microrheology measurements within biofilms. To the best of that knowledge, the only previous attempt to probe intact biofilm local mechanical properties was the work of Rogers et al. (29), whose analysis relied on thermally driven motion of the cells themselves, used as mechanical noninvasive probes. Although the technique detected different rheological environments of individual bacteria across the biofilm, the approach was hindered by biofilm self-dynamics. Mathias and Stoodley (30) recently introduced a digital image correlation method for analyzing biofilm natural image texture that is intrinsically noninvasive, but it does not address the three-dimensional heterogeneity of the structure. We overcame these difficulties by devising additional tools based on insertion into the biofilm of magnetic probes that self-distribute in the living material throughout growth of the structure. Their remote actuation using appropriate magnetic tweezers enables active three-dimensional mapping of biofilm mechanical properties.
Our approach, nonetheless, has three limitations:
First, magnetic remote actuation of colloidal probes has an intrinsic range of accessible forces given by the pole-particle distance, pole material properties, and coil performance. The current configuration of the setup enabled the probing of rigidity values up to 200 Pa, which was sufficient for the biofilms examined here. Nevertheless, further engineering of our setup—involving, for instance, electromagnet cooling—should enable shifting of force and time limits by a factor of 2–3.
Second, the magnetic probes remain foreign bodies in bacterial biofilm and might affect the natural structuration of the material and, therefore, the local mechanical environment. However, confocal imaging of biofilms with and without inserted particles displayed no visible differences.
Third, particles are naturally distributed throughout the entire biofilm volume during growth, raising concern about selective localization of particles in given environments. However, this concern is minimized by the observation that particles can distinguish very different mechanical properties, indicating that they explore a wide range of locations.
We show here what is the introduction of an approach, which is open to further developments. These include, for instance, the analysis of both creep curve and relaxation functions (see examples of recordings in Fig. S13) or the design of an oscillatory version of the setup that might enable us to go deeper into the details of the rheological properties of the material underlying biofilm mechanics.
Using these tools, we were able to evidence the wide spread of viscoelastic parameters and to reveal their three-dimensional spatial distribution in a given native biofilm. From normalized distributions, we extracted relative markers, such as variance, skewness, and median, which do not depend on the mean value of the considered parameters but only on the degree of heterogeneity enabling comparison with different complex fluids. Interestingly, F pilus biofilm behavior exhibited similarities with that observed for a concentrated actin gel in the presence of cross-linking proteins (24,25), suggesting that biofilm mechanics are underpinned by an analogous cross-linked polymer network. Consistent with previous investigations (4,9,31), we found that biofilm exhibits a general viscoelastic material signature; however, due to the wide distribution of values (more than two orders of magnitude in elastic compliance), the material locally behaves either like a solid or like a liquid. At the force and timescale of our experiments, we found that elastic stretching represented the main contribution of the observed local biofilm deformations; ∼25% of particle deflections exhibited purely elastic displacement.
Our results elucidate the detailed remodeling of the biofilm mechanical profile according to biofilm aging, the physical environment the material is exposed to, and molecular details of the constitutive cells.
We show, on an F pilus-producing biofilm continuously fed under low shear stress (3 × 10⁻³ Pa, Reynolds number <1), that mechanical heterogeneity displays a vertical three-layer organization. Above the bottom stiffest layer (elastic modulus in the range 5–200 Pa; see Fig. 3), we find an intermediate laterally heterogeneous layer that exhibits a mosaic of mechanical microenvironments from the most rigid (>200 Pa) to the softest (in the range 0.2–1 Pa). A thin (∼15 μm thick) heterogeneous but softer layer, i.e., exhibiting no zone with the highest rigidity, resides on top of this. This general picture is maintained as biofilm ages, but with an increase in the thickness of the lower, most rigid layer. In contrast, this three-layer profile is strongly reshaped when biofilm is grown under different hydrodynamic conditions.
Our data show that increasing growth shear stress at the biofilm interface from 0.3 to 15 mPa induces a drastic decrease in the average compliance, but also in the spread of the values (see all the normalized distributions in Fig. S10 and corresponding parameters in the Supporting Material). Interestingly, this was observed in a range of low shear stresses (here, 1 mL/h flow corresponds to 3 × 10⁻³ Pa shear stress), two to three orders of magnitude lower than values expected to cause material deformation according to biofilm elastic moduli (in the range of 0.2–200 Pa). This observation rules out the hypothesis that shear stress-induced remodeling originates from a direct physical effect on the material organization itself, as previously suggested for higher stresses (31,32). In our experiments, the hypothesis of a reduced substrate loading rate at lower flows was unlikely, because our carbon source flow rate was, under all conditions, much higher than that expected to impact biofilm development (values <120 mg h−1 m−2, given in Peyton (33)). Rather, our assumption is that the observed changes reflect a cell biological response to low shear. Indications of such an adaptation to low shear stress involving genetic downregulation have recently been found in Staphylococcus aureus (34). Because we measured here mechanical parameters independently from overall shear stress imposed upon the biofilm, we were able to detect low-shear-stress mechanical remodeling occurring at forces that do not cause material deformation.
We also show here that switching the expression of surface appendages of the bacteria constituting the biofilm from F pili to curli induces a drastic alteration in the material mechanical profile. While F pilus production supports a three-layer heterogeneous mechanical profile, production of curli under the same conditions gives rise to stiff, mechanically much more homogeneous biofilm. In the regime of force explored here, bacterial cells did not directly contribute to the overall microrheological profile; indeed, all of Young's modulus values recorded for living microbial cells were in the MPa range (35). In contrast, the cell-cell interactions—promoted by the presence of curli on the cell surface—might play a role but we observed here that biofilm stiffening was not correlated with cell density increase.
Moreover, the mechanical behavior found here could fit the response of an unevenly cross-linked and/or swallowed polymer hydrogel displaying irregular mesh size across the structure. Thus, we suggest that the various degrees of cross-linking of the extracellular matrix might underlie biofilm mechanics. This is also supported by the similarity of the microheterogeneity profile that we have found in the biofilms and that found by Apgar et al. (24), Tseng and Wirtz (25), and Xu et al. (36) in polymer protein gels diversely cross-linked. Therefore, mechanical properties and their spatial distribution could be modulated by different concentrations of divalent ions, proteins, or DNA. In addition, the major curli subunit is secreted from the cell as a soluble protein and subsequently polymerizes in amyloid fibers (37).
Biofilms have aroused considerable public interest and scientific activity. Increasingly sophisticated knowledge is now required to progress to a better understanding of the complexity and specificity of this living structure (38). Until now, biofilm mechanics were mainly studied from a material perspective and were examined macroscopically in order to provide useful information for physical control of biofilm, but this overlooked their complexity and variability in this living material. Here we defend the idea that understanding the mechanical heterogeneity of bacterial biofilm will not only help to elucidate resistance to stress and breaking points, from an engineer's point of view, but also to make progress in understanding the specific biology of these structures. Indeed, formation of mechanical microniches within biofilm might be a driving force for generating or expanding the phenotypic diversity by which adherent communities enhance their chances of survival and develop resistance mechanisms (39).
Mechano-sensing via membrane channels gated with osmotic pressure is well described in microbes (40), but other issues, such as behavior in shear stress (41) or the response to environment rigidity known to impact cell functions in higher organisms, are not truly recognized in bacteria. We believe that the possibility of mapping out a local mechanical environment in a bacterial biofilm, in synergy with contemporary tools for monitoring biological activity at the single cell level, offers invaluable perspectives for further elucidating the profound role of physical cues in specific biofilm features. In addition, biofilm mechanical mapping-out opens up additional pathways for investigating in detail the internal effects of biocides upon these resistant structures and for possibly recognizing differential efficiency according to local mechanical properties within the structure.
Acknowledgments
We thank J. Husson and J. Saragosti for fruitful discussions and R. Fert and B. Lemaire for their help in the realization of the magnetic setup.
This work was in part supported by grants from the PIRIbio program of Agence Nationale pour la Recherche (Dynabiofilm grant), and the Pasteur-Curie PTR/PIC (program Nosocomial Infections) and the Centre National de la Recherche Scientifique–Interface Physicochimie/Biologie (program Risques).
Supporting Material
References
- 1.Hall-Stoodley L., Costerton J.W., Stoodley P. Bacterial biofilms: from the natural environment to infectious diseases. Nat. Rev. 2004;2:95–108. doi: 10.1038/nrmicro821. [DOI] [PubMed] [Google Scholar]
- 2.López D., Vlamakis H., Kolter R. Biofilms. Cold Spring Harb. Perspect. Biol. 2010;2:a000398. doi: 10.1101/cshperspect.a000398. [DOI] [PMC free article] [PubMed] [Google Scholar]
- 3.Stoodley P., Lewandowski Z., Lappin-Scott H.M. Structural deformation of bacterial biofilms caused by short-term fluctuations in fluid shear: an in situ investigation of biofilm rheology. Biotechnol. Bioeng. 1999;65:83–92. [PubMed] [Google Scholar]
- 4.Klapper I., Rupp C.J., Stoodley P. Viscoelastic fluid description of bacterial biofilm material properties. Biotechnol. Bioeng. 2002;80:289–296. doi: 10.1002/bit.10376. [DOI] [PubMed] [Google Scholar]
- 5.Körstgens V., Flemming H.C., Borchard W. Uniaxial compression measurement device for investigation of the mechanical stability of biofilms. J. Microbiol. Methods. 2001;46:9–17. doi: 10.1016/s0167-7012(01)00248-2. [DOI] [PubMed] [Google Scholar]
- 6.Cense A.W., Peeters E.A., van Dongen M.E. Mechanical properties and failure of Streptococcus mutans biofilms, studied using a microindentation device. J. Microbiol. Methods. 2006;67:463–472. doi: 10.1016/j.mimet.2006.04.023. [DOI] [PubMed] [Google Scholar]
- 7.Shaw T., Winston M., Stoodley P. Commonality of elastic relaxation times in biofilms. Phys. Rev. Lett. 2004;93:0988101–0988104. doi: 10.1103/PhysRevLett.93.098102. [DOI] [PubMed] [Google Scholar]
- 8.Towler B.W., Rupp C.J., Stoodley P. Viscoelastic properties of a mixed culture biofilm from rheometer creep analysis. Biofouling. 2003;19:279–285. doi: 10.1080/0892701031000152470. [DOI] [PubMed] [Google Scholar]
- 9.Lau P.C., Dutcher J.R., Lam J.S. Absolute quantitation of bacterial biofilm adhesion and viscoelasticity by microbead force spectroscopy. Biophys. J. 2009;96:2935–2948. doi: 10.1016/j.bpj.2008.12.3943. [DOI] [PMC free article] [PubMed] [Google Scholar]
- 10.Poppele E.H., Hozalski R.M. Micro-cantilever method for measuring the tensile strength of biofilms and microbial flocs. J. Microbiol. Methods. 2003;55:607–615. doi: 10.1016/s0167-7012(03)00198-2. [DOI] [PubMed] [Google Scholar]
- 11.Aggarwal S., Poppele E.H., Hozalski R.M. Development and testing of a novel microcantilever technique for measuring the cohesive strength of intact biofilms. Biotechnol. Bioeng. 2010;105:924–934. doi: 10.1002/bit.22605. [DOI] [PubMed] [Google Scholar]
- 12.Volle C.B., Ferguson M.A., Núñez M.E. Spring constants and adhesive properties of native bacterial biofilm cells measured by atomic force microscopy. Colloids Surf. B Biointerfaces. 2008;67:32–40. doi: 10.1016/j.colsurfb.2008.07.021. [DOI] [PubMed] [Google Scholar]
- 13.Lidstrom M.E., Konopka M.C. The role of physiological heterogeneity in microbial population behavior. Nat. Chem. Biol. 2010;6:705–712. doi: 10.1038/nchembio.436. [DOI] [PubMed] [Google Scholar]
- 14.Stewart P.S., Franklin M.J. Physiological heterogeneity in biofilms. Nat. Rev. 2008;6:199–210. doi: 10.1038/nrmicro1838. [DOI] [PubMed] [Google Scholar]
- 15.Liu X., Ramsey M.M., Bard A.J. Real-time mapping of a hydrogen peroxide concentration profile across a polymicrobial bacterial biofilm using scanning electrochemical microscopy. Proc. Natl. Acad. Sci. USA. 2011;108:2668–2673. doi: 10.1073/pnas.1018391108. [DOI] [PMC free article] [PubMed] [Google Scholar]
- 16.Vidal O., Longin R., Lejeune P. Isolation of an Escherichia coli K-12 mutant strain able to form biofilms on inert surfaces: involvement of a new ompR allele that increases curli expression. J. Bacteriol. 1998;180:2442–2449. doi: 10.1128/jb.180.9.2442-2449.1998. [DOI] [PMC free article] [PubMed] [Google Scholar]
- 17.Sbalzarini I.F., Koumoutsakos P. Feature point tracking and trajectory analysis for video imaging in cell biology. J. Struct. Biol. 2005;151:182–195. doi: 10.1016/j.jsb.2005.06.002. [DOI] [PubMed] [Google Scholar]
- 18.Schnurr B., Gittes F., Schmidt C.F. Determining microscopic viscoelasticity in flexible and semiflexible polymer networks from thermal fluctuations. Macromolecules. 1997;30:7781–7792. [Google Scholar]
- 19.Bausch A.R., Ziemann F., Sackmann E. Local measurements of viscoelastic parameters of adherent cell surfaces by magnetic bead microrheometry. Biophys. J. 1998;75:2038–2049. doi: 10.1016/S0006-3495(98)77646-5. [DOI] [PMC free article] [PubMed] [Google Scholar]
- 20.Jones W.L., Sutton M.P., Stewart P.S. Chemical and antimicrobial treatments change the viscoelastic properties of bacterial biofilms. Biofouling. 2011;27:207–215. doi: 10.1080/08927014.2011.554977. [DOI] [PubMed] [Google Scholar]
- 21.Perkins G.S., Jones R.B. Hydrodynamic interaction of a spherical-particle with a planar boundary. 2. Hard-wall. Physica A. 1992;189:447–477. [Google Scholar]
- 22.Perkins G.S., Jones R.B. Hydrodynamic interaction of a spherical particle with a planar boundary I. Free surface. Physica A. 1991;171:575–604. [Google Scholar]
- 23.Ghigo J.M. Natural conjugative plasmids induce bacterial biofilm development. Nature. 2001;412:442–445. doi: 10.1038/35086581. [DOI] [PubMed] [Google Scholar]
- 24.Apgar J., Tseng Y., Wirtz D. Multiple-particle tracking measurements of heterogeneities in solutions of actin filaments and actin bundles. Biophys. J. 2000;79:1095–1106. doi: 10.1016/S0006-3495(00)76363-6. [DOI] [PMC free article] [PubMed] [Google Scholar]
- 25.Tseng Y., Wirtz D. Mechanics and multiple-particle tracking microheterogeneity of α-actinin-cross-linked actin filament networks. Biophys. J. 2001;81:1643–1656. doi: 10.1016/S0006-3495(01)75818-3. [DOI] [PMC free article] [PubMed] [Google Scholar]
- 26.Xu J., Wirtz D., Pollard T.D. Dynamic cross-linking by α-actinin determines the mechanical properties of actin filament networks. J. Biol. Chem. 1998;273:9570–9576. doi: 10.1074/jbc.273.16.9570. [DOI] [PubMed] [Google Scholar]
- 27.Beloin C., Houry A., Henry N. A short-time scale colloidal system reveals early bacterial adhesion dynamics. PLoS Biol. 2008;6:e167. doi: 10.1371/journal.pbio.0060167. [DOI] [PMC free article] [PubMed] [Google Scholar]
- 28.Wilking J.N., Angelini T.E., Weitz D.A. Biofilms as complex fluids. MRS Bull. 2011;36:385. [Google Scholar]
- 29.Rogers S.S., van der Walle C., Waigh T.A. Microrheology of bacterial biofilms in vitro: Staphylococcus aureus and Pseudomonas aeruginosa. Langmuir. 2008;24:13549–13555. doi: 10.1021/la802442d. [DOI] [PubMed] [Google Scholar]
- 30.Mathias J.D., Stoodley P. Applying the digital image correlation method to estimate the mechanical properties of bacterial biofilms subjected to a wall shear stress. Biofouling. 2009;25:695–703. doi: 10.1080/08927010903104984. [DOI] [PubMed] [Google Scholar]
- 31.Stoodley P., Cargo R., Klapper I. Biofilm material properties as related to shear-induced deformation and detachment phenomena. J. Ind. Microbiol. Biotechnol. 2002;29:361–367. doi: 10.1038/sj.jim.7000282. [DOI] [PubMed] [Google Scholar]
- 32.Flemming H.C., Wingender J. The biofilm matrix. Nat. Rev. 2010;8:623–633. doi: 10.1038/nrmicro2415. [DOI] [PubMed] [Google Scholar]
- 33.Peyton B.M. Effects of shear stress and substrate loading rate on Pseudomonas aeruginosa biofilm thickness and density. Water Res. 1996;30:29–36. [Google Scholar]
- 34.Castro S.L., Nelman-Gonzalez M., Ott C.M. Induction of attachment-independent biofilm formation and repression of Hfq expression by low-fluid-shear culture of Staphylococcus aureus. Appl. Environ. Microbiol. 2011;77:6368–6378. doi: 10.1128/AEM.00175-11. [DOI] [PMC free article] [PubMed] [Google Scholar]
- 35.Gaboriaud F., Dufrêne Y.F. Atomic force microscopy of microbial cells: application to nanomechanical properties, surface forces and molecular recognition forces. Colloids Surf. B Biointerfaces. 2007;54:10–19. doi: 10.1016/j.colsurfb.2006.09.014. [DOI] [PubMed] [Google Scholar]
- 36.Xu J., Tseng Y., Wirtz D. Microheterogeneity and microrheology of wheat gliadin suspensions studied by multiple-particle tracking. Biomacromolecules. 2002;3:92–99. doi: 10.1021/bm015586b. [DOI] [PubMed] [Google Scholar]
- 37.Wang X., Hammer N.D., Chapman M.R. The molecular basis of functional bacterial amyloid polymerization and nucleation. J. Biol. Chem. 2008;283:21530–21539. doi: 10.1074/jbc.M800466200. [DOI] [PMC free article] [PubMed] [Google Scholar]
- 38.Kolter R. Biofilms in lab and nature: a molecular geneticist's voyage to microbial ecology. Int. Microbiol. 2010;13:1–7. doi: 10.2436/20.1501.01.105. [DOI] [PubMed] [Google Scholar]
- 39.Boles B.R., Thoendel M., Singh P.K. Self-generated diversity produces “insurance effects” in biofilm communities. Proc. Natl. Acad. Sci. USA. 2004;101:16630–16635. doi: 10.1073/pnas.0407460101. [DOI] [PMC free article] [PubMed] [Google Scholar]
- 40.Kung C., Martinac B., Sukharev S. Mechanosensitive channels in microbes. Annu. Rev. Microbiol. 2010;64:313–329. doi: 10.1146/annurev.micro.112408.134106. [DOI] [PubMed] [Google Scholar]
- 41.Lecuyer S., Rusconi R., Stone H.A. Shear stress increases the residence time of adhesion of Pseudomonas aeruginosa. Biophys. J. 2011;100:341–350. doi: 10.1016/j.bpj.2010.11.078. [DOI] [PMC free article] [PubMed] [Google Scholar]
Associated Data
This section collects any data citations, data availability statements, or supplementary materials included in this article.