

Abstract
In a motile eukaryotic cell, front protrusion and tail retraction are superimposed on each other. To single out mechanisms that result in front to tail or in tail to front transition, we separated the two processes in time using cells that oscillate between a full front and a full tail state. State transitions were visualized by total internal reflection fluorescence microscopy using as a front marker PIP3 (phosphatidylinositol [3,4,5] tris-phosphate), and as a tail marker the tumor-suppressor PTEN (phosphatase tensin homolog) that degrades PIP3. Negative fluctuations in the PTEN layer of the membrane gated a local increase in PIP3. In a subset of areas lacking PTEN (PTEN holes), PIP3 was amplified until a propagated wave was initiated. Wave propagation implies that a PIP3 signal is transmitted by a self-sustained process, such that the temporal and spatial profiles of the signal are maintained during passage of the wave across the entire expanse of the cell membrane. Actin clusters were remodeled into a ring along the perimeter of the expanding PIP3 wave. The reverse transition of PIP3 to PTEN was linked to the previous site of wave initiation: where PIP3 decayed first, the entry of PTEN was primed.
Introduction
A motile eukaryotic cell is typically polarized into a protruding front and a retracting tail (1). An important determinant of polarity is the actin system in the cortex of the cell (2), which in the highly motile cells of Dictyostelium is rapidly reorganized. To address cell polarization as a process of self-organization, we depolymerized actin to such an extent that the cells rounded up and no microscopically visible actin structures remained (3). After removal of the depolymerizing drug, latrunculin A, the cells fully recovered. Importantly, before the cells regained normal polarity and motility, they passed through a stage of instability in which actin structures oscillated between two distinct states that occupied areas separated by propagating actin waves (4). Propagation of the waves in different directions led to the shrinkage or expansion of the inner territory at the expense of the external one.
The propagation of actin waves proved to be linked to the pattern of PIP3 (phosphatidylinositol [3,4,5] tris-phosphate) in the membrane (5). Antagonistic players in the control of PIP3 are PI3-kinases that synthesize PIP3 from PIP2 (phosphatidylinositol [4,5] bis-phosphate), and PI3-phosphatases that hydrolyze PIP3 to PIP2 (6,7). The PIP3-degrading PI3-phosphatase PTEN (phosphatase tensin homolog) is a tumor suppressor; one of its functions is to suppress cell motility by downregulating PIP3-dependent actin polymerization (8).
PIP3 is synthesized at the front of chemotaxing cells (9) where it stimulates the polymerization of actin (10). For actin wave patterns, the territory circumscribed by a wave is occupied by PIP3 (5) (Fig. 1, A and B), suggesting that this inner territory corresponds to the front of a motile cell, where PI3-kinases are activated, whereas the area outside the wave corresponds to the tail. This notion is supported by characteristic differences in regulatory and actin-associated proteins (Fig. 1 A). Ras activation, which is characteristic of the front of a chemotaxing cell (10,11), also distinguishes the inner from the external territory of an actin wave (12). The Arp2/3 complex, which localizes to a protruding front (13) accumulates in the same territory. In contrast, two markers of the tail, filamentous myosin II and cortexillin, are found in the external area of a wave (4).
Figure 1.
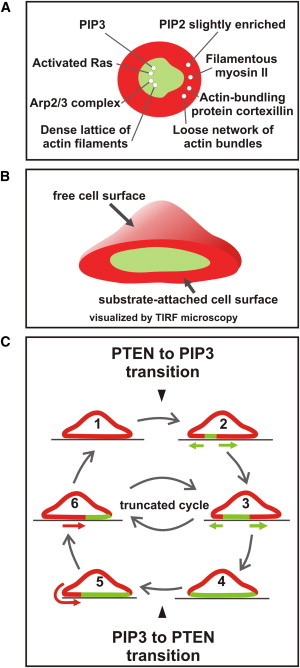
Illustration of the dynamic patterns in the actin and phosphoinositide systems on which the present study is based. (A) After depolymerization of actin, restitution of normal cell organization is preceded by periodic transitions between two states that correspond to the front (green) and tail region (red) of a polarized motile cell. Because these transitions occur in the plane of the substrate-attached cell membrane, TIRF microscopy is the technique of choice for their visualization. Taken from data in (4) and (12). (B) A three-dimensional view illustrating continuity of the PTEN-rich area of the free cell membrane with the external area of the substrate-attached cell membrane. (C) Cycle of PTEN to PIP3 transitions (red to green), diagrammed in cross sections through a substrate-attached cell. When the cell undergoes a full cycle, as studied here, it circulates between a state of full PTEN decoration (1) and one of full PIP3 enrichment (4) of the substrate-attached cell membrane. A PTEN to PIP3 transition begins with the initiation of a wave (2), and continues with its propagation (3). A PIP3 to PTEN transition commences laterally at the border of the PTEN-decorated area of the nonattached cell membrane (5), and progresses as a continuous layer along the substrate-attached membrane (6). As previously shown (12), the system may also alternate between stages (3) and (6). In this case, areas in both states are jointly present on the substrate-attached cell membrane. These areas change reciprocally in their sizes, but at no time does either of them disappear. Therefore, no initiation of state transitions is required in these truncated cycles.
Phosphoinositide patterns were shown by Arai et al. (14) to oscillate in a similar manner to actin patterns, especially under conditions of suppressed actin polymerization: PIP3-rich and PTEN-decorated areas of the plasma membrane circulated in a manner that suggested a direct cross-inhibition of the PIP3-synthesizing kinases and the PIP3-degrading PTEN. Through use of PTEN-null mutants, actin dynamics was uncoupled from PTEN: actin waves were still formed in the mutant cells, but the periodicity of their formation was impaired, suggesting that state transitions in the actin system are linked to PTEN dynamics (12). PTEN typically populated the substrate-attached cell surface from its border (12), in contact with the PTEN-rich free cell surface (Fig. 1 B).
In the patterns previously studied, the areas corresponding to the front or tail of a motile cell reciprocally changed their sizes or positions. For this study we have selected cells in which the substrate-attached cell surface switched reversibly from a state of full PTEN-decoration to a fully PIP3-enriched state (Fig. 1 C). Such cells enabled us to pinpoint the very start of state transitions. Here, we analyze different pathways of transition from a full front to a full tail state and in the reverse direction.
Materials and Methods
Cells of Dictyostelium discoideum strain AX2-214 were cultivated in nutrient medium, washed in 17 mM K/Na-phosphate buffer pH 6.0, incubated for 15 min in 5 μM latrunculin A, and recorded after removal of the drug at 23 ± 2°C (15).
Dual-color imaging was performed using a custom-built total internal reflection setup based on an Olympus IX71 inverted microscope equipped with an Olympus 150× UApo 1.45NA total internal reflection fluorescence (TIRF) microscopy objective, essentially as described (12). GFP and monomeric red fluorescent protein (mRFP) were excited simultaneously by a 491 nm (Cobolt Calypso, 75mW) and a 561 nm (Cobolt Jive, 75mW) laser, respectively, via an acousto-optic tunable filter. Simultaneous emissions of GFP and mRFP were recorded by an Andor iXon + 897BV EMCCD camera through a Hamamatsu W-View image splitter equipped with 525/30 BP (GFP) and 628/40 (mRFP) emission filters and matched 550 LP and 550 dichromatic mirrors (Andor Technology, Belfast, UK). The TIRF images were analyzed using Fiji (http://pacific.mpi-cbg.de/wiki/index.php/Fiji), an image processing package based on ImageJ (National Institutes of Health, Bethesda, MD; http://rsb.info.nih.gov/ij). The data were copied in a Microsoft (Redmond, WA) Excel spreadsheet for calculations and chart plotting. The pixel size was 0.106 μm. For point scans the circular area measured comprised 12 pixel2, except for actin-PTEN scans, where a much larger area of 716 pixel2 was scanned to fully cover the actin clusters.
For the PTEN-mRFP expression construct, the full-length genomic PTEN sequence (DDBG0286557) was cloned into the ecoRI-site of a pDEX-based expression vector (16) in frame with the linker F-G-S-G-G-S-G-G-S and mRFPmars (17). Transformants were selected using 10 μg/ml of blasticidin. Cells expressing PTEN-GFP in a PTEN-null background (18) were transfected to express mRFP-LimEΔ as a marker for filamentous actin as described (13). The GFP-PHcrac vector was a gift of Carole Parent, National Institutes of Health.
Results
Negative fluctuations in the PTEN layer prime a PIP3 wave
Spatiotemporal pattern dynamics at the substrate-attached membrane was visualized by applying dual-color TIRF microscopy to cells expressing PTEN-mRFP and GFP-PHcrac. PHcrac is the PH-domain of the cytosolic regulator of adenylyl cyclase (19). This domain recognizes PI[3,4,5]P3 (and PI[3,4)]P2), but not PI[4,5]P2, the product of the PI3-phosphatase activity of PTEN (20). For live-cell labeling PHcrac has two advantages: it binds and dissociates fast (20), and its binding is not abolished by the activity of inositol 5-phosphatases that convert PIP3 to PI (3,4) P2 (21). In the following we denote PHcrac labeling as indicating PIP3-enrichment. The cells recovering from actin depolymerization oscillated between all stages of PIP3-enrichment and PTEN- decoration of the membrane with negligible net cell movement. However, an area encompassed by an actin wave tended to contract when in the PTEN-decorated state and to expand when in the PIP3-rich state (4), in accord with the notion that the PIP3-rich territory corresponds to a motile cell's front region and the PTEN-decorated area to the cell's tail.
The transition from a PTEN-decorated to a PIP3-rich state of the membrane is illustrated in Fig. 2 A. In the fluorescence images of PTEN-mRFP, dark holes appeared in the PTEN layer that decorated the inner face of the plasma membrane. Increases in PIP3 were restricted to these areas of PTEN depletion, indicating that the rise of PIP3 is conditioned by negative fluctuations of PTEN. Most increases in PIP3 were transient, as were the holes (patches I to III). However, when the fluctuations of PIP3 reached a supercritical level, they became amplified and a propagating wave was generated (patch IV, also shown in Movie S1 in the Supporting Material). Fig. 2 B illustrates the dynamics of the transient PIP3 patches I to III in relation to patch IV, which initiated a PIP3 wave. Remarkably, the increase in PIP3 paused in this patch slightly above the peaks of the transient patches, suggesting a period of uncertainty about decrease or further increase of PIP3 up to initiation of a wave.
Figure 2.
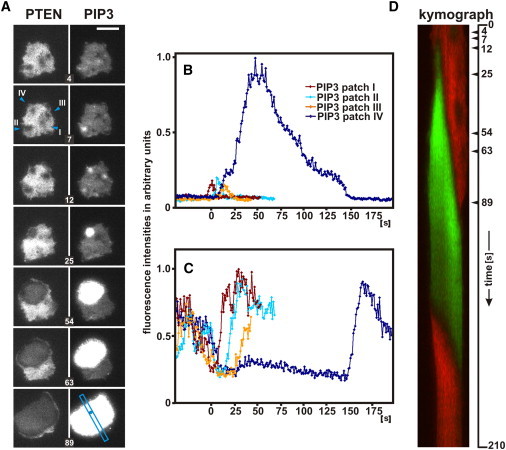
State transitions in a cell double-labeled for PTEN and PIP3. Fluorescence intensities of PTEN-mRFP and GFP-PHcrac were recorded by TIRF microscopy. (A) Transient PIP3 patches located within holes in the PTEN layer and initiation of a PIP3 wave. The PTEN images are shown on the left and the simultaneously recorded PIP3 images on the right. In three of four PTEN holes the rise of PIP3 is transient; in the fourth it is amplified and turned into a propagated wave. Note that PTEN-decoration is greatly reduced within the area of the wave, most strongly at its border. (B) Transient PIP3 increases in patches I–III, as compared to the amplification in patch IV at the initiation phase of a wave. (C) Dynamics of transient PTEN holes as compared to continued PTEN suppression during wave initiation. The four PTEN holes correspond to PIP3 patches I–IV. (D) Kymograph showing evolution of PTEN (red) and PIP3 (green) patterns in the scan direction as shown in A (blue bar). Arrowheads at the vertical axis indicate times of the respective frames in A. Initiation of a PIP3 wave is traced back to PTEN hole IV, which widens as the PIP3 wave expands, leaving a dark space between the PTEN and PIP3 labels. Transition to the PTEN-decorated state begins after the decline of PIP3. Note the asymmetry in the kymograph, where both the PTEN to PIP3 and the PIP3 to PTEN transitions commence on the left side of the scan. Seconds after beginning the kymograph are indicated; zero time corresponding to the first frame of Movie S1. Bar, 10 μm.
The dynamics of transient PTEN holes is characterized by a sudden decline and, in most cases, an immediate return to initial or even higher levels of PTEN decoration (Fig. 2 C, Movie S2, and Fig. S1). To obtain quantitative data on the dynamics of these PTEN holes, we determined the time lag between the decrease of PTEN to half-minimum and its half-maximal recovery. In 10 holes measured, this halftime of persistence of a hole varied between 9.7 and 17.0 s, with a mean of 12.4 s.
PTEN holes tended not to be stationary: they expanded in one direction, fused, split, or glided along the inner face of the plasma membrane (Movie S3). A hole is postulated to migrate when PTEN-binding to the membrane is favored at one side of its border and dissociation is favored on the other, implying that the membrane-binding of PTEN is locally regulated and dynamically switched on and off.
To find out whether a cross-inhibiting activity of PIP3 is required for a local decline in PTEN, we scanned PIP3 in the interior of holes and found that the increases varied from undetectable in transient holes (Movies S4–S6) to extremely high peaks in holes that turned into PIP3 waves (Movie S1). Those cases in which PTEN declined with no detectable increase of PIP3 argue against an essential role for PIP3 in the downregulation of PTEN.
The kymograph of Fig. 2 D, scanned along the direction of wave propagation, covers a full period of transitions from PTEN to PIP3 and back to PTEN. This graph reveals two remarkable features. i), There is little if any overlap between PTEN-decorated and PIP3-enriched areas; dark zones separate the green PIP3-enriched from the red PTEN-decorated areas. ii), The initiation site of the PIP3 wave and the origin of the reverse PIP3 to PTEN transition are located on the same side of the graph, which suggests a spatial link between the forward and reverse transitions. Below we confirm and quantitatively analyze these features.
Reversal versus randomization of state transitions
The analysis of long recording sequences established a defined spatial relationship between the initiation of a PIP3 wave and the entry of PTEN into the substrate-attached membrane area (Movie S7). Consistently, PTEN first appeared close to the previous site of wave initiation (Fig. 3 A). Information regarding the position of the initiation site proved to be stored in the temporal program of wave propagation (Fig. 3 B and Movie S8). At any stage of propagation, the rise of PIP3 was followed by its decline, creating a horseshoe pattern in the plane of the membrane (Fig. 3 C). PIP3 fell behind the peak at the wave front to half-maximum within <50 s, reaching its basal level first in the vicinity of the initiation site. This is the position where PTEN was primed to enter the membrane area (Fig. 3 D). As a result, the polarity was reversed: an area covered with the front-specifier PIP3 turned into an area decorated with the tail-specifier PTEN.
Figure 3.
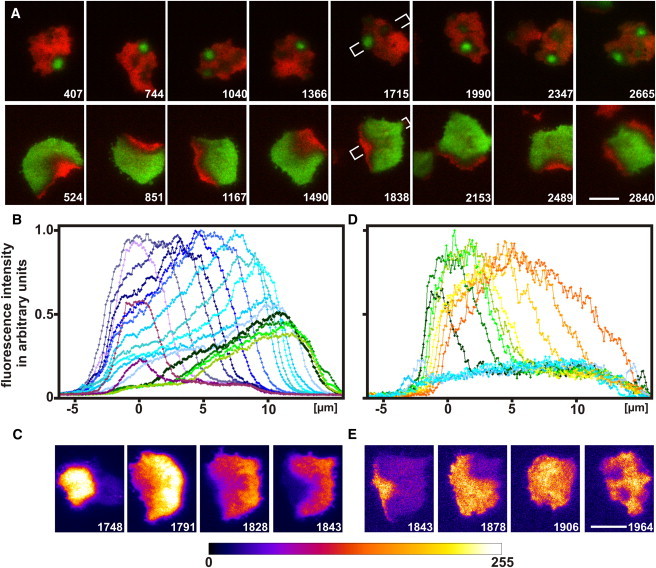
Spatial connection between the initiation of a PIP3 wave and the lateral entry of PTEN. (A) Eight cycles of PIP3 initiation and PTEN entry are recorded in a cell double-labeled for PTEN (red) and PIP3 (green) as in Fig. 2D. For each cycle an early stage of PTEN to PIP3 transition (upper panels) is aligned with a stage of the subsequent PIP3 to PTEN transition (lower panels). Comparison of the corresponding panels reveals a spatial link between PIP3 initiation and PTEN entry sites, whereas the position of PIP3 initiation is not linked to the previous PTEN entry. The last panels show the simultaneous initiation of two PIP3 waves, which are accordingly followed by the entry of PTEN from two different sides onto the substrate-attached membrane. Numbers are seconds of a continuous recording, in accord with the frame numbers of Movie S7. (Note that we have turned the images by 180° relative to the Movie S7.) Bars, 10 μm. In the 1715-s and 1838-s panels, the direction of the scans for B and D is indicated. (B) Initiation, propagation, and decline of a PIP3 wave. (C), PIP3 patterns during propagation of the wave. Fluorescence intensities are presented as a look-up table from dark purple to bright yellow (fire LUT). (D) PTEN entry and progression of a PTEN gradient after the decline of PIP3. (E) PTEN progression and hole formation presented as a LUT as for C. Fluorescence intensities in panels B and D are normalized to the highest value in each panel after subtraction of the background outside the cells. Zero position on the abscissa is the site of wave initiation. The rainbow colors mark time at intervals of 10 s. The last six curves of B coincide in time with the first six curves of D.
Whereas information on the PIP3 initiation site is stored in a wave pattern, information on the entry site of PTEN is lost during uniform decoration of a membrane area with PTEN. The reason is that the rise and fall of PTEN are not linked to each other (Fig. 3 D). The rise of PTEN occurs in the form of a progressing gradient, whereas the fall occurs in the form of multiple holes (Fig. 3 E). The initiation of a PIP3 wave within one of these holes appears to be a stochastic event.
PIP3 kinetics in wave initiation and propagation
The data presented indicate that at each single point in a visualized field (i.e., the substrate-attached membrane), PIP3 levels increase and decrease in a characteristic temporal sequence. Tracks of the fluorescence intensity of the PHcrac label are shown in Fig. 4 A as a function of time at the initiation site and at distances of up to 10 μm from this site, encompassing propagation across the entire substrate-attached cell surface. The PIP3 wave propagated with an average velocity of 0.14 μm·s−1, similar to the reported velocities of actin waves (4,15). During propagation of the wave, the intensity of the PIP3 label did not arrest at a plateau but turned immediately from rise to fall. The average persistence time of PIP3 at a site within the field of wave propagation was 46 s ± 7 s (s.d.), as determined at half maximum for nine PIP3 cycles.
Figure 4.
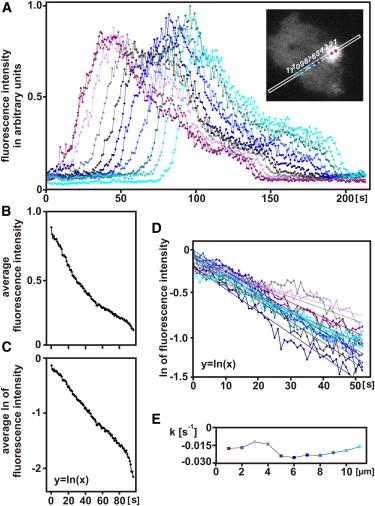
PIP3 kinetics at different positions along the path of a propagated wave. (A) Increases and decreases of PIP3 as a function of time at different positions on the membrane. Measurements were taken at distances of 1 μm, and the positions were color-coded as indicated in the inset. On the decay branch of the curves, a shoulder is apparent at about one-quarter of the peak intensity, indicating that at least two processes are involved in PIP3 depletion. (B) Decline of PIP3 from the peak intensities, averaged over all 11 positions presented in A and displayed in a linear plot. (C) The same in a semilogarithmic plot. The quasilinear region on the left allows approximating the first phase in the decline of PIP3 by first-order kinetics. (D) Trend lines drawn for the first phase of PIP3 decay. The color-coding refers to measurements at the same 11 positions of the wave as in A. (E) Rate constants k for PIP3 decay as derived from D. Rate constants determined at the 11 different positions do not reveal any trend related to the increasing distance of the wave from the initiation site.
To examine whether the rate of PIP3 decrease changed systematically during the course of wave propagation, we determined the kinetics of the rise and fall of PIP3 at different positions along the path of a wave. Fig. 4 A suggested that the PIP3 decrease occurs in two steps, a first step down to 20–30% of the maximum, and a second step down to full decline. Therefore, we first averaged the curves from all positions (Fig. 4 B) and transformed them into a logarithmic plot (Fig. 4 C). The first section of the decline can be approximated by first-order kinetics. The apparent rate constants k were determined from the decline at different positions of the wave (Fig. 4 D). k varied within limits of −0.012 and −0.026 s−1during propagation of the wave. However, there was no systematic difference between the rates at the beginning and the final stage of wave propagation (Fig. 4 E).
Phase relationships in the PTEN-PIP3 cycle
To quantify the temporal changes that PIP3 and PTEN undergo at one point in space, we focused on the initiation site of a wave. The formation of a hole in the PTEN layer is seen in the plot of Fig. 5 A as a fall in PTEN that commences before a rise of PIP3 becomes apparent (phase I on bottom of the figure). A transient rise of PIP3 within the hole remains weak (II), and the PIP3 declines before amplification commences and wave propagation is turned on (III). Although PTEN remains low, PIP3 sharply switches from rise to fall (IV); arresting at a low level that corresponds to the reduced PIP3 occupancy in the interior of a horseshoe pattern (V). Only when PIP3 falls to basal level does PTEN begin to rise (VI).
Figure 5.
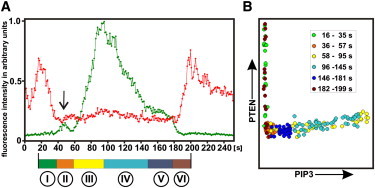
One cycle of transitions from PTEN-decoration to PIP3-enrichment and back to PTEN-decoration. (A) Temporal changes in PIP3 (green) and PTEN (red) scanned at the site of PIP3 initiation (within an area of 12 pixel2). The arrow points to a transient increase in PIP3 within the hole of PTEN where a wave is eventually initiated. Encircled numbers below the color scale refer to phases of the cycle: (I) holes in the PTEN coat, (II) temporary appearance of PIP3 within one hole, (III) initiation of a PIP3 cascade in the same hole, (IV) expanded PIP3 wave, (V) membrane fully covered by PIP3, and (VI) entry of PTEN close to the previous site of PIP3 initiation. The color scale links these numbers to color coding of the phases in B. (B) Phase plane correlating fluorescence intensities of PTEN to those of PIP3. The decrease and increase of membrane-bound PTEN both occur at persistently low PIP3 levels (phases I and VI). PIP3 amplification is associated with a slight increase in PTEN, and the subsequent decline in PIP3 with a slight decrease of PTEN (phases III and IV). The period shown corresponds to the 668–918 s sequence of Movie S7.
The phase plane in Fig. 5 B illustrates that membrane-bound PTEN both falls and rises in the presence of low PIP3 levels, and that the fall of PIP3 occurs at the same low PTEN levels as its rise. Similar phase trajectories have been obtained from other sites along the path of wave propagation, indicating that the sharp separation of PTEN-decorated and PIP3-rich phases is not unique to the initiation site.
Coupling of actin polymerization to PIP3-PTEN patterns
At the perimeter of a PIP3-rich membrane area, actin polymerizes in association with the Arp2/3 complex into a ring-shaped structure (4,5). When the PIP3-rich area increases or decreases, this structure propagates on the membrane as an expanding or retracting wave by the continuous polymerization and depolymerization of actin (15). To investigate how an actin wave is primed in relation to PTEN holes and the PIP3 patches formed within them, a marker for filamentous actin, mRFP-LimEΔ (22), was coexpressed with PTEN-GFP or GFP-PHcrac. Fig. 6 A shows a cluster of actin patches on top of a PIP3 initiation site labeled by GFP-PHcrac. This cluster was remodeled into a ring when the PIP3 patch widened and the central PIP3 concentration increased (Figs. 6, B and C, and Movie S9). Actin clusters might be formed at areas of weak or no detectable increase of PIP3, but the propagation of a circular actin wave was always linked to the border of a PIP3-rich territory (Movie S10 and Movie S11).
Figure 6.
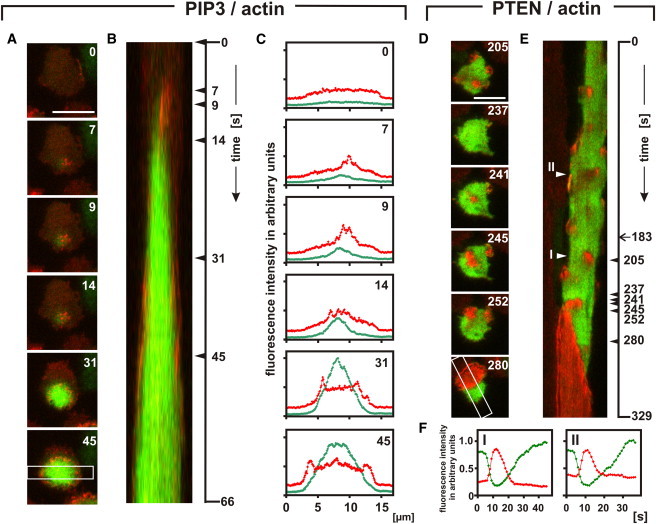
Actin polymerization linked to PIP3 and PTEN dynamics. Actin is colored red; the green color shows in A to C the PIP3 label and in D–F the PTEN label. (A) Stages of wave initiation and propagation. Numbers are seconds after the first frame. The frame in the bottom panel shows the scan direction in B and C. (B) Kymograph showing the evolution of a PIP3 wave from initiation (top) to full coverage of the substrate-attached cell membrane. At the very beginning, filamentous actin clusters close to the initiation site, and it subsequently accumulates most strongly at the perimeter of the expanding PIP3-rich area. (C) Quantification of fluorescence intensities at the stages shown in A. (D) Transient accumulation of actin in short-lived PTEN holes and eventual formation of a wave. PTEN and actin labels are shown separately in Movie S13. (E) Kymograph along the scan shown in the bottom panel of D. An actin-filled PTEN hole is seen to translocate before the wave is initiated. Arrowheads on the right indicate the time of images presented in D, the arrow at 183 s being the beginning of Movie S13. (F) Temporal relation of reversible PTEN decline and transient clustering of filamentous actin in the PTEN holes I and II marked in E. Bars, 10 μm.
In cells colabeled with PTEN-GFP, actin clustered within PTEN holes. It did so within the many PTEN holes that eventually disappeared (Fig. 6 D and Movie S12), as well as at the initiation site of a wave (Fig. 6 E). In the example of wave initiation shown, the PTEN hole marked by actin clusters migrated on the membrane before it became the origin of a wave (Movie S13).The actin clusters became detectable within ±10 s of the decline of PTEN, suggesting that formation of PTEN holes and polymerization of actin are tightly coupled to each other (Fig. 6 F).
Discussion
Coupled PIP3, PTEN, and actin patterns
To study the transition of a membrane area specified as a front to one characterized as a tail, we made use of the distinct patterns formed periodically in cells that recover from actin depolymerization. For this analysis, we selected recordings of Dictyostelium cells whose substrate-attached membrane switched reversibly from a state of full PTEN decoration to a state of full PIP3 enrichment, an optimal condition for studying the initiation of state transitions.
It is a basic feature of the pattern-forming system responsible for front and tail specification that, after a PIP3 wave has passed an area, this area does not directly return to an excitable state capable of carrying another PIP3 wave. Instead, it turns into a state that allows PTEN to decorate the membrane (14). Typically, PTEN enters the substrate-attached membrane area laterally as a crescent, which we have interpreted as an induction of membrane-binding at the border of a PTEN-decorated nonattached area of the cell surface (12). Only later, when the PTEN coat becomes perforated, can a new PIP3 wave repeat the cycle. The initiation step of this wave confers a stochastic element to the oscillator that governs the state transitions. The actual site of PTEN entry is determined by the spatiotemporal pattern of PIP3 decay (Fig. 3), indicating that a mechanism for the regular change of polarity is implicated with the pattern generating system.
Our data showing that PTEN forms a layer on the cytoplasmic face of the membrane that acts as a global inhibitor of PIP3 synthesis imply a gatekeeper function for PTEN (8). Local depletion of PTEN from the membrane allows the PIP3 concentration to increase in two stages. As long as PIP3 fluctuations remain low, they are reversible, and the hole will close (Movie S4). If an amplification step comes into play, a point of no return is reached and a propagating wave will be initiated (Movie S1).
In cells stimulated with the chemoattractant cyclic AMP, patches of PIP3 or of activated Ras are induced at sites of actin-based pseudopod formation (23,24). These structures may be restricted to PTEN holes, similar to the actin-associated PIP3 patches formed under our conditions.
The role of actin in the generation of PIP3/PTEN patterns is controversial. According to Charest and Firtel (25), the membrane-binding and activation of PI3-kinases depends on polymerized actin. On the other hand, Arai et al. (14) reported that PIP3/PTEN patterns are formed in the presence of 5 μM latrunculin A, a concentration that these authors considered to be sufficient for the complete inhibition of actin polymerization. If actin is allowed to polymerize, as in this study, the assembly of actin is temporally and spatially linked to PTEN decline (Fig. 6 F).
Oscillatory PIP3-PTEN patterns reflect the mode of data sampling
In Fig. 7, patterns obtained by global and single-site measurements are compared. The entire fluorescence intensities of the PIP3 and PTEN labels at the surface of a single cell are plotted in Fig. 7 A. In this graph, regular spike-like increases of PIP3 are interspaced with fluctuating increases of PTEN. The fluctuations are due to the irregularity of hole formation in the PTEN layer, as shown in Fig. 2, Fig. 3 E, and Movie S7. In this presentation of global changes, phases of PIP3 increase coincide with phases of PTEN decrease (closed arrowheads). This antiparallel dynamics might be viewed as indicating cross-inhibition of PIP3 and PTEN. However, it merely indicates phases during which PIP3-rich and PTEN-decorated areas are simultaneously present on the membrane of the cell (Movie S7).
Figure 7.
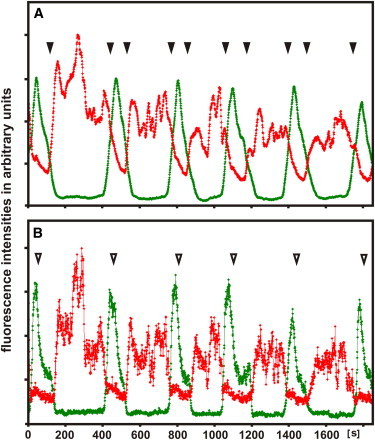
Periodic transitions between PIP3-enriched (green) and PTEN-decorated (red) membrane areas, determined by two different modes of data acquisition. (A) Global measurements displaying the total fluorescence intensities on the substrate-attached cell membrane recorded by TIRF microscopy. Filled arrowheads point to phases at which increases in PTEN appear to coincide with decreases in PIP3, and vice versa. (B) The same parameters sampled on a small spot (12 pixel2 in the middle of the surface area). In this graph, phases of PTEN decoration and PIP3 enrichment are sharply separated from each other. Open arrowheads point to phases of PIP3 decline that coincide with slight decreases of PTEN.
To avoid overlap, throughout we performed single-site measurements. A recording corresponding to Fig. 7 A, but acquired from a single site on the membrane, is displayed in Fig. 7 B. In this graph, phases of PTEN decoration are sharply separated from phases of PIP3 enrichment, in accord with the example analyzed in Fig. 5. In particular, it is obvious that during the switch from rise to fall of PIP3, PTEN decoration remains low and decreases even further (open arrowheads). The switch from rise to fall of PIP3 is therefore unlikely to be caused by an inhibitory activity of PTEN.
Implications on models of front-tail transitions
A straightforward model of patterns formed by PTEN and PIP3 in the membrane of Dictyostelium cells assumes an autonomous oscillatory system based on autocatalysis and cross-inhibition of these two components (14). In this model, the expansion of PTEN on the membrane is postulated to be limited by exhaustion of the resource, the PTEN pool in the cytoplasm. Our data suggest that additional control factors are involved in the coupled dynamics of PTEN and PIP3. First, a mechanism is required to account for the sharp turn from rise to fall of PIP3 in the presence of low or even declining PTEN on the membrane (Fig. 5 and Fig. 7 B). PI3-kinase activity may be turned off and/or a PIP3 degrading enzyme other than PTEN may be activated. In this respect, the wave dynamics resemble the changes induced by chemoattractant: upon stimulation of cells in a gradient of cyclic AMP, PIP3 rises rapidly while PTEN dissociates from the membrane, followed by the downregulation of PIP3 before PTEN reattaches to the membrane (26). Second, the formation of PTEN holes does not appear to depend on a cross-inhibiting activity of PIP3 (Movie S3 and Movie S5). Holes in the PTEN layer appear to be formed by the amplification of negative fluctuations. A conceivable mechanism is the autocatalytic activation of a Ser/Thr-kinase that, by phosphorylating PTEN, causes its detachment from the membrane (27,28). The coverage of the entire membrane area with either PIP3 or PTEN shows that exhaustion of a resource is not a limiting factor in formation of the patterns studied here.
As based on our data, the pattern-forming system comprises four different modules:
-
1.
The autocatalytic amplification of PIP3 that initiates a PIP3 wave.
-
2.
Propagation of the wave and decline of the activated state with a time constant that does not vary with increasing distance from the site of wave initiation. This behavior of PIP3 implies that the range of the excitation is not restricted by short-range diffusion of an activator from the initiation site; the excited state can rather spread across the entire diameter of the cell. Thus, wave propagation links short-range diffusion to long-range activation. The wave may continue to propagate even if the initiation site is no longer active. This type of wave propagation can be modeled as analogous to the phosphoprotein wave in a protein kinase cascade (29). Furthermore, the undiminished decay rate of PIP3 at long distances from the initiation site makes it unlikely that the loss of PIP3 at the back of the wave is caused by an inactivator that is locally produced at, and diffuses from, the site of initiation. In any case PTEN is not this inactivator.
-
3.
The progression of a PTEN layer along the substrate-attached membrane area, induced at the interface with the PTEN-decorated membrane that covers the nonattached cell surface. The progression of PTEN in the form of a gradient is not limited by the availability of cytosolic PTEN, because this resource is in large excess (8) and is, in any case, sufficient for covering the entire substrate-attached membrane with PTEN. Modules 2 and 3 are negatively coupled to each other: the entry of PTEN into a membrane area commences after the decline of PIP3, and the initiation of a PIP3 wave is triggered by the local decline of PTEN.
-
4.
The localized negative fluctuation of PTEN, resulting in the formation of PTEN holes on the membrane. The formation of these holes is not caused by global PTEN deprivation, because it is reversible and may start from a high plateau of membrane-bound PTEN. The formation of PTEN holes is required for the initiation of a PIP3 wave.
Conclusion
Cells that periodically switch between a full front and a full tail state display distinct patterns of transitions from one state to the other that imply negative fluctuations of PTEN as a gating mechanism for PIP3 synthesis, and the existence of a stochastic amplification step that initiates a PIP3 wave. The spreading of a PIP3 signal as a propagated wave from a site of autocatalytic initiation is distinguished from the transmission of a signal by diffusion. First, the initiation site of a wave does not keep the highest concentration of PIP3, around which a diffusion gradient would be formed. Second, wave propagation is a self-sustained process quite different from short-range activation, as shown in Fig. 4.The temporal pattern of wave propagation is translated into a reversal of polarity. The different pathways of front to tail and tail to front transitions described here provide a framework for the analysis and modeling of mechanisms that are implicated in normal and aberrant cell motility and in changes of polarity induced by external factors such as chemoattractants (30–33).
Acknowledgments
We are grateful to Carole Parent, National Institutes of Health, for the GFP-PHcrac vector and to Peter Devreotes for PTEN-GFP cells supplied by the Dicty Stock Center (dictystocks@northwestern.edu). We thank Jana Prassler and Dirk Wischnewski, MPI for Biochemistry, for assistance in image analysis and Margaret Clarke for comments on the manuscript.
Our work was supported by a grant of the Max Planck Society to G.G. and of the Deutsche Forschungsgemeinschaft SFB 914 to A. M.-T.
The authors declare that there is no conflict of interest.
Footnotes
This is an Open Access article distributed under the terms of the Creative Commons-Attribution Noncommercial License (http://creativecommons.org/licenses/by-nc/2.0/), which permits unrestricted noncommercial use, distribution, and reproduction in any medium, provided the original work is properly cited.
Supporting Material
References
- 1.Wong K., Pertz O., Bourne H. Neutrophil polarization: spatiotemporal dynamics of RhoA activity support a self-organizing mechanism. Proc. Natl. Acad. Sci. USA. 2006;103:3639–3644. doi: 10.1073/pnas.0600092103. [DOI] [PMC free article] [PubMed] [Google Scholar]
- 2.Ridley A.J., Schwartz M.A., Horwitz A.R. Cell migration: integrating signals from front to back. Science. 2003;302:1704–1709. doi: 10.1126/science.1092053. [DOI] [PubMed] [Google Scholar]
- 3.Gerisch G., Bretschneider T., Anderson K. Mobile actin clusters and traveling waves in cells recovering from actin depolymerization. Biophys. J. 2004;87:3493–3503. doi: 10.1529/biophysj.104.047589. [DOI] [PMC free article] [PubMed] [Google Scholar]
- 4.Schroth-Diez B., Gerwig S., Gerisch G. Propagating waves separate two states of actin organization in living cells. HFSP J. 2009;3:412–427. doi: 10.2976/1.3239407. [DOI] [PMC free article] [PubMed] [Google Scholar]
- 5.Gerisch G., Ecke M., Clarke M. Self-organizing actin waves as planar phagocytic cup structures. Cell Adhes. Migr. 2009;3:373–382. doi: 10.4161/cam.3.4.9708. [DOI] [PMC free article] [PubMed] [Google Scholar]
- 6.Funamoto S., Meili R., Firtel R.A. Spatial and temporal regulation of 3-phosphoinositides by PI 3-kinase and PTEN mediates chemotaxis. Cell. 2002;109:611–623. doi: 10.1016/s0092-8674(02)00755-9. [DOI] [PubMed] [Google Scholar]
- 7.Tang M., Iijima M., Devreotes P. Disruption of PKB signaling restores polarity to cells lacking tumor suppressor PTEN. Mol. Biol. Cell. 2011;22:437–447. doi: 10.1091/mbc.E10-06-0522. [DOI] [PMC free article] [PubMed] [Google Scholar]
- 8.Vazquez F., Devreotes P. Regulation of PTEN function as a PIP3 gatekeeper through membrane interaction. Cell Cycle. 2006;5:1523–1527. doi: 10.4161/cc.5.14.3005. [DOI] [PubMed] [Google Scholar]
- 9.Parent C.A. Making all the right moves: chemotaxis in neutrophils and Dictyostelium. Curr. Opin. Cell Biol. 2004;16:4–13. doi: 10.1016/j.ceb.2003.11.008. [DOI] [PubMed] [Google Scholar]
- 10.Sasaki A.T., Janetopoulos C., Firtel R.A. G protein-independent Ras/PI3K/F-actin circuit regulates basic cell motility. J. Cell Biol. 2007;178:185–191. doi: 10.1083/jcb.200611138. [DOI] [PMC free article] [PubMed] [Google Scholar]
- 11.Kortholt A., van Haastert P.J. Highlighting the role of Ras and Rap during Dictyostelium chemotaxis. Cell. Signal. 2008;20:1415–1422. doi: 10.1016/j.cellsig.2008.02.006. [DOI] [PubMed] [Google Scholar]
- 12.Gerisch G., Ecke M., Schroth-Diez B. Different modes of state transitions determine pattern in the Phosphatidylinositide-Actin system. BMC Cell Biol. 2011;12:42. doi: 10.1186/1471-2121-12-42. [DOI] [PMC free article] [PubMed] [Google Scholar]
- 13.Diez S., Gerisch G., Bretschneider T. Subsecond reorganization of the actin network in cell motility and chemotaxis. Proc. Natl. Acad. Sci. USA. 2005;102:7601–7606. doi: 10.1073/pnas.0408546102. [DOI] [PMC free article] [PubMed] [Google Scholar]
- 14.Arai Y., Shibata T., Ueda M. Self-organization of the phosphatidylinositol lipids signaling system for random cell migration. Proc. Natl. Acad. Sci. USA. 2010;107:12399–12404. doi: 10.1073/pnas.0908278107. [DOI] [PMC free article] [PubMed] [Google Scholar]
- 15.Bretschneider T., Anderson K., Gerisch G. The three-dimensional dynamics of actin waves, a model of cytoskeletal self-organization. Biophys. J. 2009;96:2888–2900. doi: 10.1016/j.bpj.2008.12.3942. [DOI] [PMC free article] [PubMed] [Google Scholar]
- 16.Müller-Taubenberger A. Application of fluorescent protein tags as reporters in live-cell imaging studies. Methods Mol. Biol. 2006;346:229–246. doi: 10.1385/1-59745-144-4:229. [DOI] [PubMed] [Google Scholar]
- 17.Fischer M., Haase I., Müller-Taubenberger A. A brilliant monomeric red fluorescent protein to visualize cytoskeleton dynamics in Dictyostelium. FEBS Lett. 2004;577:227–232. doi: 10.1016/j.febslet.2004.09.084. [DOI] [PubMed] [Google Scholar]
- 18.Iijima M., Devreotes P. Tumor suppressor PTEN mediates sensing of chemoattractant gradients. Cell. 2002;109:599–610. doi: 10.1016/s0092-8674(02)00745-6. [DOI] [PubMed] [Google Scholar]
- 19.Insall R., Kuspa A., Devreotes P. CRAC, a cytosolic protein containing a pleckstrin homology domain, is required for receptor and G protein-mediated activation of adenylyl cyclase in Dictyostelium. J. Cell Biol. 1994;126:1537–1545. doi: 10.1083/jcb.126.6.1537. [DOI] [PMC free article] [PubMed] [Google Scholar]
- 20.Dormann D., Weijer G., Weijer C.J. In vivo analysis of 3-phosphoinositide dynamics during Dictyostelium phagocytosis and chemotaxis. J. Cell Sci. 2004;117:6497–6509. doi: 10.1242/jcs.01579. [DOI] [PubMed] [Google Scholar]
- 21.Loovers H.M., Kortholt A., van Haastert P.J. Regulation of phagocytosis in Dictyostelium by the inositol 5-phosphatase OCRL homolog Dd5P4. Traffic. 2007;8:618–628. doi: 10.1111/j.1600-0854.2007.00546.x. [DOI] [PubMed] [Google Scholar]
- 22.Bretschneider T., Diez S., Gerisch G. Dynamic actin patterns and Arp2/3 assembly at the substrate-attached surface of motile cells. Curr. Biol. 2004;14:1–10. doi: 10.1016/j.cub.2003.12.005. [DOI] [PubMed] [Google Scholar]
- 23.Postma M., Roelofs J., Van Haastert P.J. Sensitization of Dictyostelium chemotaxis by phosphoinositide-3-kinase-mediated self-organizing signalling patches. J. Cell Sci. 2004;117:2925–2935. doi: 10.1242/jcs.01143. [DOI] [PubMed] [Google Scholar]
- 24.Hecht I., Skoge M.L., Rappel W.J. Activated membrane patches guide chemotactic cell motility. PLoS Comput. Biol. 2011;7:e1002044. doi: 10.1371/journal.pcbi.1002044. [DOI] [PMC free article] [PubMed] [Google Scholar]
- 25.Charest P.G., Firtel R.A. Feedback signaling controls leading-edge formation during chemotaxis. Curr. Opin. Genet. Dev. 2006;16:339–347. doi: 10.1016/j.gde.2006.06.016. [DOI] [PubMed] [Google Scholar]
- 26.Meier-Schellersheim M., Xu X., Germain R.N. Key role of local regulation in chemosensing revealed by a new molecular interaction-based modeling method. PLoS Comput. Biol. 2006;2:e82. doi: 10.1371/journal.pcbi.0020082. [DOI] [PMC free article] [PubMed] [Google Scholar]
- 27.Das S., Dixon J.E., Cho W. Membrane-binding and activation mechanism of PTEN. Proc. Natl. Acad. Sci. USA. 2003;100:7491–7496. doi: 10.1073/pnas.0932835100. [DOI] [PMC free article] [PubMed] [Google Scholar]
- 28.Vazquez F., Matsuoka S., Devreotes P.N. Tumor suppressor PTEN acts through dynamic interaction with the plasma membrane. Proc. Natl. Acad. Sci. USA. 2006;103:3633–3638. doi: 10.1073/pnas.0510570103. [DOI] [PMC free article] [PubMed] [Google Scholar]
- 29.Markevich N.I., Tsyganov M.A., Kholodenko B.N. Long-range signaling by phosphoprotein waves arising from bistability in protein kinase cascades. Mol. Syst. Biol. 2006;2:61. doi: 10.1038/msb4100108. [DOI] [PMC free article] [PubMed] [Google Scholar]
- 30.Altschuler S.J., Angenent S.B., Wu L.F. On the spontaneous emergence of cell polarity. Nature. 2008;454:886–889. doi: 10.1038/nature07119. [DOI] [PMC free article] [PubMed] [Google Scholar]
- 31.Gamba A., Kolokolov I., Ortenzi G. Universal features of cell polarization processes. J. Stat. Mech. 2009;2009:P02019. [Google Scholar]
- 32.Onsum M.D., Rao C.V. Calling heads from tails: the role of mathematical modeling in understanding cell polarization. Curr. Opin. Cell Biol. 2009;21:74–81. doi: 10.1016/j.ceb.2009.01.001. [DOI] [PMC free article] [PubMed] [Google Scholar]
- 33.Jilkine A., Edelstein-Keshet L. A comparison of mathematical models for polarization of single eukaryotic cells in response to guided cues. PLoS Comput. Biol. 2011;7:e1001121. doi: 10.1371/journal.pcbi.1001121. [DOI] [PMC free article] [PubMed] [Google Scholar]
Associated Data
This section collects any data citations, data availability statements, or supplementary materials included in this article.