

Abstract
The packing structures of transmembrane helices are traditionally attributed to patterns in residues along the contact surface. In this view, besides keeping the helices confined in the membrane, the bilayer has only a minor effect on the helices structure. Here, we use two different approaches to show that the lipid environment has a crucial effect in determining the cross-angle distribution of packed helices. We analyzed structural data of a membrane proteins database. We show that the distribution of cross angles of helix pairs in this database is statistically indistinguishable from the cross-angle distribution of two noninteracting helices imbedded in the membrane. These results suggest that the cross angle is, to a large extent, determined by the tilt angle of the individual helices. We test this hypothesis using molecular simulations of a coarse-grained model that contains no specific residue interactions. These simulations reproduce the same cross-angle distribution as found in the database. As the tilt angle of a helix is dominated by hydrophobic mismatch between the protein and surrounding lipids, our results indicate that hydrophobic mismatch is the dominant factor guiding the transmembrane helix packing. Other short-range forces might then fine-tune the structure to its final configuration.
Introduction
Membrane proteins (MPs) are crucial players in many cellular processes, including the transport of ions across cell membranes as well as numerous signaling pathways. The folding of membrane proteins into functioning units has been proposed to proceed in two stages (1). In the first stage, secondary structure elements of the protein, comprising mostly of stable transmembrane (TM) α-helices, are generated by ribosomes and inserted into the membrane through the translocon complex (2). The second stage involves packing of these α-helices into their tertiary and quaternary structures inside the membrane environment.
One of the simplest structural characteristics that form in the second stage of the folding process is the helix-helix pairwise packing. Several studies have shown that the packing of TM helices could have functional consequences for membrane proteins (3–5), which has motivated theoretical research to give a molecular explanation of this packing. Most theoretical models explain the observed packing in terms of steric surface matching; the residues of one α-helix fit into the holes left between the residues of the paired α-helix (6,7). This steric fit determines the cross angle between the helices’ major axes. Motifs of repeating small residues along the surface of TM helices, which would provide a characteristic pattern of holes, were thought to support this idea (8–11). Walters and DeGrado (12) further showed that two-thirds of TM helix pairs found in the protein database classify into a small set of subcategories, with each subcategory having a characteristic side-chain packing motif. Based on this observation, Walters and DeGrado concluded that specific residue interactions control the helix-helix cross angle.
These previous theories explain the TM helix packing angles based on protein-protein interactions alone and assume that the surrounding membrane has little to no role in shaping the structure of MPs. Recent studies have indicated, however, that the functional activity of many membrane proteins depends on the properties of the membrane, such as lipid composition and thickness (13,14). Examples include the nicotinic acetylcholine receptor (15), the thermosensor protein DesK (16,17), and the cation/sugar symporter MelB (18), as well as other proteins (see Table 1 in Andersen and Koeppe (19)). These results suggest that various characteristics of the membrane environment could modulate the function of proteins by determining their structure and dynamics. Based on the examples presented in the literature (15–18), Holt and Killian (13) propose that MPs have an optimal bilayer thickness for their functioning. A nonoptimal thickness, they hypothesize, can lead to changes in the structure and orientation of transmembrane units, which can, in turn, lead to changes in protein functionality.
As of this writing, we have very little understanding of the role of the membrane on helix-helix packing. Hydrophobic mismatch, the difference in length between the hydrophobic medium of the lipid bilayer and the hydrophobic span of the protein, has been proposed as a major determinant of TM helix configurations. In general, this feature determines the extent to which the membrane is perturbed by the presence of a protein. If a protein in the membrane has a positive hydrophobic mismatch, for example, either the membrane locally thickens or the protein tilts to minimize the hydrophobic interactions. Studies have shown that hydrophobic mismatch is also a good indicator of the driving force of the oligomerization of helical peptides (20–26). In addition, hydrophobic mismatch is also an important determinant of the helical tilt within a membrane (13,24,27–30). Studies show that proteins with a large hydrophobic mismatch have a larger tilt angle with respect to the normal of the bilayer. Proteins with a negative mismatch behave differently. In these cases it is important to distinguish between proteins that are truly transmembrane, i.e., the hydrophilic ends are in contact with water, and those that are fully in the hydrophobic region of the membrane. For the first group the tilt will be close to zero (30), whereas for the latter the orientation will be random.
These findings show that lipid-protein interactions can have a large effect on the tilt angles and interactions of membrane α-helices. As of this writing, however, we have very little insight regarding the role of the membrane in the details of the folding process. In this article, we study the role of the surrounding membrane in the formation of the TM helix-helix packing. Inspired by the importance of hydrophobic mismatch in describing helix-helix interactions, we analyze an extensive database (Orientations of Proteins in Membranes, OPM) (31) containing a large number of experimental MP structures to investigate whether or not helix packing angles are correlated to the hydrophobic mismatch. Surprisingly, our analysis shows that packing angles of TM helices can be explained sufficiently by the hydrophobic mismatch. This indicates that, even in the absence of any specific protein-protein interactions, the TM helix packing is dictated by the hydrophobic mismatch of the proteins.
Experimentally, it is not possible to test this hypothesis. Instead, we used molecular simulations on model membranes to study these effects. Psachoulia et al. (32,33) have used molecular simulations to explore the cross angle and aggregation of helix dimers such as glycophorin A and the TM part of the integrin heterodimer. In this work, to study cross-angle distributions in the case of no specific interactions, we focus on more-generic TM helices with no specific residues defined. Therefore, whereas in previous computational and theoretical studies it is assumed that the role of the membrane can be ignored, in our simulations, we take the other extreme view; the role of specific interactions is ignored.
By comparing the results of these simulations with the experimental results of the OPM database, we obtain more insights on the relative importance of these membrane-mediated interaction and the direct interactions between the proteins.
Methods
In our discussion below, we use the term “experimental” to refer to results relating to data retrieved from the OPM database and use the term “simulated” to refer to results of our CG model.
Database analysis
For the experimental TM helix packing, we use the recently established Orientations of Proteins in Membranes (OPM) database (31). This database provides information not only on the protein structures, but also on the thickness of the membranes in which they were imbedded.
Our analysis of the OPM database consists of the following steps: First, we identify all transmembrane segments for each protein. Second, for those TM segments that have a helical structure, we define their orientation and hydrophobic mismatch. Third and finally, we identify those transmembrane helices that are in direct contact (neighboring pairs). For these pairs, we can then determine the cross angle. From a total of 261 MPs, we determined a little over 2300 cross angles.
A detailed description of how the set of structures was gathered can be found in the Supporting Material, though we highlight several important criteria here. We exclude helices with <9 residues and helices that have a kink. We also eliminate those helices that have extremely small or large hydrophobic mismatches (4% of experimentally observed helices). In addition, some proteins have several identical subunits. Because these helices would lead to double counting, we label identical helices as “nonunique” if a similar (i.e., “unique”) helix has already been identified. Consideration of the cross angle between helix pairs was restricted to pairs in which at least one of the helices is unique. Helices with a low number of contacts per residue were defined as peripheral helices with minimal helix-helix interactions.
By the aforementioned process, we extract 3002 helices from 261 unique transmembrane proteins in the OPM database. Of this set, 1542 were defined as unique with 224 of these defined as peripheral helices. We obtained a total number of 17,695 pairs of helices, with 2328 of them (13%) as neighboring pairs.
Coarse-grained simulations
To study TM helix packing in a system without direct protein-protein interactions, we use molecular simulations of a mesoscopic model of TM helix and lipid. We base our model on the lipid model of Kranenburg et al. (34–36) and its extension to TM proteins by de Meyer et al. (23) and Venturoli et al. (37). Kranenburg et al. have shown that such coarse-grained models give a surprisingly realistic description of the phase behavior of lipid bilayers. de Meyer et al. used this model to study the tilt of TM peptides as a function of the hydrophobic mismatch, and Venturoli et al. studied the membrane-mediated interactions between two TM peptides. We have extended the protein model of Venturoli et al. (37) to a CG model of a transmembrane helix.
Our model consists of a helical core of hydrophobic beads confined by two hydrophilic caps that keep both ends imbedded in the hydrophilic part of the membrane or in water. The protein has a helical geometry with a radius and pitch corresponding to a typical α-helix. The beads of the protein all have the same size but their interactions depend on whether they are hydrophilic or hydrophobic. No assumptions have been made in this model about the nature of the helix residues, as all beads are equivalent aside from their hydrophobicity (see Fig. 1).
Figure 1.
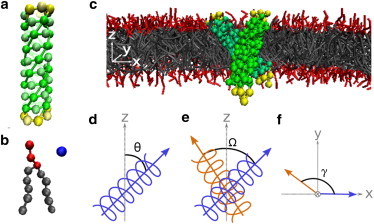
Coarse-grained model and angle definitions. (a) CG model of an α-helix assembled from hydrophobic beads at the core and hydrophilic beads at both ends to keep the helix transmembrane. Helical geometry is maintained by harmonic springs, angle springs, and dihedral angle potentials of principal helix beads (see the Supporting Material for details). (b) CG lipid model includes three hydrophilic headgroups and two five-bead hydrophobic tails. Water is represented explicitly by a single bead. All beads in the system are of the same size and correspond to ∼3 carbon atoms/water molecules. (c) Two positive mismatched helices in a typical crossed configuration (note that, for clarity, water particles are not displayed). (d) Tilt angle, θ, of a helix is defined as the angle between the helix major axis (blue arrow) and the bilayer normal, . (e) Cross angle, Ω, is defined as the dihedral angle between the major axes of the two helices (blue and orange arrows). (f) Projection angle, γ, is defined as the angle between the major helix axes along the plain of the bilayer .
Our lipid model consists of three hydrophilic head beads connected to two five-bead hydrophobic tails. This lipid model faithfully reproduces the phase diagram of a bilayer-forming lipid such as dimyristoylphosphatidylcholine (34). All beads in the system are of the same size and correspond to approximately three carbon atoms or three water molecules.
We simulated these systems using hybrid Monte Carlo Dissipative Particle Dynamics (38,39), such that we sample the NP⊥γT ensemble. This ensemble mimics an experimental system for which the temperature and pressure are kept constant, and for which the membrane has a tensionless state (40). Our system contains more than 2000 lipids and we simulated at least 5⋅105 steps. Further details on the model and simulation technique are provided in the Supporting Material.
Hydrophobic mismatch calculations
We define hydrophobic mismatch, Δd, as the difference between the hydrophobic length of a helix, dH, and the hydrophobic thickness of a membrane, dL, such that Δd = dH − dL.
Experimental data
For MPs obtained from the OPM database, we used the effective membrane hydrophobic thickness as reported in the database. We therefore rely on the membrane thickness estimations made by Lomize et al. (41,42). In their calculations, Lomize et al. (41,42) used the free energy of transferring a protein between water and a hydrophobic region to construct the membrane hydrophobic thickness around a given protein. It is important to note that most experimental structures of MPs required the usage of a detergent that is necessary for the crystallization process. These detergents are assumed to maintain the protein structure. We therefore used the membrane hydrophobic thickness as reported in OPM to determine the effective membrane hydrophobic thickness. This provides a reasonable representation of the membrane environment of the protein at equilibrium, rather than the temporary detergent environment.
To determine the helix hydrophobic length of OPM-extracted helices, we use a nonlocal hydrophobicity score. For each residue i in a TM helix, we calculate a local hydrophobicity score, , based on the Kyte and Doolittle hydrophobicity scale (43). We then calculate the nonlocal hydrophobicity score for each residue by a weighted average of the local scores in a window of five surrounding residues (including the residue under study here and the two adjacent residues on either side). The weights were calculated by a Gaussian of mean zero and standard deviation of one residue. The nonlocal score of residue i, , is therefore computed by This nonlocal score prevents a single isolated hydrophilic residue in the middle of the helix from being seen as a hydrophilic end.
We define the hydrophobic helix core by extending or decreasing the range of helical residues to include only hydrophobic-scored ( > −0.02) residues at both ends. The total range of residues in the hydrophobic core of the helix determines the helix hydrophobic length, dH, as described in the Supporting Material.
We note here that the membrane hydrophobic thickness, dL, is different for each protein and therefore the hydrophobic mismatch of each helix, Δd, differs from the helix length, dH.
Simulations data
In our coarse-grained simulations, we calculate the membrane hydrophobic thickness by using the standard method of fitting the density profile of the hydrophobic beads to a Gaussian error function (44). The bilayer thickness in our model was calculated to be dL = 26.77 Å or 28.12 Å for a lipid model of five or six beads, respectively. The density profile is provided in Fig. S1 in the Supporting Material. We note here that for the experimental results, the value reported by OPM for the membrane hydrophobic thickness corresponds to the distance between the lipid carbonyl groups. This value differs from the middle points of Gaussian error functions describing the distribution of lipid hydrocarbon groups by a simple linear shift of 0.8 Å (42). This shift was applied to the experimental results in the OPM database.
The number of CG hydrophobic beads determines the hydrophobic length of the helix, dH. Each hydrophobic bead corresponds to one helix residue with a distance of 1.5 Å between each consecutive residue. To calculate the hydrophobic length we add half a bond length (0.75 Å) in each direction such that the cutoff of hydrophobic residues is in the middle of the bond between the hydrophobic and hydrophilic size of the membrane. The value dH is therefore equal to dH = NHB ⋅ 1.5 Å, where NHB is the number of hydrophobic beads in the helix. The hydrophobic mismatch, Δd, is then calculated similarly to the experimental case.
Results and Discussion
Tilt angles
For the 1542 unique helix structures in the OPM database, we computed the tilt angle as a function of the hydrophobic mismatch. The tilt angle, θ, was calculated as the angle between the helix major axis and the bilayer normal vector, (see Fig. 1). For a given value of the hydrophobic mismatch, we observe a distribution of different angles. In Fig. 2 we represent this distribution by plotting the average and standard deviation. For positive mismatch we observe that the tilt increases with hydrophobic mismatch. Such a trend has also been observed for WALP and KALP peptides (13,30,45) and in simulations of our coarse-grained model (see Fig. 2).
Figure 2.
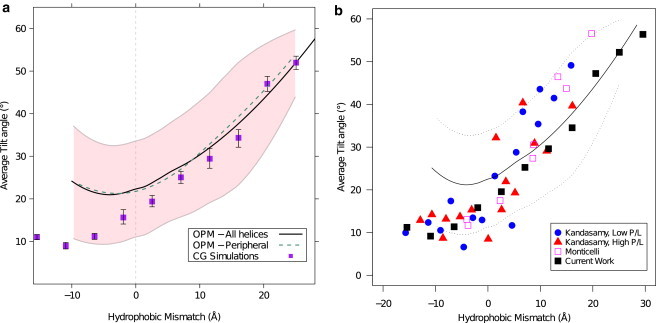
Average tilt angle as function of hydrophobic mismatch. (a) Compares tilt angle for all unique TM helices (black line) with peripheral unique TM helices (dashed green line, see text) as obtained from the experimental data in the OPM database with CG simulation of hydrophobic helices in a lipid bilayer (purple squares). The experimental data in the OPM database give a distribution of tilt angles represented by (solid line) for the average, and (pink shading) for 1 SD (fit and SD were obtained by the LOESS method (49)). The simulated CG results are an average from system of both five-bead and six-bead tail lipids, representing two membranes with different hydrophobic thicknesses, with error-bars representing the error in average values of both systems. (b) Further compares our simulation (black squares) and OPM experimental data (black line, standard deviation represented by dashed lines) with previously published simulation results for KALP peptides. Results by Kandasamy and Larson (30) are shown for low (blue circles) and high (red triangles) protein to lipid ratio. (Magenta squares) Results of coarse-grained simulations by Monticelli et al. (45).
For negative mismatch, the OPM data show a minima for a mismatch of Δd ≈ −2 Å. These results disagree with our CG simulations and simulation of KALP peptides for negative mismatch. At this point it is important to recall that in our model, the interactions are chosen such that even for negative mismatch the hydrophilic ends of the helix are in contact with the hydrophilic part of the membrane (or water). Hence, for these systems tilt will be energetically unfavorable (13,30). Our model is consistent with the results for WALP and KALP peptides, for which the hydrophilic part of a helix, even for negative mismatch, is in contact with the hydrophilic part of the membrane or in the water phase (29,45). Most helices with negative mismatch in the OPM database, however, are not capped by hydrophilic regions, but rather are continued by hydrophobic nonhelical chains. Hence, for these helices, changing the tilt does not change the energy and the orientation of such helices is expected to be random. Because of these differences we focus in the remainder of this article on the cross angle of positive hydrophobic mismatch helices.
The results for KALP peptides, as seen in Fig. 2 b, have a larger slope of tilt angle versus hydrophobic mismatch compared to the OPM data and our CG simulations. In our CG model, we chose the size of the hydrophilic part of the helix (three residues) to match the hydrophilic part of the membrane. Natural helices from the OPM database often have a chain of several hydrophilic residues at both sides of the helix. KALP peptides, on the other hand, contain only two hydrophilic residues. In the absence of hydrophilic residues to match the hydrophilic part of the membrane, the energetic balance between the hydrophobic mismatch and the counterhydrophilic mismatch is shifted such that the hydrophobic mismatch might be more pronounced. In that case we expect to observe a larger tilt angle with similar hydrophobic mismatch.
While analyzing the database, we observed a strong mirror-effect for parallel versus antiparallel helices. Namely, the distribution of tilt angle and cross angle was similar for all helices, regardless of their C- to N-terminus orientation. Evidence for this effect is shown in Fig. S2. Therefore, we follow the definition given by Chothia et al. (46) and treat all helices as vectors pointing toward the +z-direction along the calculated helix axis. All our results are reported using this convention.
We find a surprising trend in the subset of peripheral helices (14% of helices). As these helices are mainly at the outer regions of the protein, one would expect the effect of the lipid bilayer on the tilt to be more pronounced, whereas for the nonperipheral helices the helix-helix interactions would dominate. Instead, we observe the tilt of these peripheral helices to be similar (Fig. 2 a, dashed green line). This suggests that the presence of another helix nearby is of a lesser importance to the tilt than the presence of the surrounding bilayer.
We note here that our results for the tilt angle of OPM helices depend on the membrane thickness as determined in the OPM database (see Methods). As the definition of the membrane thickness is somewhat arbitrary, a different definition of the membrane thickness could lead to quantitative changes in the tilt angle trend. Yet we expect that the qualitative behavior of the tilt angle with respect to hydrophobic mismatch would not change.
Cross-angle distributions
Reference cross-angle distribution
Bowie (47) showed that there are significant statistical biases that have to be taken into account when referring to interaxial angles of packed α-helices. Namely, using geometric considerations one can show that the number of configurations available to a pair of helices with a fixed cross angle depends on the value of that cross angle. This leads to a nonflat cosine-like distribution of cross angles. Bowie (48) further explored this effect by analyzing the packing of membrane proteins. However, at that time the number of resolved membrane protein structures was too small to study this effect.
When studying the cross-angle distribution we also have to account for a statistical bias that originates from the fact that the cross and tilt angles are not independent. To see this, consider a pair of helices with corresponding tilt angles θ1 and θ2. The cross angle, Ω, is defined as the dihedral angle between the two major axes of the helices. We denote γ, the angle between the helix vectors along the plane of the bilayer , as the projection angle (See Fig. 1, d–f, for angle definitions). Simple geometrical considerations give the following relationship:
| (1) |
This relation confines the cross angle to the range |θ1 − θ2| ≤ |Ω| ≤ |θ1 + θ2| and displays a nonuniform Arcsine-like distribution within that range. This distribution displays two sharp peaks at |Ω| = |θ1 − θ2| and |Ω| = |θ1 + θ2| (see Fig. 3, dashed line). The importance of this relation is that even for a pair of helices that are so far apart in the membrane that they do not interact, we see a limited set of possible cross angles between these helices. For helices with smaller tilt angles we will observe a smaller cross angle and for a pair of helices with larger tilt angles we will observe a larger one. The cross angle is also expected to be larger for a case of large difference in tilt angles (|θ1 − θ2| ≫ 0) and to display a smaller value for similar tilt angles (|θ1 − θ2| ∼ 0).
Figure 3.
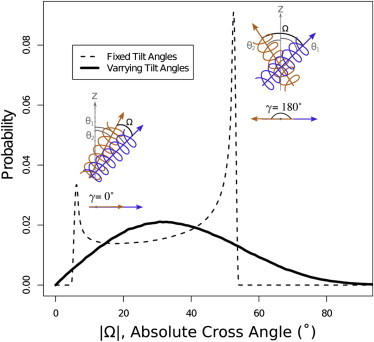
Reference cross-angle (Ω) distribution. (Dashed line) Reference cross-angle distribution of two helices with fixed tilt angles, and , and random projection angle, γ; (solid line) reference cross-angle distribution of two helices with normally distributed tilt angles with mean , and standard deviation σ1, σ2, respectively. These mean and standard deviation values correspond to the experimental tilt angles at hydrophobic mismatch ranges Δd1 = 30 Å and Δd2 = 10.0 Å, respectively, as extracted from Fig. 2a. These amount to = 23.6°, = 29.4°, σ1 = 11.3°, and σ2 = 12. 4°. A schematic sketch of helices is provided for both extremes of γ = 0° and γ = 180°.
For fixed tilt angles of the two helices, the projection angle between the helices, γ, is the only independent variable controlling the cross angle of the two helices. For noninteracting helices, the tilt angles are uncorrelated and this projection angle is uniformly distributed. Taking this into consideration, we calculate the distribution of cross angles in the OPM database for the case that the two helices would not interact. For a given mismatch, we assume a Gaussian distribution of tilt angles, where the mean and variance of the distribution follow from the data in Fig. 2 a. We sample a large number of tilt angles from these distributions for each helix and uniformly sample the projection angle. We calculate the resulting cross angles using Eq. 1. Each pair of fixed tilt angles will impose a cross-angle distribution as shown in Fig. 3 (dashed line), and the overall distribution will be a weighted average of these individual distribution. The solid line in Fig. 3 is an example of such a distribution for a pair of helices drawn from the distribution corresponding to hydrophobic mismatches of 3 Å and 10 Å. This figure illustrates that, even in absence of any interactions between the helices, we obtain a dependence of the cross angle on the hydrophobic mismatch. To compute the reference distribution of cross angles for all neighboring helix pairs in the OPM database, we repeat this procedure for all possible mismatches of pairs of helices, (Δd1; Δd2).
Experimental cross-angle distribution
We calculated the cross angle between all pairs of helices within the same protein in the OPM database. In determining the cross angle one can distinguish between a right- and left-handed angles (46). The histograms of left- and right-handed cross angles are close in absolute value (see Fig. 4) and there is no major difference in preference for a right- or left-handed orientation. Therefore, in the remainder of this section we use absolute cross-angle values, which allow us to improve the statistics.
Figure 4.
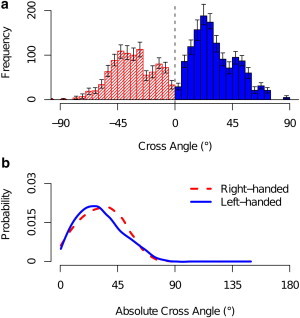
Comparison of right- and left-handed experimental cross angles. (a) Frequency of cross angles along the entire range Ω ∈ [−90°, 90°] for right-handed (striped red) and left-handed (solid blue) cross angles. Error bars represent 0.9 confidence intervals. (b) Absolute cross-angle distribution for right-handed (dashed red) and left-handed (solid blue) cross angles, in which all helix vectors are treated as pointing toward +z direction and the angle between those vectors is calculated by a simple dot product (see Methods). The mean standard deviation around the density lines is 0.006.
To determine the extent to which the OPM distribution differs from the one for noninteracting helices, we first divided the pairs of helices into groups based on their hydrophobic mismatch. We then analyzed the cross-angle distribution of two representative groups of neighboring helix pairs (see the Supporting Material for details):
and
In Fig. 5 the OPM data are compared with the noninteracting reference curve. Surprisingly, this comparison shows no significant differences between the two distributions. The notion that the cross-angle distribution is not determined by the helix-helix interaction but determined by the orientation of the helices in the membrane is further illustrated by a comparison with the distribution obtained from our molecular simulations using a similar mismatch:
and
Fig. S4 and Fig. S5 further illustrates the change in mean cross angle as a function of the hydrophobic mismatch and tilt of both helices.
Figure 5.
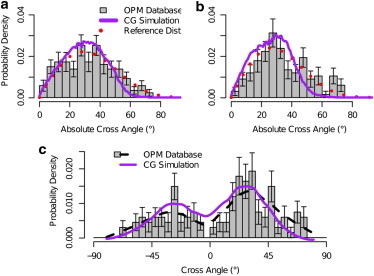
Comparison of cross-angle distributions. (Gray boxes) Experimental cross-angle distribution; (purple curves) simulated cross-angle distribution; and (red dotted lines) reference cross-angle distribution. The reference distribution is based on the tilt angle distribution of the helices’ mismatch as extracted from Fig. 2. (a) Absolute cross angle of pairs of neighboring helices with hydrophobic mismatches in the ranges Δd1 ∈ (2,5] Å and Δd2 ∈ (4,7] Å compared to simulated helices of mismatch Δd = 3.2 Å, 7.7 Å, respectively. (b) Experimental neighboring pairs in ranges Δd1 ∈ (0,3] Å and Δd2 ∈ (0,3] Å compared to simulated helices of mismatch Δd = 3.2 Å, 3.2 Å, respectively. (c) Full cross-angle distribution (and not the absolute one) for the same set used in plot b. Error bars in all three plots represent 0.9 confidence intervals.
To quantitatively test that the OPM distribution and our reference distributions are statistically equivalent over all hydrophobic mismatch ranges, we used our generated reference distributions for each helix pair to obtain the overall expected histogram of all helix pairs. We calculated the overall p-value of all helix pairs. This provides a measurement of how probable it is that the observed cross angles originate in the reference cross-angle distribution. Comparing the overall p-value to a p-value obtained for a set of random cross angles sampled directly from the reference distribution shows that the experimental p-value (0.497) is well within the standard error of the random p-value (0.500 ± 0.006). This suggests that it is statistically probable that the experimental cross-angle distribution was in fact generated by the model in Eq. 1. See the Supporting Material for further details.
Using the overall reference histogram, one can obtain a direct comparison for cross-angle values that are over- or underrepresented in the experimental results. The degree to which each cross-angle probability differs from its probability in the reference distribution can be used as a measure for what specific interactions and other membrane effects are imposing upon the helices. Results for the comparison of the overall cross angle are presented for both the probability density (Fig. 6 a) and the difference in log of probabilities (Fig. 6 b). Because most helix pairs (97%) are from structures with reported crystallization or experimental temperature in the small range T = 275–300 K (see Table S2 in the Supporting Material), the difference in log probabilities is close to the difference in free energy, up to a factor of kBT. These results show that the differences in log(P) are rather small, and show an overrepresentation of experimental cross angles in range −10° ≤ Ω ≤ 30° and an underrepresentation in ranges −25° < Ω < −15°, 37° < Ω < 47°, and 58° < Ω < 65° over the entire error bar span.
Figure 6.
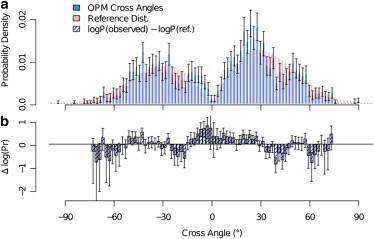
Comparison of cross-angle distribution of all neighboring helix pairs with the reference distribution based on their respective mismatches. (a) Distribution of all neighboring pairs (blue, with 0.9 confidence intervals as error bars) compared to the overall reference distribution (pink; see text). (b) Difference in log of probabilities between the two sets. Equivalent to the difference in estimated free energies. The plot shows higher tendency for small cross angles (−10° ≤ Ω ≤ 30°) than expected by the reference distributions and lower than expected tendency for larger cross angles absolute values (−25° < Ω < −15°), (37° < Ω < 47°), and (58° < Ω < 65°). Error bars represent 0.9 confidence intervals obtained by a 500-resample bootstrap (50) on the values of experimental cross angles. Data are omitted for |Ω| > 75° due to large uncertainty.
Deviations from the reference distribution can arise from a nonuniform distribution of projection angles. In the OPM data, we observe a tendency toward small projection angles (γ ≤ 100) as presented in Fig. 7. This tendency was also observed in our CG simulations and was seen to vary with hydrophobic mismatch. This trend toward smaller projection angles corresponds to a trend toward smaller cross angles. We hypothesize that these deviations are due to the membrane applying effective force to minimize the amount of constrained lipids between the two helices. Because we observe similar deviations in both experimental and simulated results, it is unlikely that this effect originates in specific residue interactions because they are not included in our simulations. Other deviations from the reference distribution can arise from correlations in tilt angle between the two helices. In our CG simulations we observe a time-averaged correlation coefficient ranging from 0.03 for negative mismatch (Δd = −15, −15 Å) and up to 0.52 for extremely positive mismatch (Δd = 26, 26 Å). We note that theses two effects are not independent, but as both effects are present in our CG model that does not resolve specific residues, it is unlikely that they originate in specific residue interactions.
Figure 7.
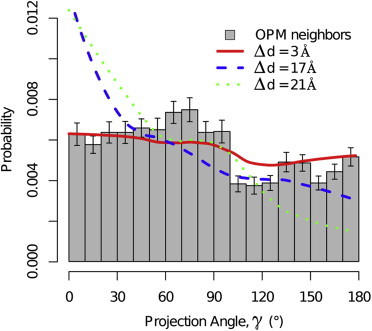
Histogram of experimental projection angles of neighboring helices (gray boxes) shows tendency toward lower (γ < 100°) angles with p-value <0.0001 (based on a binomial test). (Lines) Representative projection angle histograms from CG simulations; each line corresponds to a different pair of same-mismatch helices: Δd = 3 Å (red solid), 17 Å (blue dashed), and 21 Å (green dotted). These show that the trend of overpopulation of lower projection angles is observed in simulations as well and varies in strength and shape with mismatch. Error bars represent 0.9 confidence intervals in experimental projection-angle histogram.
Conclusion
Our findings show that even in the absence of any specific interactions, the cross-angle distribution of TM helices is not uniform. Some angles are more preferable than others. The distribution of cross angles depends on the hydrophobic mismatch of the individual helices, through its effect on the tilt angle. Therefore, special care has to be taken when considering a set of TM helix pairs and attributing their cross-angle distribution to specific interactions. The observed distribution of cross angles should first be compared with the reference distribution. Only statistically meaningful deviations from the reference distribution point toward direct influence of specific interactions on the packed configuration.
It is interesting to discuss the consequences of our observations in the context of the folding mechanisms of membrane proteins. Previous studies on mesoscopic models show that membrane-mediated interactions lead to long-range attractive forces between helices. These forces depend only on the hydrophobic mismatch (23) and do not rely on specific interactions. The importance of these membrane-mediated interactions is that they are very robust and, unlike specific interactions, do not rely on the helices to be in an ideal orientation such that the surface motifs can interact. The surprising result of this study is that the same hydrophobic mismatch can guide the cross angle. Hence, the forces that constrain the cross angle of the helices are also robust. We therefore see the membrane playing a role in all aspects of the second stage of protein folding—from helix association to tertiary structure determination.
It is important to emphasize that our results do not suggest that specific interactions are not important in the folding of a membrane protein. The picture that emerges from this study is that membrane-mediated interactions play an important role in keeping the helices together and ensuring the helices have a stable cross angle. Hence, we hypothesize that membrane-mediated interactions put the helices in an ideal position for the short-ranged specific interactions to take over and finalize the folding.
Acknowledgments
We thank Jocelyn M. Rodgers for many fruitful discussions, James. U. Bowie for useful advice, and Christopher J. Ryan for careful proofreading of this text.
This research was supported by grant FWP-SISGRKN from the Chemical Sciences, Geosciences and Biosciences Division, Office of Basic Energy Sciences, Office of Science, U.S. Department of Energy.
Supporting Material
References
- 1.Popot J.L., Engelman D.M. Membrane protein folding and oligomerization: the two-stage model. Biochemistry. 1990;29:4031–4037. doi: 10.1021/bi00469a001. [DOI] [PubMed] [Google Scholar]
- 2.White S.H., von Heijne G. The machinery of membrane protein assembly. Curr. Opin. Struct. Biol. 2004;14:397–404. doi: 10.1016/j.sbi.2004.07.003. [DOI] [PubMed] [Google Scholar]
- 3.Cymer F., Schneider D. Transmembrane helix-helix interactions involved in ErbB receptor signaling. Cell Adhes. Migr. 2010;4:299–312. doi: 10.4161/cam.4.2.11191. [DOI] [PMC free article] [PubMed] [Google Scholar]
- 4.Li E., Hristova K. Receptor tyrosine kinase transmembrane domains: function, dimer structure and dimerization energetics. Cell Adhes. Migr. 2010;4:249–254. doi: 10.4161/cam.4.2.10725. [DOI] [PMC free article] [PubMed] [Google Scholar]
- 5.Liang J. Experimental and computational studies of determinants of membrane-protein folding. Curr. Opin. Chem. Biol. 2002;6:878–884. doi: 10.1016/s1367-5931(02)00393-9. [DOI] [PubMed] [Google Scholar]
- 6.Crick F.H.C. The packing of α-helices—simple coiled-coils. Acta Crystallogr. 1953;6:689–697. [Google Scholar]
- 7.Langosch D., Heringa J. Interaction of transmembrane helices by a knobs-into-holes packing characteristic of soluble coiled coils. Proteins. 1998;31:150–159. doi: 10.1002/(sici)1097-0134(19980501)31:2<150::aid-prot5>3.0.co;2-q. [DOI] [PubMed] [Google Scholar]
- 8.Fleming K.G., Ackerman A.L., Engelman D.M. The effect of point mutations on the free energy of transmembrane α-helix dimerization. J. Mol. Biol. 1997;272:266–275. doi: 10.1006/jmbi.1997.1236. [DOI] [PubMed] [Google Scholar]
- 9.MacKenzie K.R., Prestegard J.H., Engelman D.M. A transmembrane helix dimer: structure and implications. Science. 1997;276:131–133. doi: 10.1126/science.276.5309.131. [DOI] [PubMed] [Google Scholar]
- 10.Kim S., Jeon T.J., Bowie J.U. Transmembrane glycine zippers: physiological and pathological roles in membrane proteins. Proc. Natl. Acad. Sci. USA. 2005;102:14278–14283. doi: 10.1073/pnas.0501234102. [DOI] [PMC free article] [PubMed] [Google Scholar]
- 11.Sal-Man N., Gerber D., Shai Y. Specificity in transmembrane helix-helix interactions mediated by aromatic residues. J. Biol. Chem. 2007;282:19753–19761. doi: 10.1074/jbc.M610368200. [DOI] [PubMed] [Google Scholar]
- 12.Walters R.F.S., DeGrado W.F. Helix-packing motifs in membrane proteins. Proc. Natl. Acad. Sci. USA. 2006;103:13658–13663. doi: 10.1073/pnas.0605878103. [DOI] [PMC free article] [PubMed] [Google Scholar]
- 13.Holt A., Killian J.A. Orientation and dynamics of transmembrane peptides: the power of simple models. Eur. Biophys. J. 2010;39:609–621. doi: 10.1007/s00249-009-0567-1. [DOI] [PMC free article] [PubMed] [Google Scholar]
- 14.Cymer F., Veerappan A., Schneider D. Transmembrane helix-helix interactions are modulated by the sequence context and by lipid bilayer properties. Biochim. Biophys. Acta. 2012;1818:963–973. doi: 10.1016/j.bbamem.2011.07.035. [DOI] [PubMed] [Google Scholar]
- 15.Barrantes F.J. Structural basis for lipid modulation of nicotinic acetylcholine receptor function. Brain Res. Brain Res. Rev. 2004;47:71–95. doi: 10.1016/j.brainresrev.2004.06.008. [DOI] [PubMed] [Google Scholar]
- 16.Cybulski L.E., Albanesi D., de Mendoza D. Mechanism of membrane fluidity optimization: isothermal control of the Bacillus subtilis acyl-lipid desaturase. Mol. Microbiol. 2002;45:1379–1388. doi: 10.1046/j.1365-2958.2002.03103.x. [DOI] [PubMed] [Google Scholar]
- 17.Aguilar P.S., Hernandez-Arriaga A.M., de Mendoza D. Molecular basis of thermosensing: a two-component signal transduction thermometer in Bacillus subtilis. EMBO J. 2001;20:1681–1691. doi: 10.1093/emboj/20.7.1681. [DOI] [PMC free article] [PubMed] [Google Scholar]
- 18.Dumas F., Tocanne J.F., Lebrun M.C. Consequences of hydrophobic mismatch between lipids and melibiose permease on melibiose transport. Biochemistry. 2000;39:4846–4854. doi: 10.1021/bi992634s. [DOI] [PubMed] [Google Scholar]
- 19.Andersen O.S., Koeppe R.E. Bilayer thickness and membrane protein function: an energetic perspective. Annu. Rev. Biophys. 2007;36:107–130. doi: 10.1146/annurev.biophys.36.040306.132643. [DOI] [PubMed] [Google Scholar]
- 20.Killian J.A., Salemink I., Greathouse D.V. Induction of nonbilayer structures in diacylphosphatidylcholine model membranes by transmembrane α-helical peptides: importance of hydrophobic mismatch and proposed role of tryptophans. Biochemistry. 1996;35:1037–1045. doi: 10.1021/bi9519258. [DOI] [PubMed] [Google Scholar]
- 21.Ren J.H., Lew S., London E. Control of the transmembrane orientation and interhelical interactions within membranes by hydrophobic helix length. Biochemistry. 1999;38:5905–5912. doi: 10.1021/bi982942a. [DOI] [PubMed] [Google Scholar]
- 22.Sparr E., Ash W.L., Killian J.A. Self-association of transmembrane α-helices in model membranes: importance of helix orientation and role of hydrophobic mismatch. J. Biol. Chem. 2005;280:39324–39331. doi: 10.1074/jbc.M502810200. [DOI] [PubMed] [Google Scholar]
- 23.de Meyer F.J.-M., Venturoli M., Smit B. Molecular simulations of lipid-mediated protein-protein interactions. Biophys. J. 2008;95:1851–1865. doi: 10.1529/biophysj.107.124164. [DOI] [PMC free article] [PubMed] [Google Scholar]
- 24.Lee J., Im W. Transmembrane helix tilting: insights from calculating the potential of mean force. Phys. Rev. Lett. 2008;100:018103. doi: 10.1103/PhysRevLett.100.018103. [DOI] [PubMed] [Google Scholar]
- 25.Schäfer L.V., de Jong D.H., Marrink S.J. Lipid packing drives the segregation of transmembrane helices into disordered lipid domains in model membranes. Proc. Natl. Acad. Sci. USA. 2011;108:1343–1348. doi: 10.1073/pnas.1009362108. [DOI] [PMC free article] [PubMed] [Google Scholar]
- 26.Parton D.L., Klingelhoefer J.W., Sansom M.S.P. Aggregation of model membrane proteins, modulated by hydrophobic mismatch, membrane curvature, and protein class. Biophys. J. 2011;101:691–699. doi: 10.1016/j.bpj.2011.06.048. [DOI] [PMC free article] [PubMed] [Google Scholar]
- 27.Strandberg E., Esteban-Martín S., Salgado J. Hydrophobic mismatch of mobile transmembrane helices: merging theory and experiments. Biochim. Biophys. Acta. 2012;1818:1242–1249. doi: 10.1016/j.bbamem.2012.01.023. [DOI] [PubMed] [Google Scholar]
- 28.Park S.H., Opella S.J. Tilt angle of a trans-membrane helix is determined by hydrophobic mismatch. J. Mol. Biol. 2005;350:310–318. doi: 10.1016/j.jmb.2005.05.004. [DOI] [PubMed] [Google Scholar]
- 29.Kim T., Im W. Revisiting hydrophobic mismatch with free energy simulation studies of transmembrane helix tilt and rotation. Biophys. J. 2010;99:175–183. doi: 10.1016/j.bpj.2010.04.015. [DOI] [PMC free article] [PubMed] [Google Scholar]
- 30.Kandasamy S.K., Larson R.G. Molecular dynamics simulations of model trans-membrane peptides in lipid bilayers: a systematic investigation of hydrophobic mismatch. Biophys. J. 2006;90:2326–2343. doi: 10.1529/biophysj.105.073395. [DOI] [PMC free article] [PubMed] [Google Scholar]
- 31.Lomize M.A., Lomize A.L., Mosberg H.I. OPM: orientations of proteins in membranes database. Bioinformatics. 2006;22:623–625. doi: 10.1093/bioinformatics/btk023. [DOI] [PubMed] [Google Scholar]
- 32.Psachoulia E., Fowler P.W., Sansom M.S. Helix-helix interactions in membrane proteins: coarse-grained simulations of glycophorin a helix dimerization. Biochemistry. 2008;47:10503–10512. doi: 10.1021/bi800678t. [DOI] [PubMed] [Google Scholar]
- 33.Psachoulia E., Marshall D.P., Sansom M.S.P. Molecular dynamics simulations of the dimerization of transmembrane α-helices. Acc. Chem. Res. 2010;43:388–396. doi: 10.1021/ar900211k. [DOI] [PubMed] [Google Scholar]
- 34.Kranenburg M., Venturoli M., Smit B. Phase behavior and induced interdigitation in bilayers studied with dissipative particle dynamics. J. Phys. Chem. B. 2003;107:11491–11501. [Google Scholar]
- 35.Kranenburg M., Laforge C., Smit B. Mesoscopic simulations of phase transitions in lipid bilayers. Phys. Chem. Chem. Phys. 2004;6:4531–4534. [Google Scholar]
- 36.Kranenburg M., Smit B. Phase behavior of model lipid bilayers. J. Phys. Chem. B. 2005;109:6553–6563. doi: 10.1021/jp0457646. [DOI] [PubMed] [Google Scholar]
- 37.Venturoli M., Smit B., Sperotto M.M. Simulation studies of protein-induced bilayer deformations, and lipid-induced protein tilting, on a mesoscopic model for lipid bilayers with embedded proteins. Biophys. J. 2005;88:1778–1798. doi: 10.1529/biophysj.104.050849. [DOI] [PMC free article] [PubMed] [Google Scholar]
- 38.Groot R.D., Warren P.B. Dissipative particle dynamics: bridging the gap between atomistic and mesoscopic simulation. J. Chem. Phys. 1997;107:4423–4435. [Google Scholar]
- 39.de Meyer F.J.M., Rodgers J.M., Smit B. Molecular simulation of the effect of cholesterol on lipid-mediated protein-protein interactions. Biophys. J. 2010;99:3629–3638. doi: 10.1016/j.bpj.2010.09.030. [DOI] [PMC free article] [PubMed] [Google Scholar]
- 40.Jähnig F. What is the surface tension of a lipid bilayer membrane? Biophys. J. 1996;71:1348–1349. doi: 10.1016/S0006-3495(96)79336-0. [DOI] [PMC free article] [PubMed] [Google Scholar]
- 41.Lomize A.L., Pogozheva I.D., Mosberg H.I. Positioning of proteins in membranes: a computational approach. Protein Sci. 2006;15:1318–1333. doi: 10.1110/ps.062126106. [DOI] [PMC free article] [PubMed] [Google Scholar]
- 42.Lomize A.L., Pogozheva I.D., Mosberg H.I. Anisotropic solvent model of the lipid bilayer. 2. Energetics of insertion of small molecules, peptides, and proteins in membranes. J. Chem. Inf. Model. 2011;51:930–946. doi: 10.1021/ci200020k. [DOI] [PMC free article] [PubMed] [Google Scholar]
- 43.Kyte J., Doolittle R.F. A simple method for displaying the hydropathic character of a protein. J. Mol. Biol. 1982;157:105–132. doi: 10.1016/0022-2836(82)90515-0. [DOI] [PubMed] [Google Scholar]
- 44.Kucerka N., Nagle J.F., Katsaras J. Lipid bilayer structure determined by the simultaneous analysis of neutron and x-ray scattering data. Biophys. J. 2008;95:2356–2367. doi: 10.1529/biophysj.108.132662. [DOI] [PMC free article] [PubMed] [Google Scholar]
- 45.Monticelli L., Kandasamy S.K., Marrink S.J. The MARTINI coarse-grained force field: extension to proteins. J. Chem. Theory Comput. 2008;4:819–834. doi: 10.1021/ct700324x. [DOI] [PubMed] [Google Scholar]
- 46.Chothia C., Levitt M., Richardson D. Structure of proteins: packing of α-helices and pleated sheets. Proc. Natl. Acad. Sci. USA. 1977;74:4130–4134. doi: 10.1073/pnas.74.10.4130. [DOI] [PMC free article] [PubMed] [Google Scholar]
- 47.Bowie J.U. Helix packing angle preferences. Nat. Struct. Biol. 1997;4:915–917. doi: 10.1038/nsb1197-915. [DOI] [PubMed] [Google Scholar]
- 48.Bowie J.U. Helix packing in membrane proteins. J. Mol. Biol. 1997;272:780–789. doi: 10.1006/jmbi.1997.1279. [DOI] [PubMed] [Google Scholar]
- 49.Chambers J.M., Hastie T. Wadsworth & Brooks/Cole Advanced Books & Software; Pacific Grove, CA: 1992. Statistical Models. S. Wadsworth & Brooks/Cole Computer Science Series. [Google Scholar]
- 50.Efron B., Tibshirani R. Bootstrap methods for standard errors, confidence intervals, and other measures of statistical accuracy. Stat. Sci. 1986;1:54–75. [Google Scholar]
- 51.Kabsch W., Sander C. Dictionary of protein secondary structure: pattern recognition of hydrogen-bonded and geometrical features. Biopolymers. 1983;22:2577–2637. doi: 10.1002/bip.360221211. [DOI] [PubMed] [Google Scholar]
- 52.Bansal M., Kumar S., Velavan R. HELANAL: a program to characterize helix geometry in proteins. J. Biomol. Struct. Dyn. 2000;17:811–819. doi: 10.1080/07391102.2000.10506570. [DOI] [PubMed] [Google Scholar]
- 53.Michaud-Agrawal N., Denning E.J., Beckstein O. Software news and updates. MDAnalysis: a toolkit for the analysis of molecular dynamics simulations. J. Comput. Chem. 2011;32:2319–2327. doi: 10.1002/jcc.21787. [DOI] [PMC free article] [PubMed] [Google Scholar]
- 54.Gimpelev M., Forrest L.R., Honig B. Helical packing patterns in membrane and soluble proteins. Biophys. J. 2004;87:4075–4086. doi: 10.1529/biophysj.104.049288. [DOI] [PMC free article] [PubMed] [Google Scholar]
- 55.Chothia C., Levitt M., Richardson D. Helix to helix packing in proteins. J. Mol. Biol. 1981;145:215–250. doi: 10.1016/0022-2836(81)90341-7. [DOI] [PubMed] [Google Scholar]
- 56.Li A.J., Nussinov R. A set of van der Waals and Coulombic radii of protein atoms for molecular and solvent-accessible surface calculation, packing evaluation, and docking. Proteins. 1998;32:111–127. [PubMed] [Google Scholar]
- 57.Research Collaboratory for Structural Bioinformatics (RCSB) Protein Data Bank. http://www.rcsb.org. [DOI] [PMC free article] [PubMed]
Associated Data
This section collects any data citations, data availability statements, or supplementary materials included in this article.