

Abstract
The manner in which groups of neurons represent events in the external world is a central question in neuroscience. Estimation of the information encoded by small groups of neurons has shown that in many neural systems, cells carry mildly redundant information. These measures average over all the activity patterns of a neural population. Here, we analyze the population code of the salamander and guinea pig retinas by quantifying the information conveyed by specific multicell activity patterns. Synchronous spikes, even though they are relatively rare and highly informative, convey less information than the sum of either spike alone, making them redundant coding symbols. Instead, patterns of spiking in one cell and silence in others, which are relatively common and often overlooked as special coding symbols, were found to be mostly synergistic. Our results reflect that the mild average redundancy between ganglion cells that was previously reported is actually the result of redundant and synergistic multicell patterns, whose contributions partially cancel each other when taking the average over all patterns. We further show that similar coding properties emerge in a generic model of neural responses, suggesting that this form of combinatorial coding, in which specific compound patterns carry synergistic or redundant information, may exist in other neural circuits.
Introduction
While much of our understanding of the brain is derived from studies of single neurons, it is clear that neural systems generally rely on populations of neurons to represent stimuli and to direct motor outputs. Different views of how correlated firing patterns represent information collectively have been proposed, even within the same brain region (Zohary et al., 1994; Meister et al., 1995; Vaadia et al., 1995; Dan et al., 1998; Abbott and Dayan, 1999; Nirenberg et al., 2001; Shamir and Sompolinsky, 2004; Averbeck et al., 2006). In one view, the unreliability of single neurons requires that many neurons encode the same information, and only by averaging over large groups can encoded information be extracted reliably (Shadlen and Newsome, 1994). Another hypothesis is that the information conveyed by multineuronal spiking patterns is simply the sum of information that each of the cells conveys on its own; this view is related to ideas of redundancy reduction (Barlow, 1961), decorrelation (Atick, 1992) and independent component analysis (Bell and Sejnowski, 1997; van Hateren and van der Schaaf, 1998), which have been suggested as design principles for the neural code. Finally, there is the possibility of pattern-based coding (Meister, 1996), in which specific multineuronal activity patterns convey different or more information than the sum of contributions from the individual neurons.
To assess these different coding schemes, the average amount of information that small groups of cells convey about natural and artificial stimuli has been compared to the sum of single cell contributions. Typically, cell pairs exhibit weak redundancy—in the retina (Puchalla et al., 2005), visual cortex (Gawne and Richmond, 1993; Reich et al., 2001), somatosensory cortex (Petersen et al., 2001), auditory pathway (Chechik et al., 2006), motor cortex (Narayanan et al., 2005), and frontal cortex (Gat and Tishby, 1999). However, synergistic response patterns may simply be rare events that have only a small effect on the average mutual information. In particular, synchronized spiking has been shown to be correlated with specific stimulus features or motor outputs (Abeles, 1991; Meister et al., 1995; Vaadia et al., 1995; Riehle et al., 1997; Schnitzer and Meister, 2003), and has therefore been suggested as a special symbol in the population code of many neural circuits.
Here, we quantify combinatorial coding by calculating the information conveyed by specific multicell activity patterns, rather than the mutual information between stimuli and responses, which is an average over all multicell patterns (Brenner et al., 2000). This is a natural framework in which to analyze a population code, because specific firing patterns are the actual neural symbols that downstream circuits encounter in real time. We find significant redundancy in synchronous spiking patterns, whereas combinations of spiking and silence are most often synergistic. Averaging over specific patterns, their synergy and redundancy contributions partially cancel, explaining why on average cells were found to be typically only weakly redundant (Puchalla et al., 2005). We study the stimulus features that correspond to multineuronal firing patterns and relate synergy to the functional properties of individual neurons.
Materials and Methods
Electrophysiological recording.
Eyes were dissected from the tiger salamander (Ambystoma tigrinum) or guinea pig (Cavia porcellus) of both males and females and cut into pieces that left the retina and pigment epithelium intact. These pieces were placed with the ganglion cells facing a multielectrode array and were perfused with oxygenated Ringer's at room temperature (salamander) or Ames' medium at 36°C (guinea pig). Stable recordings of over 12 h were achieved under these conditions. Extracellular voltages were recorded by a MultiChannel Systems MEA 60 microelectrode array and streamed to disk for offline analysis. Spike waveforms were sorted using the spike size and shape in a 2.5 ms window. Only well isolated spike waveforms were used: we required that spike trains had fewer than 0.5% of the interspike interval <2 ms and that fewer than 1% of the spikes were found within ±0.2 ms of spikes from other cells. This study is based on measurements of 8210 (902) cell pairs between 369 (61) cells recorded from 5 (4) retinas in the salamander (guinea pig) with multiple movie clips. There were between 9 and 40 cells recorded per movie clip; some of the same cells were recorded during multiple clips.
Visual stimulation.
Natural movie clips were acquired using a Canon Optura Pi video camera at 30 frames per second. Movies were taken of woodland scenes and included several qualitatively different kinds of motion: objects moving in a scene, optic flow, and simulated saccades. Checkerboard flicker consisted of 55 μm square regions on the retina that were randomly chosen to be either black or white every 33 ms. In spatially uniform flicker, light intensities were chosen randomly every 33 ms from a Gaussian distribution with a SD equal to 18% of the mean. All visual stimuli were displayed on an NEC FP1370 monitor and projected onto the retina using standard optics. The mean light level was 12 mW/m2 at the retina.
Functional classification.
Salamander ganglion cells were divided into 3 broad classes using the time course of their spike-triggered average (STA) as well as their responses to diffuse steps of light. Fast OFF cells (∼75% of population) had short latency responses to both the onset and offset of light. Slow OFF cells (∼10%) had longer latency responses and only responded at the offset of light. ON cells (∼15%) only responded at the onset of light. These definitions correspond to those previously made using random flicker stimulation—“fast OFF,” “weak OFF,” “ON” (Schnitzer and Meister, 2003)—as well as using flashes—“ON/OFF,” “OFF,” “ON” (Burkhardt et al., 1998). Fast OFF cells were resolved into 6 subtypes using an information theoretic method of functional classification (Schneidman et al., 2002); this method is sensitive to the entire response function of a neuron, rather than just its spike-triggered average. Cells of the same subtype had nearly identical STAs; different subtypes had characteristic shifts in their response latency as well as the degree to which their STAs were biphasic versus monophasic.
Information carried by a neural symbol.
We first estimated the time-dependent rate at which each neural symbol σ occurs, rσ(t), by binning the spike train in time windows Δt and counting the number of events in each window across all stimulus trials. We then estimated the information in single cell “symbols”—spike (“1”) or silence (“0”) in a bin of size Δt using Equation 1; compound neural symbols were defined as joint spiking 1 ⊗ 1 or spiking and silence 1 ⊗ 0, within a time window that is different from Δt. To correct for undersampling and bias, a jackknife approach was used, in which we estimated the information in subsets of the data and extrapolated to an infinite number of repeats (Strong et al., 1998). We have omitted information values of symbols when the symbol rate was too low to give a reliable estimate of the information (for comparison, the maximum information is given by the entropy of the spike train, which is −log2 r̄Δt). Finally, we took the limit Δt → 0, which gives the information per event (Brenner et al., 2000).
An alternative approach measures the information conveyed by individual occurrences of an event (DeWeese and Meister, 1999). Our definition instead measures the average information conveyed by the specific time at which a single event occurs. As discussed in (Brenner et al., 2000), these two measures are consistent, and Equation 1 can be derived in many ways, including as a limit of the information per event defined in (DeWeese and Meister, 1999). We emphasize that Equation 1 is an exact measure of the information carried by the arrival time of a single event and makes no assumptions about the correlations between events. In Figure 2 (see below), we defined stimulus uncertainty by convolving the stimulus with the symbol-triggered average, compiling the distribution of such values whenever the symbol occurred, and calculating the variance of that distribution.
Figure 2.
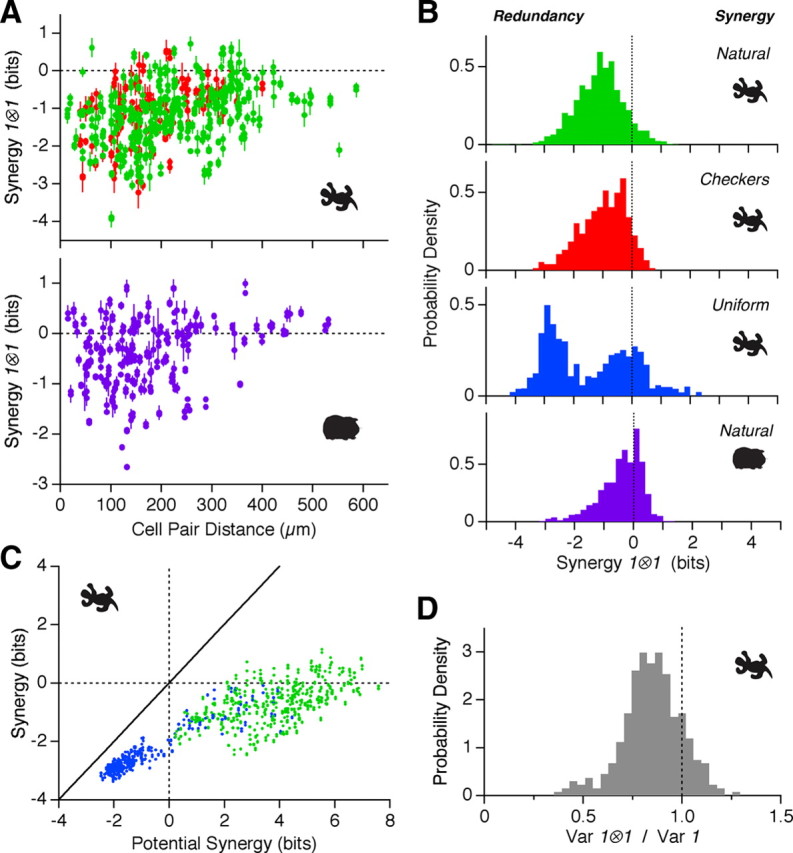
Synergy of synchronous spike pairs. A, Synergy of synchronous spike pairs as a function of the distance between the receptive field center of these cells (every dot stands for one cell pair). Top, For salamander, natural movie data are collected over 3 different movies (green); checkerboard movie data are collected over 2 different movies (red). Bottom, For guinea pig, natural movie data are collected over 1 movie (purple). B, Distribution of synergies for 1 ⊗ 1 symbols in salamander for natural movies (green, 2556 cell pairs), checkerboard movies (red, 382 pairs) and uniform flicker (blue, 749 pairs); synergies for 1 ⊗ 1 symbols in guinea pig for natural movies (purple, 766 pairs). C, Actual synergy for 1 ⊗ 1 symbols plotted versus the potential synergy derived from the PSTH of each cell (see Materials and Methods) for natural movies (green) and uniform flicker (blue). Error bars omitted for clarity. D, Distribution of stimulus uncertainty for 1 ⊗ 1 symbols divided by the uncertainty for single spikes. Uncertainty is defined as the variance of the symbol-triggered stimulus distribution (see Results); a decrease in the variance then corresponds to an increase in the certainty of the stimulus.
We also compared the estimate from Equation 1 to the information in the spike train, estimated by the “direct method” (Strong et al., 1998), as described by Puchalla et al. (2005). Then, the information in the timing of individual spikes was calculated as in Equation 1 of this paper for the same cells. A comparison revealed that for most cells, the information as estimated by Equation 1 was quite similar to the information estimated by full direct sampling. On average, Equation 1 gave a value that was 9.8 ± 12% (SD) less than the full direct method. This result indicates that correlation between events makes a relatively small contribution to the mutual information in this dataset.
Pola et al. (2003) proposed another decomposition of the information conveyed by a population of neurons into terms that depend on the nature of correlation among cells. This measure is complementary to the measure we define here. This measure answers the question of what contributions to the joint information are made by signal correlations, noise correlations, and an interaction between signal and noise correlations, but does not isolate contributions to particular population responses. Synergy per symbol answers the question of how much information a specific compound neural symbol conveys, but does not isolate contributions from signal versus noise correlations. Butts (2003) and Bezzi (2007) have introduced alternative measures that quantify the information that responses convey about specific stimuli rather than the information that specific responses convey about all the stimuli. Again, these measures are complimentary to synergy per symbol.
Potential for synergy in compound neural symbols.
We estimated how synergistic the joint spiking symbol 1 ⊗ 1 could have been, given the firing rates of its constituent cells, r1A(t) and r1B(t). The basic constraint is that at every time point, the 1 ⊗ 1 symbol rate could have been anywhere between the minimal value rABmin(t) = max{0, rlA(t)+rlB(t)−1/Δt}, where Δt is size of the time bin, and the maximal value rABmax(t) = min{rlA(t), rlB(t)}. Notice that this allows a range of possible average firing rates for the synchronous symbol. Because information per symbol is higher for larger modulations of the symbol rate, the maximum information will be obtained if at each time the rate takes either its minimal or maximal value; different mean symbol rates can be obtained by distributing different time points between their minimal and maximal symbol rates. Our procedure was to first fix the average firing rate of the synchronous symbol, r̄AB, and then adjust the time-dependent firing rate in such a way as to maximize the mutual information. Then we repeat this procedure for all possible values of r̄AB.
We start from a value of r̄AB given by rABmin(t) and add the smallest possible increment consistent with a finite number of trials in the experimental data. This increment, 1/NΔt, is added to the firing rate of one of the time bins, where N is number of repeated presentations of the stimulus. This quantity corresponds to adding one synchronous spike pair to only 1 of the N stimulus trials. We choose the time bin such that this additional spike pair results in the largest increase in information carried by the 1 ⊗ 1 symbol. Then, we seek pairs of bins for which raising the rate in one bin and reducing the rate in the other bin by the same amount (i.e., keeping r̄AB constant) would further increase the information. We stop when no such pair is found, thus achieving a locally optimal solution for distributing synchronous spike pairs across time to achieve the maximal possible information. We repeat this procedure for each possible value of r̄AB (in steps of 1/NΔt) and find the largest 1 ⊗ 1 information over all the possible values of r̄AB. The potential for synergy in the 1 ⊗ 1 symbol is given by the difference between this maximum possible information for the 1 ⊗ 1 symbol and each cell's individual information. We note that our greedy algorithm gives a lower bound on the synergy that the two cell's firing rates could achieve.
Model of ganglion cell light responses.
A common formalism for describing the input-function of a retinal ganglion cell is the classical receptive field model, as originally elaborated by (Rodieck and Stone, 1965). There can be significant differences between real ganglion cell light responses and the classical receptive field model, especially for more naturalistic stimuli (Barlow and Levick, 1965; Shapley and Victor, 1979a,b; Smirnakis et al., 1997; Olveczky et al., 2003; Hosoya et al., 2005; Ishikane et al., 2005; Schwartz et al., 2007a,b; Gollisch and Meister, 2010). However, the wide spread use of the classical receptive field model and its simple form makes it a good starting point for understanding how common stimulation of neurons can result in synergy/redundancy of compound firing symbols.
To implement this model, each ganglion cell, i, has a receptive field given by a unit vector v→i in the space of all visual stimuli. This preferred direction has an overlap with all stimuli s→ defined by the angle θi = v→i · s→. The spiking probability of each cell in response to a stimulus, P(1i | s→), is given by a sigmoidal function: [ 1 + tanh(βi(v→i · s→) − αi)], where αi is a bias term, controlling the threshold of the neuron, and βi is the slope of the sigmoid, controlling how deterministic the cell's response is (the firing probability will be either zero or one with a very sharp threshold for high β). We added more noise in the form of a background firing rate, implemented by adding ζi to the spiking probability (and truncating to the range [0,1]).
To estimate the synergy or redundancy of pairs and triplets of cells, we created a set of 100 neurons with preferred directions in stimulus space, v̂, ranging from 0 to 2π in equal jumps. Next, we created a stimulus ensemble with a uniform distribution over the direction of the stimulus vectors, ŝ, and a length of unity, ‖s→‖ = 1. This ensemble was randomly sampled with 50,000 stimuli. The responses of all pairs and triplets of cells were then averaged over this set of stimuli. Finally, values of synergy were averaged over all pairs and triplets of neurons. For this calculation, the joint spiking probability of cells A and B is equal to P(1A|s→)P(1B|s→). The information per symbol values and synergy values were calculated as for the retinal ganglion cells.
Results
Simultaneous recordings were made from many ganglion cells in the salamander and guinea pig retinas using a multielectrode array, while artificial and natural movies were presented on a computer monitor (see Materials and Methods). Movie clips 20–30 s long were repeated many times (100–150) to sample both the diversity and variability of ganglion cell firing patterns. An example of the spike trains recorded from two cells is shown in Figure 1A.
Figure 1.

Information carried by single spikes and synchronous spike pairs. A, Typical response segment of ganglion cells to repeated presentations of a natural movie. Top and bottom panels show the spikes of two single cells (blue); middle panel shows the events of synchronized spiking of these cells within ±10 ms (red). B, Poststimulus time histograms of the spike rasters in A. C, D, Information conveyed by single spikes (blue; every dot stands for one ganglion cell) and synchronized spike pairs (red; every dot stand for one cell pair) as a function of symbol rate for the (salamander, guinea pig). Data points shown from 2 different natural movies. Solid line marks the upper bound for information transmission given by the entropy of the spike train, −log2 r̄Δt, where r̄σ is the average firing rate for symbol σ and the temporal resolution is taken to be 20 ms (Rieke et al., 1997); dashed lines are 40% and 70% of this maximum for the salamander and 25%/70% for the guinea pig.
The information conveyed by individual neural symbols
The common application of information theory to neural coding questions has focused on the mutual information I(S;Σ) between a set of stimuli, S, and a set of possible neural responses, Σ. This measures the average degree of correlation between all stimuli and all of the responses. Rather than asking only about the average contribution of the neural symbols, one can instead define the information carried by any specific neural symbol (de Ruyter van Steveninck and Bialek, 1988; DeWeese and Meister, 1999). Brenner et al. (2000) proposed that one can exactly define the information conveyed by the arrival time of not just spikes, but also spike patterns. They then analyzed the synergy or redundancy of compound spiking symbols by comparing the information conveyed by the spike pattern to the sum of the information conveyed by each spike. A similar idea can be applied to patterns of spikes across cells rather than across time for the same cell. (For a more complete discussion of other measures of event information, see Materials and Methods). As shown in detail by Brenner et al. (2000), the information carried by a neural symbol σ, whose time-dependent rate of occurrence is given by rσ(t), is:
 |
where r̄σ is the time average of rσ(t) over the entire duration of the stimulus ensemble T. Note that the time average serves the purpose of averaging over the stimulus ensemble.
The symbol rate rσ(t) measures the probability per unit time of the symbol occurring; it is estimated in the same way as we estimate time-dependent spike rates, by forming a peristimulus time histogram (PSTH) using repeated trials of the stimulus. As with the conventional time-dependent firing rate for single spikes, modulations in this symbol rate reflect reproducible locking of the events σ to dynamic features in the stimulus. Neuronal symbols that occur with a rate that is strongly modulated by the stimulus convey more information per symbol than those with a weakly modulated rate. Notice that equation 1 depends only on the variation in the time-varying symbol rate, rσ(t), compared with the average symbol rate, r̄σ. Using this relationship, we estimated the information carried by different ganglion cell firing patterns (see Materials and Methods).
The simplest neural symbol is the single spike, denoted as 1. Over the whole set of natural movies, the average information conveyed by a single spike in the salamander was <I(1A;S)〉 = 3.6 ± 1.0 bits (mean ± SD across the population; n = 204 cells) and in the guinea pig was 2.2 ± 1.2 bits (n = 59 cells). No clear dependence on the particular movie clip was observed.
For synchronous spiking among pairs of neurons, we defined the compound symbol 1A ⊗ 1B denoting all the spikes of cell A that had a spike of cell B within ±10 ms (Fig. 1A). This narrow temporal window for synchrony matches the time scale over which excess synchronous pairs have been observed (Meister et al., 1995). Notice that the time window to define compound symbols is different from the time bin used in computing the information conveyed by the symbols (see Materials and Methods).
The information that synchronous spiking conveyed about natural movies was significantly higher than for single spikes, <I(1A ⊗ 1B;S)〉{A,B} = 5.3 ± 1.0 bits (Fig. 1C; n = 2887 pairs). In particular, for all cell pairs the symbol 1A ⊗ 1B was at least as informative, and usually much more informative than either 1A or 1B alone (data not shown). Changing the temporal window used to define synchrony between ±5 ms and ±50 ms had a negligible effect on the symbol's information. Interestingly, the 1 ⊗ 1 symbols obeyed a similar relation to that of the single spikes: given our time resolution of 20 ms, nearly all symbols conveyed an information between 40% and 70% of the maximum possible information determined by that symbol's average event rate (Fig. 1C) (Rieke et al., 1997). Similar behavior was found for the guinea pig (Fig. 1D), but with somewhat higher firing rates (4.2 ± 1.2 Hz vs 1.2 ± 0.8 Hz) and lower coding efficiency (33 ± 5% vs 55 ± 11%).
Synergy and redundancy in compound neural symbols and the relation to combinatorial codes
To quantify how compound neural symbols encode information, we compared the information transmitted by multineuronal firing patterns as a whole to the sum of information values conveyed by each of the components of the compound symbol. In the case of two neurons, we define:
 |
If ΔI is zero, then the components of the compound symbol contribute independent information about the visual stimulus and downstream neural circuits can read the information conveyed by each neural symbol without regard to the responses of other neuron(s). In this case the information that is carried by each of the symbols simply adds up when we observe the compound symbol. If the compound symbol is synergistic (ΔI > 0), then the joint pattern of the cells carries more information that the sum of information carried by the symbols of each cell alone. If compound neural symbols carry different information than what one would naively expect from the individual events, then the neurons are using a combinatorial code.
We emphasize that synergy at the level of a particular neural symbol may have different properties than the average synergy between cells, which quantifies the information coding of the cells over all their joint activity patterns. In particular, it is possible for specific compound symbols to be synergistic (ΔI > 0) due solely to correlations induced by the stimulus, and without any “noise correlations.” Thus, the cells can be conditionally independent given the stimulus and still their joint activity pattern could convey more information about the stimulus than the sum of the constituent symbols on their own. (We further demonstrate this case and analyze the potential sources of symbol synergy using a model in Fig. 5, below). This is not the case for average synergy (Schneidman et al., 2003), which requires noise correlations, namely that the cells would not be conditionally independent given the stimulus.
Figure 5.
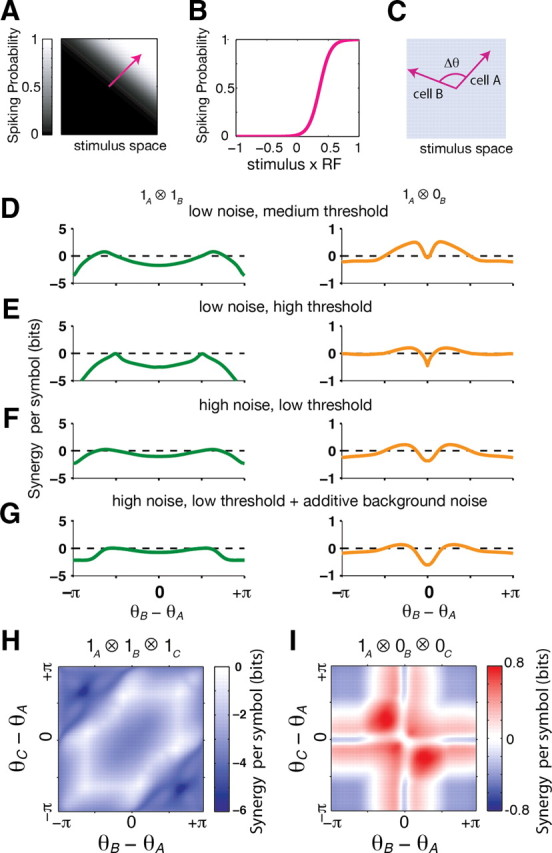
Synergy per symbol in a simple neural population model. A, Stimuli are vectors in the space of all possible stimuli, here depicted in two dimensions. The preferred stimulus of a neuron is described by the direction of a unit vector in stimulus-space (pink arrow), defining a spiking probability along this direction (gray scale). All cells in the model are identical except for their preferred direction. B, The spiking probability of the neuron from A shown as a function of the overlap between the stimulus and the cell's preferred direction, θ. C, For two cells, the symmetry of the model implies that the joint information is only a function of the angle between the preferred directions of the cells, Δθ. D, Synergy for 1 ⊗ 1 symbols (left column) and 1 ⊗ 0 symbols (right column) shown as a function of the angle between cell's preferred stimuli, Δθ. Model parameters are β = 8, α = 5, without additive background noise ζ = 0 (see Materials and Methods). E, Same as in D, but with a higher spiking threshold (α = 8), which results in more selective spiking. F, Same as in D, but with model parameters β = 4, α = 2, and ζ = 0, corresponding to a lower selectivity and a noisier response. G, Same as in F, but with an additive noise ζ = 0.02. H, Synergy for the triplet symbol 1 ⊗ 1 ⊗ 1 shown as a function of the angle between cell 1 and cells 2 (x-axis), and the angle between cells 2 and cell 3 (y-axis). Same model parameters as in D. I, Same model as H, but for the triplet symbol 1 ⊗ 0 ⊗ 0.
Synchronous spiking is mostly redundant
For natural movies, we found that synchronous spikes were significantly less informative than expected from summing the information contributed by each individual spike. The redundancy of synchronous spikes ranged up to ΔI = −4.1 bits in salamander (−47% of the constituent symbol information) and −2.7 bits in guinea pig (−22%). For cells spaced <200 μm apart, which have overlapping receptive field centers, ΔI = −1.1 ± 0.84 bits (SD, n = 2887 pairs) for salamander and −0.41 ± 0.72 bits (SD, n = 766 pairs) for guinea pig. No clear differences were found between movie clips (n = 9 clips). Synchronized firing tended to produce more negative ΔI values between nearby cells than faraway cells (Fig. 2A). We found a small fraction of cell pairs with synergy for synchronous spike pairs; in almost all cases, one cell was ON-type and the other was OFF-type (data not shown).
To further interpret these results, we performed a similar analysis for artificial stimuli. In spatially uniform flicker, where all ganglion cells see the same input, the largest values of redundancy were similar to those found with naturalistic stimulation, but many more cell pairs had high values of redundancy (Fig. 2B). This makes sense because the strong spatial correlations in natural images will cause ganglion cells with highly overlapping receptive fields to experience roughly, but not exactly, the same visual input. In checkerboard flicker, where spatial correlations only extend up to the size of square regions (55 μm), synchronous spike pairs were less redundant, ΔI = −0.94 ± 0.89 bits for cells spaced by <200 μm (Fig. 2B, SD, n = 567 pairs). Together these results suggest that the degree of redundancy for synchronous spike pairs is largely determined by the properties of the stimulus.
The simple correlation structure of artificial movies also allows us to relate neural events to the visual stimulus (de Ruyter van Steveninck and Bialek, 1988). Using spatially uniform flicker, we typically found that the symbol-triggered average stimulus (STA) for 1 ⊗ 1 symbols was intermediate between the STAs of its component spikes. However, the stimuli preceding a synchronous spike pair clustered more tightly around the STA than for single spikes. Figure 2D shows that the variance along the direction in stimulus space defined by the STA was consistently smaller for 1 ⊗ 1 symbols than for single spikes (see Materials and Methods). These results indicate that the extra information conveyed by 1 ⊗ 1 symbols compared with single spikes is due, in part, to increased certainty that the stimulus is similar to the STA. Of course, synchronous spikes are likely to be selective for multiple stimulus features, so that this analysis of the variance along the direction of the STA may not be a complete characterization (Fairhall et al., 2006).
The fact that most of the 1 ⊗ 1 symbols were less informative than their sum needs to be put in context: how much information can a synchronous spike pair possibly convey? Intuitively, if two neurons each are very precisely locked to the stimulus, then there is little scope for synchronous spikes to say anything different from that said by the single neurons. We explored the potential for synergy between two neurons by using an iterative algorithm for finding the most informative synchronous spike train given the firing rate of each individual neuron (see Materials and Methods). Figure 2C compares the potential synergy for 1 ⊗ 1 symbols with their actual value. Under naturalistic stimulation, cell pairs had considerable room for synergy but instead were mostly redundant (green). Under spatially uniform flicker, we could not always find a possible combination of spikes into synchronous pairs that was synergistic (blue), but all synchronous spike pairs we significantly more redundant than they could have been.
Combinations of spiking and silence are mostly synergistic
In a combinatorial code, the joint event of spiking in some neurons and silence (nonspiking) in other neurons may carry different information than what one would naively expect from the individual events. Silence alone is not highly informative: the information content of the symbol 0 is 0.011 ± 0.015 bits for 20 ms of silence and 0.074 ± 0.079 bits for 100 ms of silence (SD, natural movies, salamander, n = 204 cells). However, the symbol 1A ⊗ 0B, where cell A fires a spike and cell B does not spike within 50 ms of cell A's spike, often was found to be synergistic (ΔI > 0) both for natural and for artificial movies (Fig. 3A). Importantly, for every ganglion cell, there is another cell whose silence adds synergistically to the spiking cell (Fig. 3A). Synergy from silence tended to increase when the temporal window used to define silence increased; we chose 50 ms because this corresponds to the typical duration of IPSPs (Gibson et al., 1999; Pouille and Scanziani, 2004), consistent with a plausible mechanism for detecting combinations of spiking and silence (see Fig. 6).
Figure 3.

Synergy from silence. A, Distribution of synergy values of the 1 ⊗ 0 symbol for natural movies (top, 5497 cell pairs), checkerboard movies (middle, 688 pairs) and uniform flicker (683 pairs). Top panel also shows the distribution of maximum 1 ⊗ 0 synergies for each cell found by pairing it with its most informative silent partner (black). B, Distribution of synergy values of 1 ⊗ 0 ⊗ 0 (top) and 1 ⊗ 0 ⊗ 0 ⊗ 0 symbols (middle) for salamander and 1 ⊗ 0 ⊗ 0 ⊗ 0 (bottom) for guinea pig under naturalistic stimulation. C, D, Synergy of 1 ⊗ 0 ⊗ 0 ⊗ 0 symbols compared to the sum of synergy values of the corresponding three synergies of 1 ⊗ 0 symbols for (salamander, guinea pig) under naturalistic stimulation. Error bars omitted for clarity.
Figure 6.

Schematic of circuit for recognizing compound symbols. Left, Cells A and B have excitatory synapses onto a readout cell with a threshold of two simultaneous inputs. Right, Spiking cell (A) has a direct excitatory synapse onto a readout neuron. Silent cell (B) excites an inhibitory cell (i), which feeds forward onto the readout neuron with a threshold of one spike. When cell B spikes, this pathway indirectly vetoes excitation of the readout neuron; as a result, the readout neuron will only be excited when A fires but B is silent. This network is easily generalized to confer sensitivity to silence from multiple neurons by having all such neurons excite the same inhibitory cell (cells C, D). Such feedforward inhibitory circuitry has been described in the cortex (Gibson et al., 1999).
Synergy from silence becomes even more apparent for firing patterns with one spiking cell and several silent cells: for natural movies, 1 ⊗ 0 ⊗ 0 symbols were more synergistic than 1 ⊗ 0, and 1 ⊗ 0 ⊗ 0 ⊗ 0 symbols were even more so, with synergy exceeding 2 bits in some cases (Fig. 3B). Here, synergy from silence is a generalization of Equation 2: for instance: ΔI(1 ⊗ 0 ⊗ 0;S) = I(1 ⊗ 0 ⊗ 0;S) − I(1;S) − I(0 ⊗ 0;S). The synergy for 1 ⊗ 0 ⊗ 0 ⊗ 0 symbols was 0.50 ± 0.46 bits (SD, n = 6438 quadruplets) for salamander and 0.23 ± 0.33 bits (SD, n = 2455 quadruplets) for guinea pig. The synergistic contribution from the silence of 3 neurons is roughly equal to the sum of the synergies from the silence of each neuron combined pairwise with the spiking neuron: ΔI (1A ⊗ 0B ⊗ 0C ⊗ 0D;S) ≈ ΔI(1A ⊗ 0B;S) + ΔI(1A ⊗ 0C;S) + ΔI(1A ⊗ 0D;S) (Fig. 3C,D).
To understand how compound events of spiking and silence encode information, and their synergistic nature, it is instructive to look at examples of such coding symbols under random flicker stimulation. Synergy results when the silence from the second neuron (cell B) effectively “vetoes” a subset of the firing events produced by the spiking cell (cell A), while leaving other events essentially unchanged (Fig. 4A). Because this vetoing operation is stimulus specific, the STA of the 1 ⊗ 0 symbol is modified compared with the STA of cell A alone (Fig. 4B). In fact, the modified visual message represented by a 1 ⊗ 0 symbol was often different from any of the STAs of individual neurons (Fig. 4B).
Figure 4.
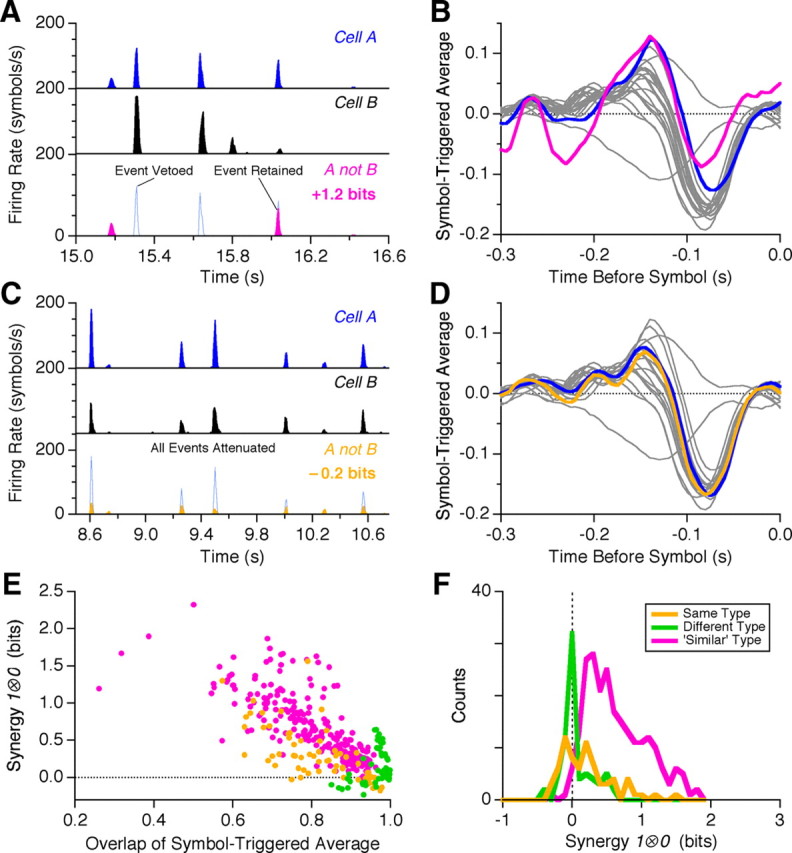
Origins of synergy from silence. A, Example of information gain from silence. Firing rate of two cells is shown (cell A, blue; cell B, black) along with the combination of cell A firing and cell B silent (bottom, pink). B, Symbol-triggered average for cell A (blue) and A not B (pink) against the other 20 cells recorded under uniform flicker (gray). C, Example of information loss from silence. Firing rate of two cells is shown (cell A, blue; cell B, black) along with the combination of cell A firing and cell B silent (bottom, orange). D, Symbol-triggered average for cell A (blue) and A not B (orange) against the other 20 cells recorded under uniform flicker (gray). E, Synergy from silence plotted versus the overlap between the symbol-triggered average of 1A symbol versus the 1A ⊗ 0B symbol. Overlap is measured as the normalized, scalar product between the two symbol-triggered stimulus vectors, with values ranging from −1 to +1. F, Histogram of 1 ⊗ 0 synergies for cell pairs of the same function type (orange), different broad type (green), and similar functional type (pink). See Materials and Methods for details of functional classification.
Synergy from silence depends critically on the identity of the two neurons: if they are functionally very similar, then the requirement of silence from cell B indiscriminately attenuates all of the firing events produced by cell A (Fig. 4C). Now, the 1 ⊗ 0 symbol encodes roughly the same average visual message as the single spike (Fig. 4D), but this compound symbol has many fewer events than either individual spike. In fact, this combination can even result in a loss of information relative to that conveyed by a single spike (Fig. 4C). Information loss occurs when the difference between the most sharply locked firing events and the typical events decreases, as can be seen in Figure 4C. These results demonstrate that synergy from silence is not a generic consequence of the decreased event rate for 1 ⊗ 0 symbols relative to single spikes, but instead depends on the detailed pattern of firing exhibited by the compound symbol.
The lack of synergy from silence for functionally very similar neurons was found to be systematic: the values of ΔI for cells of the same functional subtype (see Materials and Methods) were found to be scattered close to zero (Fig. 4E, orange). Interestingly, the symbol-triggered stimulus variance for 1 ⊗ 0 symbols formed from cells of the same functional type was slightly but significantly greater than the stimulus variance for single spikes: variance ratio = 1.06 ± 0.018 (SEM, n = 71 pairs). This result is the opposite of what was found for synchronous spikes and indicates the information loss here results, in part, from decreased certainty that the stimulus is similar to the STA. We found also that 1 ⊗ 0 symbols formed from cells with very different function, such as pairs of ON and OFF cells, were not synergistic (Fig. 4E, green). This is expected, because such cells have no signal correlation and no noise correlation (Puchalla et al., 2005; Segev et al., 2006). Instead, 1 ⊗ 0 symbols formed from similar but different neurons—same broad functional type (e.g., fast OFF) but different subtype (Schneidman et al., 2002)—usually were synergistic under spatially uniform stimulation (Fig. 4E, pink). The symbol-triggered stimulus variance of the 1 ⊗ 0 symbols for cells of a “similar” type was higher than for single spike by a ratio of 1.13 ± 0.012 (SEM, n = 222 pairs). Thus, the synergy of these symbols was dominated by differences in the symbol-triggered average.
We can test these ideas more systematically by comparing the synergy of a given 1 ⊗ 0 symbol with the difference in the symbol-triggered average between the single spike from cell A, 1A, and the compound symbol, 1A ⊗ 0B, conditioned on silence from cell B (Fig. 4F). We measured this difference using the normalized, scalar product between the two symbol-triggered stimulus vectors (with values ranging from −1 to +1). Overlaps close to +1 indicate that the condition of silence from cell B had almost no effect on the feature encoded by the compound symbol. We found that all overlap values for these data were positive, indicating that the condition of silence from cell B never changed the polarity of the stimulus feature encoded by the compound symbol. We also found a strong negative correlation between synergy and feature overlap, indicating that greater values of synergy corresponded to cases where the symbol-triggered average changed the most by the condition that cell B was silent. This correlation was strong enough to account for most of the variation in synergy values (r2 = −0.76).
Compound neural symbols formed from cells of the same functional type (Fig. 4F, orange) tended to have lower synergy at a given overlap than symbols formed from similar cell types. Spiking and silence from two cells of different functional types resulted in the smallest changes in the symbol-triggered average as well as some of the lowest values of synergy. In addition, cell pairs with some synergy but no change in the symbol-triggered average all came from cases where an ON cell was spiking and an OFF cell was silent, and cell pairs with substantial change in the symbol-triggered average but no synergy (or even mild redundancy) all came from cases where a slow OFF cell was spiking and a fast OFF cell was silent.
Synergy and redundancy in a neural model of combinatorial coding
To better understand the origin of synergistic and redundant coding at the level of compound neural symbols and the form of combinatorial coding they imply, we constructed a simple model of retinal processing. We assumed that ganglion cell light responses were described by what is called the LN model, where the visual stimulus is first filtered by the classical receptive field and then passed through a sigmoidal threshold function that truncates negative values to produce a time-varying firing rate (see Materials and Methods). Multiple ganglion cells had different receptive fields and were assumed to be correlated only through their receptive field overlap (also known as conditional independence or lack of “noise correlation”).
For this model of ganglion cell light responses, the classical receptive field can be thought of as a vector in the high dimensional space of all possible visual stimuli (Fig. 5A). The firing rate of each neuron depends only on the overlap between the stimulus and its receptive field, which can be described by an angle θ between the stimulus and the neuron's “preferred direction” in stimulus space (Fig. 5B). This overlap angle summarizes both the spatial and temporal integration of the classical receptive field. We chose the simple case of a uniform distribution of overlap angles for the population of ganglion cells, allowing us to calculate the information that single cells, pairs and triplets convey about the visual stimulus. While the gain of neurons might also be different, we assumed for simplicity that cells had the same, fixed gain, as changes in the angle θ allowed us to sample the full range of independence versus redundancy between two cells.
Similar to our experimental results, we found that 1 ⊗ 1 symbols tend to be either redundant or nearly independent (Fig. 5D, left). On the other hand, 1 ⊗ 0 symbols had many synergistic combinations and some weakly redundant ones (Fig. 5D, right). These results closely resemble the pattern of synergy from silence for different cell types: cells with nearly identical function (Δθ ∼ 0) were weakly redundant, ON/OFF pairs (large Δθ) were independent, and cells that were similar but different (intermediate Δθ) almost all exhibited synergy from silence. Changing the neurons' selectivity or noise level (see Materials and Methods) gave qualitatively similar results (Fig. 5E–G). For triplets, we found that synchronized spiking 1 ⊗ 1 ⊗ 1was always redundant, whereas 1 ⊗ 0 ⊗ 0 patterns demonstrated strong synergistic combinations and some weakly redundant ones (Fig. 5H,I)—in striking resemblance to the results for real ganglion cells. We emphasize that this model does not include stimulus-dependent correlations between cells (also called noise correlations), showing that the combinatorial coding can result from stimulus-induced correlations alone.
Discussion
There have been many different proposals for how to study population neural codes. Here we have studied the information conveyed by specific population symbols, using the retina as a model system. This approach complements other kinds of neural coding analysis, by measuring the information carried by specific multineuron activity patterns, and can thus provide insights or perspective not easily attained from other frameworks. Unlike many previous studies that have focused on synchronous spiking between neurons, we found that combinations of spiking and silence are often the synergistic symbols. This result suggests that more attention should be paid to the silence of neurons in the context of the responses of their neighboring cells, as such silence can significantly enhance the information encoded by a neural population and may enable important discriminations among stimuli (Steuber et al., 2007; Osborne et al., 2008). Furthermore, recent work has shown that weak correlations among many pairs of neurons can add up to have strong effects on larger populations (Schneidman et al., 2006; Shlens et al., 2006, 2009; Tang et al., 2008; Yu et al., 2008; Marre et al., 2009), indicating that neural circuits may have greater scope for forming population codes than previously appreciated.
The combinatorial coding that we found in the retina combines elements of all three hypotheses about population codes, but in ways that are different from those previously thought (Meister et al., 1995; Meister, 1996; Schnitzer and Meister, 2003). Redundancy was found in the synchronous events. At the same time, synchronous spikes encoded more information than either constituent spike alone. Some of this additional information resulted from increased certainty about the visual stimulus (de Ruyter van Steveninck and Bialek, 1988; Gabbiani et al., 1996)—a form of averaging over spikes to achieve higher fidelity. Ganglion cells of different broad functional types were found to be largely independent. Perhaps most surprisingly, synergy was found in combinations of spiking and silence, rather than in synchronous spikes. Why might the retina's population code be structured in this fashion? Redundancy can benefit a neural code by increasing the robustness of representation and by tagging patterns of neural activity to be learned (Barlow, 2001; Ganmor et al., 2011a). At the same time, synergistic compound symbols constitute a huge vocabulary of different visual features multiplexed onto optic nerve fibers and represented at the fastest response time of the circuit.
A combinatorial retinal code that relies on synergy from silence has great flexibility. Because most ganglion cells respond sparsely to natural stimuli, synchronous spike pairs are relatively rare (Fig. 1C,D), but combinations of spiking and silence are quite common. Because the receptive fields of ganglion cells overlap extensively—covering visual space ∼60 times over in the salamander (Segev et al., 2004) and also in the guinea pig (our unpublished data)—a single neuron can form combinatorial firing patterns with many nearby ganglion cells. How can the brain select interesting population symbols to recognize? Since almost all 1 ⊗ 0 ⊗ 0 ⊗ 0 symbols are synergistic, such symbols could simply be chosen at random. However, if combinations of spiking and silence from ganglion cells of the same functional type were avoided, the brain could significantly enhance the chance that remaining combinations were highly synergistic. Generic learning rules, such as spike-timing-dependent plasticity, may also allow the brain to focus in further on the most informative retinal firing patterns.
How might the central brain recognize combinations of spiking and silence? One possible mechanism involves a simple circuit with feedforward inhibition along with monosynaptic excitation (Fig. 6). Networks of inhibitory interneurons clearly allow cortical circuits to synchronize and oscillate (Traub et al., 1998; Beierlein et al., 2000), but interneurons possess extreme functional diversity (Parra et al., 1998; Gupta et al., 2000), suggesting detailed roles in information processing (Miles, 2000; Beierlein et al., 2003). In particular, many subtypes exhibit very fast and reliable transmission with relatively little spike frequency adaptation or synaptic depression (Gibson et al., 1999; Martina et al., 2000). These properties are ideal for vetoing excitation (Swadlow, 2003; Gabernet et al., 2005), thereby detecting combinations of spiking and silence in the input to a cortical circuit.
Our model of the tuning properties underlying combinatorial coding (Fig. 5) suggests that elaborate circuit mechanisms or strong noise correlations are not required. Receptive field overlap is sufficient to give rise to such a combinatorial code. Following on the work of Barlow and Attneave and later Atick and Redlich, it has been common to think of the activity of nearby retinal ganglion cells are independent and for this independence to constitute a fundamental design principle of the retina (Attneave, 1954; Barlow, 1961; Atick, 1992; Atick and Redlich, 1992). However, direct measurements show that nearby cells have strongly overlapping receptive fields and different feature selectivity that give rise to complex patterns of significant signal correlation as well as noise correlation (Puchalla et al., 2005; Segev et al., 2006). The signal correlation between pairs of ganglion cells depends on their shared circuitry, just as does their noise correlation. Therefore, we suggest that this pattern of signal correlation may be a design principle of the retina. Such signal correlation then can give rise to the synergy and redundancy that we see among groups of ganglion cells.
Recent work has shown that weak correlations among many pairs of neurons can add up to have strong effects on larger populations (Schneidman et al., 2006; Shlens et al., 2006, 2009; Tang et al., 2008; Yu et al., 2008; Marre et al., 2009; Ganmor et al., 2011b), indicating that neural circuits may have greater scope for forming population codes than previously appreciated. Similarly, we found that synergy from silence was greatly enhanced for 1 ⊗ 0 ⊗ 0 ⊗ 0 symbols compared to 1 ⊗ 0 symbols.
The simple nature of this model in Figure 5 implies that combinatorial coding is not highly specific to the processing carried out in the retina, suggesting that similar results may be found in other neural circuits (Osborne et al., 2008). As the methods we have used to analyze the retinal code can readily be extended to other neural systems, this approach promises to yield new insights into the nature of population neural codes elsewhere in the brain.
Footnotes
This work was supported by a grant from the National Eye Institute (EY-014196) and a Pew Scholarship (M.J.B.). We thank Markus Meister and Adrienne Fairhall for critical discussions of this manuscript, and Nadiya Tkachuk for her help with the guinea pig retina experiments.
References
- Abbott LF, Dayan P. The effect of correlated variability on the accuracy of a population code. Neural Comput. 1999;11:91–101. doi: 10.1162/089976699300016827. [DOI] [PubMed] [Google Scholar]
- Abeles M. Corticonics: neural circuits of the cerebral cortex. Cambridge, UK: Cambridge UP; 1991. [Google Scholar]
- Atick JJ. Could information theory provide an ecological theory of sensory processing? Network. 1992;3:213–251. doi: 10.3109/0954898X.2011.638888. [DOI] [PubMed] [Google Scholar]
- Atick JJ, Redlich AN. What does the retina know about natural scenes? Neural Comput. 1992;4:196–210. [Google Scholar]
- Attneave F. Some informational aspects of visual perception. Psychol Rev. 1954;61:183–193. doi: 10.1037/h0054663. [DOI] [PubMed] [Google Scholar]
- Averbeck BB, Latham PE, Pouget A. Neural correlations, population coding and computation. Nat Rev Neurosci. 2006;7:358–366. doi: 10.1038/nrn1888. [DOI] [PubMed] [Google Scholar]
- Barlow H. Redundancy reduction revisited. Network. 2001;12:241–253. [PubMed] [Google Scholar]
- Barlow HB. Possible principles underlying the transformation of sensory messages. In: Rosenblith WA, editor. Sensory communication. Cambridge, MA: MIT; 1961. pp. 217–234. [Google Scholar]
- Barlow HB, Levick WR. The mechansism of directionally selective units in the rabbit's retina. J Physiol. 1965;178:477–504. doi: 10.1113/jphysiol.1965.sp007638. [DOI] [PMC free article] [PubMed] [Google Scholar]
- Beierlein M, Gibson JR, Connors BW. A network of electrically coupled interneurons drives synchronized inhibition in neocortex. Nat Neurosci. 2000;3:904–910. doi: 10.1038/78809. [DOI] [PubMed] [Google Scholar]
- Beierlein M, Gibson JR, Connors BW. Two dynamically distinct inhibitory networks in layer 4 of the neocortex. J Neurophysiol. 2003;90:2987–3000. doi: 10.1152/jn.00283.2003. [DOI] [PubMed] [Google Scholar]
- Bell AJ, Sejnowski TJ. The “independent components” of natural scenes are edge filters. Vision Res. 1997;37:3327–3338. doi: 10.1016/s0042-6989(97)00121-1. [DOI] [PMC free article] [PubMed] [Google Scholar]
- Bezzi M. Quantifying the information transmitted in a single stimulus. Biosystems. 2007;89:4–9. doi: 10.1016/j.biosystems.2006.04.009. [DOI] [PubMed] [Google Scholar]
- Brenner N, Strong SP, Koberle R, Bialek W, de Ruyter van Steveninck RR. Synergy in a neural code. Neural Comput. 2000;12:1531–1552. doi: 10.1162/089976600300015259. [DOI] [PubMed] [Google Scholar]
- Burkhardt DA, Fahey PK, Sikora M. Responses of ganglion cells to contrast steps in the light-adapted retina of the tiger salamander. Vis Neurosci. 1998;15:219–229. doi: 10.1017/s0952523898152021. [DOI] [PubMed] [Google Scholar]
- Butts DA. How much information is associated with a particular stimulus? Network. 2003;14:177–187. [PubMed] [Google Scholar]
- Chechik G, Anderson MJ, Bar-Yosef O, Young ED, Tishby N, Nelken I. Reduction of information redundancy in the ascending auditory pathway. Neuron. 2006;51:359–368. doi: 10.1016/j.neuron.2006.06.030. [DOI] [PubMed] [Google Scholar]
- Dan Y, Alonso JM, Usrey WM, Reid RC. Coding of visual information by precisely correlated spikes in the lateral geniculate nucleus. Nat Neurosci. 1998;1:501–507. doi: 10.1038/2217. [DOI] [PubMed] [Google Scholar]
- de Ruyter van Steveninck RR, Bialek W. Real-time performance of a movement sensitive neuron in the blowfly visual system: Coding and information transfer in short spike sequences. Proc R Soc Lond Ser B. 1988;234:379–414. [Google Scholar]
- DeWeese MR, Meister M. How to measure the information gained from one symbol. Network. 1999;10:325–340. [PubMed] [Google Scholar]
- Fairhall AL, Burlingame CA, Narasimhan R, Harris RA, Puchalla JL, Berry MJ., 2nd Selectivity for multiple stimulus features in retinal ganglion cells. J Neurophysiol. 2006;96:2724–2738. doi: 10.1152/jn.00995.2005. [DOI] [PubMed] [Google Scholar]
- Gabbiani F, Metzner W, Wessel R, Koch C. From stimulus encoding to feature extraction in weakly electric fish. Nature. 1996;384:564–567. doi: 10.1038/384564a0. [DOI] [PubMed] [Google Scholar]
- Gabernet L, Jadhav SP, Feldman DE, Carandini M, Scanziani M. Somatosensory integration controlled by dynamic thalamocortical feed-forward inhibition. Neuron. 2005;48:315–327. doi: 10.1016/j.neuron.2005.09.022. [DOI] [PubMed] [Google Scholar]
- Ganmor E, Segev R, Schneidman E. Sparse low-order interaction network underlies a highly correlated and learnable neural population code. Proc Natl Acad Sci U S A. 2011a;108:9679–9684. doi: 10.1073/pnas.1019641108. [DOI] [PMC free article] [PubMed] [Google Scholar]
- Ganmor E, Segev R, Schneidman E. The architecture of functional interaction networks in the retina. J Neurosci. 2011b;31:3044–3054. doi: 10.1523/JNEUROSCI.3682-10.2011. [DOI] [PMC free article] [PubMed] [Google Scholar]
- Gat I, Tishby N. Synergy and redundancy among brain cells of behaving monkeys. In: Kearns MS, Solla SA, Cohn DA, editors. Advances in neural information processing systems. Cambridge, MA: MIT; 1999. pp. 465–471. [Google Scholar]
- Gawne TJ, Richmond BJ. How independent are the messages carried by adjacent inferior temporal cortical neurons? J Neurosci. 1993;13:2758–2771. doi: 10.1523/JNEUROSCI.13-07-02758.1993. [DOI] [PMC free article] [PubMed] [Google Scholar]
- Gibson JR, Beierlein M, Connors BW. Two networks of electrically coupled inhibitory neurons in neocortex. Nature. 1999;402:75–79. doi: 10.1038/47035. [DOI] [PubMed] [Google Scholar]
- Gollisch T, Meister M. Eye smarter than scientists believed: neural computations in circuits of the retina. Neuron. 2010;65:150–164. doi: 10.1016/j.neuron.2009.12.009. [DOI] [PMC free article] [PubMed] [Google Scholar]
- Gupta A, Wang Y, Markram H. Organizing principles for a diversity of GABAergic interneurons and synapses in the neocortex. Science. 2000;287:273–278. doi: 10.1126/science.287.5451.273. [DOI] [PubMed] [Google Scholar]
- Hosoya T, Baccus SA, Meister M. Dynamic predictive coding by the retina. Nature. 2005;436:71–77. doi: 10.1038/nature03689. [DOI] [PubMed] [Google Scholar]
- Ishikane H, Gangi M, Honda S, Tachibana M. Synchronized retinal oscillations encode essential information for escape behavior in frogs. Nat Neurosci. 2005;8:1087–1095. doi: 10.1038/nn1497. [DOI] [PubMed] [Google Scholar]
- Marre O, El Boustani S, Frégnac Y, Destexhe A. Prediction of spatiotemporal patterns of neural activity from pairwise correlations. Phys Rev Lett. 2009;102:138101. doi: 10.1103/PhysRevLett.102.138101. [DOI] [PubMed] [Google Scholar]
- Martina M, Vida I, Jonas P. Distal initiation and active propagation of action potentials in interneuron dendrites. Science. 2000;287:295–300. doi: 10.1126/science.287.5451.295. [DOI] [PubMed] [Google Scholar]
- Meister M. Multineuronal codes in retinal signaling. Proc Natl Acad Sci U S A. 1996;93:609–614. doi: 10.1073/pnas.93.2.609. [DOI] [PMC free article] [PubMed] [Google Scholar]
- Meister M, Lagnado L, Baylor DA. Concerted signaling by retinal ganglion cells. Science. 1995;270:1207–1210. doi: 10.1126/science.270.5239.1207. [DOI] [PubMed] [Google Scholar]
- Miles R. Perspectives: neurobiology. Diversity in inhibition. Science. 2000;287:244–246. doi: 10.1126/science.287.5451.244. [DOI] [PubMed] [Google Scholar]
- Narayanan NS, Kimchi EY, Laubach M. Redundancy and synergy of neuronal ensembles in motor cortex. J Neurosci. 2005;25:4207–4216. doi: 10.1523/JNEUROSCI.4697-04.2005. [DOI] [PMC free article] [PubMed] [Google Scholar]
- Nirenberg S, Carcieri SM, Jacobs AL, Latham PE. Retinal ganglion cells act largely as independent encoders. Nature. 2001;411:698–701. doi: 10.1038/35079612. [DOI] [PubMed] [Google Scholar]
- Olveczky BP, Baccus SA, Meister M. Segregation of object and background motion in the retina. Nature. 2003;423:401–408. doi: 10.1038/nature01652. [DOI] [PubMed] [Google Scholar]
- Osborne LC, Palmer SE, Lisberger SG, Bialek W. The neural basis for combinatorial coding in a cortical population response. J Neurosci. 2008;28:13522–13531. doi: 10.1523/JNEUROSCI.4390-08.2008. [DOI] [PMC free article] [PubMed] [Google Scholar]
- Parra P, Gulyás AI, Miles R. How many subtypes of inhibitory cells in the hippocampus? Neuron. 1998;20:983–993. doi: 10.1016/s0896-6273(00)80479-1. [DOI] [PubMed] [Google Scholar]
- Petersen RS, Panzeri S, Diamond ME. Population coding of stimulus location in rat somatosensory cortex. Neuron. 2001;32:503–514. doi: 10.1016/s0896-6273(01)00481-0. [DOI] [PubMed] [Google Scholar]
- Pola G, Thiele A, Hoffmann KP, Panzeri S. An exact method to quantify the information transmitted by different mechanisms of correlational coding. Network. 2003;14:35–60. doi: 10.1088/0954-898x/14/1/303. [DOI] [PubMed] [Google Scholar]
- Pouille F, Scanziani M. Routing of spike series by dynamic circuits in the hippocampus. Nature. 2004;429:717–723. doi: 10.1038/nature02615. [DOI] [PubMed] [Google Scholar]
- Puchalla JL, Schneidman E, Harris RA, Berry MJ. Redundancy in the population code of the retina. Neuron. 2005;46:493–504. doi: 10.1016/j.neuron.2005.03.026. [DOI] [PubMed] [Google Scholar]
- Reich DS, Mechler F, Victor JD. Independent and redundant information in nearby cortical neurons. Science. 2001;294:2566–2568. doi: 10.1126/science.1065839. [DOI] [PubMed] [Google Scholar]
- Riehle A, Grün S, Diesmann M, Aertsen A. Spike synchronization and rate modulation differentially involved in motor cortical function. Science. 1997;278:1950–1953. doi: 10.1126/science.278.5345.1950. [DOI] [PubMed] [Google Scholar]
- Rieke F, Warland D, de Ruyter van Steveninck RR, Bialek W. Spikes: exploring the neural code. Cambridge, MA: MIT; 1997. [Google Scholar]
- Rodieck RW, Stone J. Response of cat retinal ganglion cells to moving visual patterns. J Neurophysiol. 1965;28:819–832. doi: 10.1152/jn.1965.28.5.819. [DOI] [PubMed] [Google Scholar]
- Schneidman E, Bialek W, Berry MJ., II . Cambridge, MA: MIT; 2002. An information theoretic approach to the functional classification of neurons. [Google Scholar]
- Schneidman E, Bialek W, Berry MJ., 2nd Synergy, redundancy, and independence in population codes. J Neurosci. 2003;23:11539–11553. doi: 10.1523/JNEUROSCI.23-37-11539.2003. [DOI] [PMC free article] [PubMed] [Google Scholar]
- Schneidman E, Berry MJ, 2nd, Segev R, Bialek W. Weak pairwise correlations imply strongly correlated network states in a neural population. Nature. 2006;440:1007–1012. doi: 10.1038/nature04701. [DOI] [PMC free article] [PubMed] [Google Scholar]
- Schnitzer MJ, Meister M. Multineuronal firing patterns in the signal from eye to brain. Neuron. 2003;37:499–511. doi: 10.1016/s0896-6273(03)00004-7. [DOI] [PubMed] [Google Scholar]
- Schwartz G, Harris R, Shrom D, Berry MJ., 2nd Detection and prediction of periodic patterns by the retina. Nat Neurosci. 2007a;10:552–554. doi: 10.1038/nn1887. [DOI] [PMC free article] [PubMed] [Google Scholar]
- Schwartz G, Taylor S, Fisher C, Harris R, Berry MJ., 2nd Synchronized firing among retinal ganglion cells signals motion reversal. Neuron. 2007b;55:958–969. doi: 10.1016/j.neuron.2007.07.042. [DOI] [PMC free article] [PubMed] [Google Scholar]
- Segev R, Goodhouse J, Puchalla J, Berry MJ., 2nd Recording from all of the ganglion cells in a patch of the retina. Nat Neurosci. 2004;7:1154–1161. doi: 10.1038/nn1323. [DOI] [PubMed] [Google Scholar]
- Segev R, Puchalla J, Berry MJ., 2nd Functional organization of ganglion cells in the salamander retina. J Neurophysiol. 2006;95:2277–2292. doi: 10.1152/jn.00928.2005. [DOI] [PubMed] [Google Scholar]
- Shadlen MN, Newsome WT. Noise, neural codes and cortical organization. Curr Opin Neurobiol. 1994;4:569–579. doi: 10.1016/0959-4388(94)90059-0. [DOI] [PubMed] [Google Scholar]
- Shamir M, Sompolinsky H. Nonlinear population codes. Neural Comput. 2004;16:1105–1136. doi: 10.1162/089976604773717559. [DOI] [PubMed] [Google Scholar]
- Shapley R, Victor JD. The contrast gain control of the cat retina. Vision Res. 1979a;19:431–434. doi: 10.1016/0042-6989(79)90109-3. [DOI] [PubMed] [Google Scholar]
- Shapley RM, Victor JD. Nonlinear spatial summation and the contrast gain control of cat retinal ganglion cells. J Physiol. 1979b;290:141–161. doi: 10.1113/jphysiol.1979.sp012765. [DOI] [PMC free article] [PubMed] [Google Scholar]
- Shlens J, Field GD, Gauthier JL, Grivich MI, Petrusca D, Sher A, Litke AM, Chichilnisky EJ. The structure of multi-neuron firing patterns in primate retina. J Neurosci. 2006;26:8254–8266. doi: 10.1523/JNEUROSCI.1282-06.2006. [DOI] [PMC free article] [PubMed] [Google Scholar]
- Shlens J, Field GD, Gauthier JL, Greschner M, Sher A, Litke AM, Chichilnisky EJ. The structure of large-scale synchronized firing in primate retina. J Neurosci. 2009;29:5022–5031. doi: 10.1523/JNEUROSCI.5187-08.2009. [DOI] [PMC free article] [PubMed] [Google Scholar]
- Smirnakis SM, Berry MJ, Warland DK, Bialek W, Meister M. Adaptation of retinal processing to image contrast and spatial scale. Nature. 1997;386:69–73. doi: 10.1038/386069a0. [DOI] [PubMed] [Google Scholar]
- Steuber V, Mittmann W, Hoebeek FE, Silver RA, De Zeeuw CI, Häusser M, De Schutter E. Cerebellar LTD and pattern recognition by Purkinje cells. Neuron. 2007;54:121–136. doi: 10.1016/j.neuron.2007.03.015. [DOI] [PMC free article] [PubMed] [Google Scholar]
- Strong SP, Koberle R, de Ruyter van Steveninck RR, Bialek W. Entropy and information in neural spike trains. Phys Rev Lett. 1998;80:197–200. [Google Scholar]
- Swadlow HA. Fast-spike interneurons and feedforward inhibition in awake sensory neocortex. Cereb Cortex. 2003;13:25–32. doi: 10.1093/cercor/13.1.25. [DOI] [PubMed] [Google Scholar]
- Tang A, Jackson D, Hobbs J, Chen W, Smith JL, Patel H, Prieto A, Petrusca D, Grivich MI, Sher A, Hottowy P, Dabrowski W, Litke AM, Beggs JM. A maximum entropy model applied to spatial and temporal correlations from cortical networks in vitro. J Neurosci. 2008;28:505–518. doi: 10.1523/JNEUROSCI.3359-07.2008. [DOI] [PMC free article] [PubMed] [Google Scholar]
- Traub RD, Spruston N, Soltesz I, Konnerth A, Whittington MA, Jefferys GR. Gamma-frequency oscillations: a neuronal population phenomenon, regulated by synaptic and intrinsic cellular processes, and inducing synaptic plasticity. Prog Neurobiol. 1998;55:563–575. doi: 10.1016/s0301-0082(98)00020-3. [DOI] [PubMed] [Google Scholar]
- Vaadia E, Haalman I, Abeles M, Bergman H, Prut Y, Slovin H, Aertsen A. Dynamics of neuronal interactions in monkey cortex in relation to behavioural events. Nature. 1995;373:515–518. doi: 10.1038/373515a0. [DOI] [PubMed] [Google Scholar]
- van Hateren JH, van der Schaaf A. Independent component filters of natural images compared with simple cells in primary visual cortex. Proc R Soc Lond B Biol Sci. 1998;265:359–366. doi: 10.1098/rspb.1998.0303. [DOI] [PMC free article] [PubMed] [Google Scholar]
- Yu S, Huang D, Singer W, Nikolic D. A small world of neuronal synchrony. Cereb Cortex. 2008;18:2891–2901. doi: 10.1093/cercor/bhn047. [DOI] [PMC free article] [PubMed] [Google Scholar]
- Zohary E, Shadlen MN, Newsome WT. Correlated neuronal discharge rate and its implications for psychophysical performance. Nature. 1994;370:140–143. doi: 10.1038/370140a0. [DOI] [PubMed] [Google Scholar]