Abstract
Molecular dynamics simulation is utilized to investigate the ionic transport of NaCl in solution through a graphene nanopore under an applied electric field. Results show the formation of concentration polarization layers in the vicinity of the graphene sheet. The nonuniformity of the ion distribution gives rise to an electric pressure which drives vortical motions in the fluid if the electric field is sufficiently strong to overcome the influence of viscosity and thermal fluctuations. The relative importance of hydrodynamic transport and thermal fluctuations in determining the pore conductivity is investigated. A second important effect that is observed is the mass transport of water through the nanopore, with an average velocity proportional to the applied voltage and independent of the pore diameter. The flux arises as a consequence of the asymmetry in the ion distribution which can be attributed to differing mobilities of the sodium and chlorine ions, and, to the polarity of water molecules. The accumulation of liquid molecules in the vicinity of the nanopore due to reorientation of the water dipoles by the local electric field is seen to result in a local increase in the liquid density. Results confirm that the electric conductance is proportional to the nanopore diameter for the parameter regimes that we simulated. The occurrence of fluid vortices is found to result in an increase in the effective electrical conductance.
1. Introduction
Ionic conduction through nanometer–sized channels or pores is a common theme in biological systems as well as in various manufactured materials such as membranes and synthetic nanopores [1, 2, 3, 4, 5, 6]. Theoretical as well as experimental aspects of the problem have attracted increasing interest in the past decade. Molecular dynamics (MD) simulation is an effective tool for exploring these nanoscale phenomena. It has the advantage of being able to relate the observables directly to the molecular properties of the solid and liquid, once an appropriate intermolecular potential is given, without the need for too many simplifying assumptions. Various aspects of the problem, such as ionic current rectification, DNA translocation and water transport have already been reported in the literature [7, 8, 9, 10, 11, 12].
MD simulations in the context of translocation of single stranded and double stranded DNA through biological α-Hemolysin and synthetic nanopores have been reported [13, 8, 9, 14]. It was found that the open-pore current increases linearly with the applied voltage, and, obeys Ohm's law for voltages that are no more than of the order of a Volt. The distribution of the electric potential around the pore, the translocation speed of DNA, the interactions between the DNA molecule with the pore wall, as well as strategies for controlling the transolcation speed have been considered [15, 16]. Recently, Sathe et al. [11] investigated the translocation of DNA through a graphene nanopore using MD simulations, and suggested that nucleotide pairs can be discriminated using graphene nanopores under suitable bias conditions.
There are, however, a number of open problems that have not been understood. First, due to the geometry of the system, the ions may accumulate and form a concentration polarization layer (CPL) in the vicinity of the membrane. The influence of the nonuniformity of the ion concentration in this charge separated Debye layer on the ionic current has not been well understood. Secondly, open questions remain on the effect of hydrodynamic flow on the ionic current as well as on DNA translocation speeds. Ghosal [17, 18] presented a simple hydrodynamic calculation for the electrophoretic speed of the polymer, modeled locally as a long cylindrical object centered on the axis of the pore. The calculation yielded analytical results in close agreement with experimental measurements [19, 20]. In a related problem where the electrophoretic force was measured with the DNA immobilized in the pore, numerical [21] as well as analytical [22] models based on the hypothesis that the hydrodynamic drag was the primary resistive force yielded results in close agreement to the experiments. These results point to the possibility that hydrodynamics might play an important role in determining DNA translocation speeds. Hydrodynamics also plays an important role in a related problem; when a direct current is applied across an ion-selective nanoporous membrane or through a nanochannel with overlapping Debye layers, it is known, that, micro fluid vortices may be observed due to hydrodynamic instability, and these vortices are capable of enhancing the ionic current in the so called “overlimiting regime” [23].
The purpose of the present study is to discuss the influence of the CPL and fluid convection on ionic transport through nanochannels using MD simulations. The rest of this paper is organized as follows: in Section 2, we present the physical model and describe the numerical approach. The simulation results are analysed in detail in Section 3. Finally, some concluding remarks are made in Section 4.
2. Method
2.1. System setup
The molecular simulations are conducted in a cubic box with dimensions of Lx = 5.112 nm, Ly = 5.184 nm, Lz = 10 nm. The origin of the coordinates is set in the center of the box. The graphene sheet with the size of Lx × Ly, consists of an array of carbon atoms with a planar hexagonal structure (neighboring atoms have a bond lengths of 0.142 nm), localized at the mid-plane, z = 0. A nanopore, with radius a, is constructed by removing the carbon atoms in a central circular patch of the graphene sheet: x2 + y2 < a2. The remainder of the box is then filled with water molecules described by the extended simple point charge (SPC/E) model [24]. Polarization of water molecules is neglected, prior investigations have shown that this is reasonable as long as the field strength does not exceed about 10 V/nm [25]. Salt (NaCl) is introduced at a given concentration of 1M by replacing the required number of water molecules with Na+ and Cl− ions.
2.2. Molecular Dynamics (MD) simulation
The simulations are performed at a constant temperature 300K and pressure of 1 bar with the large scale MD package GROMACS 4.5.4 [26]. The van der Waals (vdW) interaction of the carbon atoms is modeled as uncharged Lennard-Jones (LJ) particles. The graphene-water interaction is considered by a carbon-oxygen LJ potential. This general set up and parameter values has been employed in previous studies [27, 28, 29].
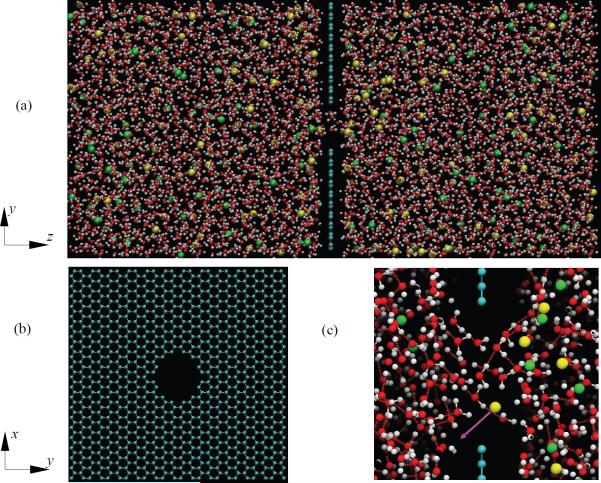
A sketch of the computational setup of the present simulations is depicted in Figure 1. A uniform external electric field is applied in directions perpendicular to the graphene sheet (z-direction). The contributions of the external electric field are described as , where the qi and ri denote the charge and location of the charged atom i respectively, and E is the strength of the external electric field. The LJ interactions are truncated at the cut-off distance r0 = 1.0 nm and the particle mesh Ewald (PME) method [30] with a real-space cut-off of 1 nm is utilized to treat the long-range electrostatic interactions. Periodic boundary conditions are imposed in all directions. The time step in all simulations is set to be 2 fs.
Figure 1.
(a) Sketch of computational setup. Cyan colour stands for carbon atoms, red and white colour represents the oxygen and hydrogen atoms of a SPC/E water molecular respectively, green colour represents sodium ions, and yellow is chlorine ions. Electric field is applied in z- direction. (b) A graphene membrane with a nanopore of diameter d=1.5nm. (c) A single frame of the simulation showing the moment a chlorine ion (yellow) is about to transit the nanopore in the direction indicated by the purple arrow following application of the electric field. The red lines between oxygen and hydrogen atoms denote hydrogen bonds.
For the sake of computational efficiency, all of the carbon atoms are frozen during the simulations[12]. Previous investigations have shown that this only has a minor influence on the dynamics of the adjacent water[31, 32]. Further, although edge dynamics[33], partial charges[34], or out-of-plane displacement[35] might affect the ionic and water transport, following Suk and Aluru[12], they are not considered in this study for the sake of simplicity. Minimization of energy is performed with the steepest descent method on the initial system. Then the system is evolved for 2 ns to achieve a state of statistical equilibrium. In all cases, statistics are collected during the last 8 ns and samples are taken every 0.2 ps.
2.3. Data analysis
To analyse the statistics of the macroscopic physical variables, the spatial location and velocity vectors of the particles are transformed to cylindrical coordinates. Data is presented in the r – z plane which is partitioned into gridded cells with interval range (△r,△z).
IONIC CONCENTRATION
The number density of Na and Cl ions in the cells are calculated by ρi = Nc/Vc, where Nc and Vc are the number of ions and volume of the corresponding cell respectively.
WATER FLUX
The number of oxygen atoms Nw through the nanopore in time interval △t is calculated to obtain the water flux. The average water velocity vp in the axial direction through the nanopore is given by vp = mNw/△tρ0A, in which m is the mass of a water molecule, ρ0 is water density in the bulk and A = πa2 is the area of the nanopore.
FLOW FIELD
For the cell at (r, z) containing Nc water molecules, the transient local velocity vector can be obtained by
where rOi(tj) is the location vector of oxygen atom i at time tj. △t is the time interval between two successive frames. We take △t = 2 ps in the present study. The velocity field of the equilibrium state is then calculated by averaging the transient velocity over time. To check the independence of physical quantities with respect to grid size, the probability density function (PDF) of the axial velocity of water at (0, 0) is plotted in Figure 2 for different grid sizes. After determining the average velocity and standard error σ, it is seen that the PDF is well represented by a Gaussian:
Furthermore, the PDFs are nearly independent of the computational grid size. In the present study, we set △z = 0.2 nm.
Figure 2.
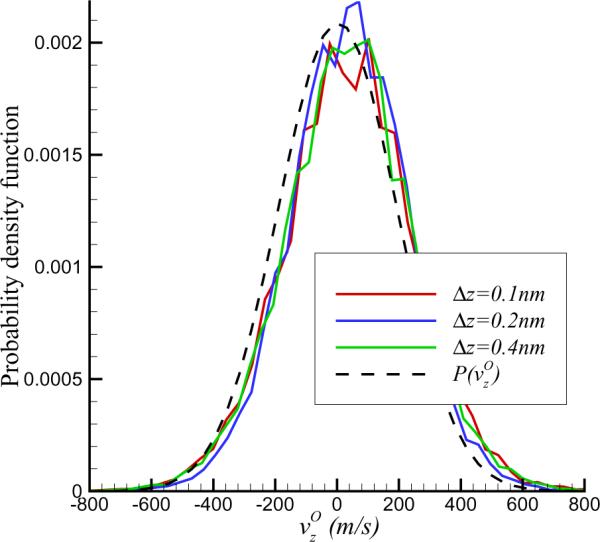
Probability distribution function of z-component of flow velocity at the nanopore for different meshes. It also shows that the velocity distribution can be well represented by a Gaussian.
IONIC CURRENT
The ionic current is obtained by I = eNi/△t, where Ni stands for the number of Na or Cl ions across the graphene nanopore in time interval △t, e is the amount of charge per electron.
3. Results and Discussions
3.1. Concentration polarization
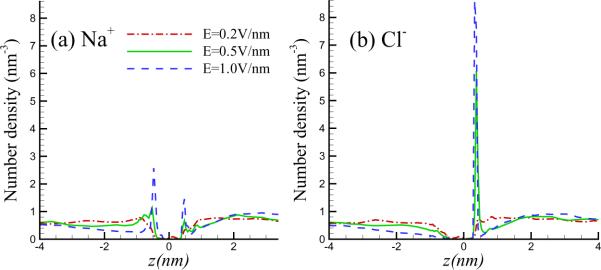
If the pore size approaches zero, clearly a polarized double layer would form adjacent to the graphene sheet. For a finite, but nevertheless sufficiently small pore size, a nonuniform ion distribution (concentration polarization) is expected adjacent to the sheet. The profiles of ionic number density along z-axis are plotted in Figure 3, where z = 0 corresponds to the graphene sheet. It is interesting that the sodium and chlorine ions both form concentration polarization layers (CPL) on either side of the graphene sheet. However, their distributions show some asymmetry. Due to size exclusion, the ions cannot approach the graphene sheet closer than about an ionic radius. The combination of electrostatic and these steric forces result in the appearance of a concentration peak. In the case of the chlorine ions, the concentration peak is located a distance Dcl = 0.375 nm from the sheet. This distance is found to be independent of the applied field strength. The CPL can also be observed for the sodium ions on the other side; however, the amplitude of the peak is comparatively weak. For weak applied fields (e.g. E = 0.2 V/nm) the CPL is not as well defined. A second smaller peak of sodium ions may be observed on the other side of the membrane. The asymmetry between the two kinds of ions may be partly due to the higher mobility of the chlorine ions, and, partly due to differences in the van der Waals interactions between the two kinds of ions with the carbon atoms in the graphene sheet. The peak in the ionic concentration profile is found to increase monotonically with increasing electric field.
Figure 3.
Number density profile of Na and Cl ions in z-direction with d=1.5nm for different field strength, to show the presence of concentration polarization layer.
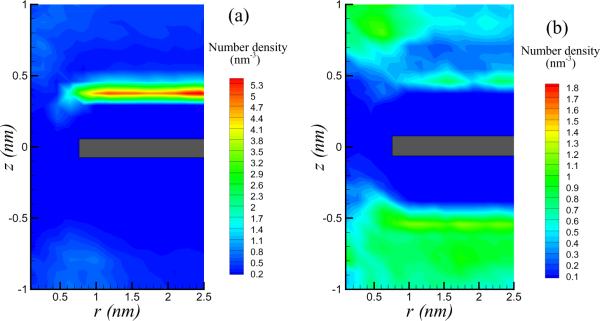
In Figure 4, the number density of Cl ions with E = 0.5 V/nm and nanopore diameter d = 1.5 nm is observed to exhibit a well defined peak. The nonuniformity of the ionic distribution will give rise to spatial gradients of the electric field strength near the membrane, especially in regions close to the nanopore. Consequently, variations of the electric pressure is to be expected, which might drive a flow, as long as these forces are strong enough to overcome viscous resistance and are not completely masked by the fluctuating Brownian forces (thermal fluctuations).
Figure 4.
Nonuniform distributions of number density (in units of M) of chlorine (left panel) and sodium (right panel) ion with d=1.5 nm and E=0.5 V/nm. The grey rectangles at z=0 marks the graphene sheet. Ionic gradients lead to electric pressure, which drives nanoscale vortices near the pore.
3.2. Flow fields
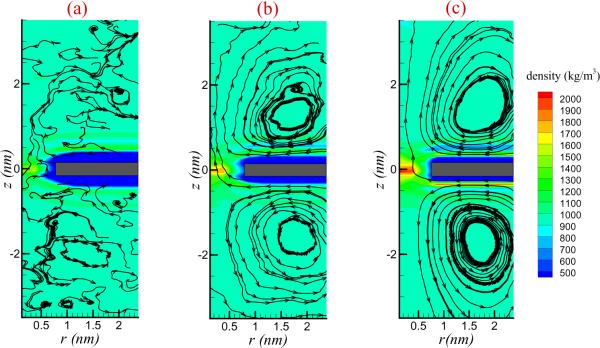
The formation of the CPL is expected to generate a fluid flow in the vicinity of the interface. This is indeed seen in the simulations. The flow streamlines for the nanopore of diameter d = 1.5 nm, together with the distribution of water density is shown in Figure 5 with different values of electric field strength. When the field is sufficiently large, e.g., E = 0.5 and 1.0 V/nm, vortices of a spatial scale on the order of nanometers are clearly observed. When E=0.2 V/nm, the electric pressure appears too weak to generate sustained micro vortices against the influence of thermal fluctuations.
Figure 5.
Flow fields and water density (in units of kg/m3) distribution of salt solution for a nanopore of diameter d=1.5 nm with (a) E=0.2 V/nm; (b) E=0.5 V/nm; (c) E=1.0 V/nm. The rectangles (colour grey near z=0) marks the graphene sheet. For strong fields, as in panel (c), a well defined vortical flow is seen but for weak electric fields the bulk motion of the fluid is difficult to distinguish from the background thermal fluctuations.
An interesting physical insight that emerges from these simulations is that there appears to be a marked asymmetry in the distribution of the cations and anions and that of water density. This is most likely due to a combination of three factors. First, as we have mentioned above, there is an approximately 30 percent difference in mobility between sodium and chlorine ions. Second, the van der Waals interactions between Na and C, Cl and C differ significantly. The third, which has been reported by previous researchers [36, 37, 38, 39], is that the direction of the electric field could have significant effects on the interfacial water structures, as well as on the wetting behaviour of the solid membrane, due to the polarity of the water molecules. A consequence of this asymmetry, is that there is a flux of water through the nanopore as may be seen in the appearance of the streamlines in Figure 5. The average flow velocity vp, describing water crossing the nanopore, is presented in Figure 6 for different electric field strengths and pore diameters. It shows that generally the average velocity at the nanopore is proportional to the applied voltage, and nearly independent of the diameter of the nanopore for the parameters we simulated.
Figure 6.
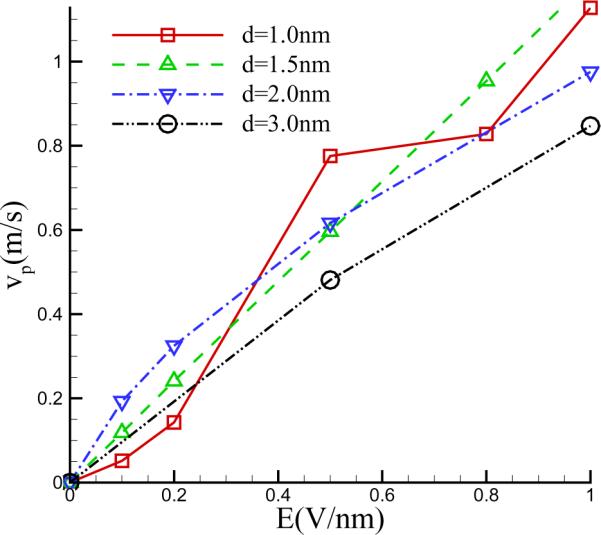
Variation of the mean flow (vp) at the nanopore with the applied electric field for different pore diameters.
A region of high water density is seen at the center of the nanopore. For E = 1.0 V/nm, the local water density can be as high as 2043 kg/m3. The accumulation of water in the nanopore appears to originate from re-orientation of the water dipole moments when the external voltage is applied. To describe the orientation of water molecules, we define an average over the x–y plane of the angle ϕ between the dipole moment vector of the water molecule and the z-axis. In the absence of an electric field, the orientation of the dipoles is completely random corresponding to ϕ = 90°. Figure 7 shows that with increasing electric field strengths, the dipoles prefer an axial orientation. For a given z-location, it increases with the field strength. The degree of ordering increases as one approaches the pore where the dipoles favour to be parallel to the wall of the nanopore. This is consistent with previous studies on SWCNT where a similar ordering has been observed [40]. Such ordering allows closer packing of the water molecules leading to a rise in density in the pore region.
Figure 7.
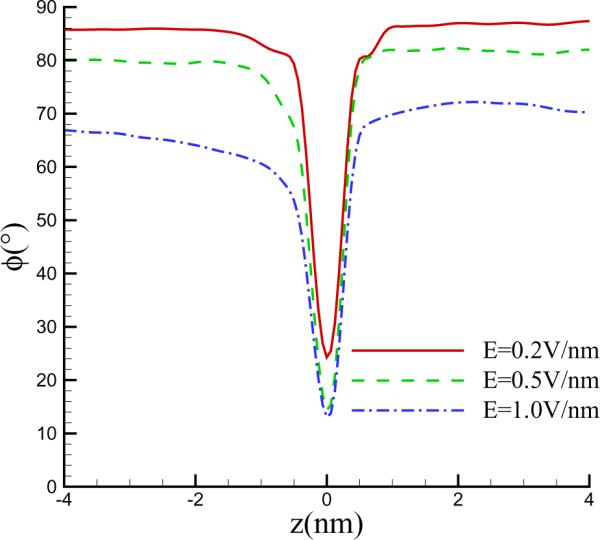
Average angle between the dipole moment and the z-axis for a pore diameter of d = 1.5 nm. Reduction of the angle due to the re-orientation of the dipole moment by the field is strongest in the pore region where the dipoles favour to be parallel to the wall of the nanopore.
3.3. Voltage current relations
Recent experimental measurements have produced apparently conflicting results on the dependence of pore conductance on pore radius. Garaj et al. [41] reported that the pore conductance is proportional to the pore diameter, whereas Schneider et al. [42] reported it to be proportional to the pore area. The former result would correspond to a hole in an infinitely thin membrane in a homogeneous infinite conducting medium. The latter would correspond to a cylindrical conduit of diameter much less than the length of the cylinder [43]. Since the former result is to be expected if the thickness of graphene can be ignored and the electrolyte solution is assumed to obey Ohm's law, some researchers [3] have speculated that the discrepancy between the experiment of Schneider et al. and the theoretical result for a hole in a thin sheet might originate from the fact that their graphene sheet was treated with a polymer coating (to reduce nonspecific surface adsorption of DNA). To clarify this, Sathe et al. [11] conducted molecular dynamics simulation for a KCl solution with pore diameters in the range of 2 – 7 nm. They found the dependence of resistance R on pore diameter follows the relationship R ~ 1/d2, which is qualitatively in agreement with the experiment of Schneider et al. [42]. However, quantitatively the resistances they obtained in their simulations were three to four times smaller than the experimental measurements. They attributed the discrepancy to a number of factors including inaccuracies in the force field in their simulations, unknown charge distribution and uncertainties about the exact shape of graphene pores.
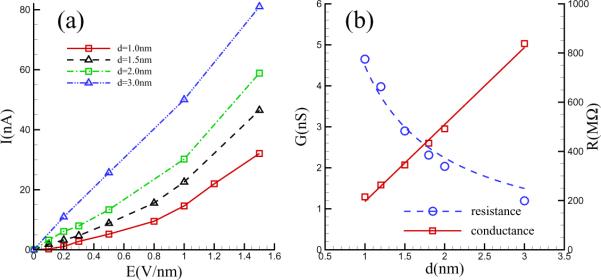
The variation of the current with the applied electric field was extracted from our simulations and is shown in Figure 8 for a number of different pore diameters, d. A linear regime is observed at weak fields (E). For higher applied voltages, it is found the current shows super-linear growth and the nonlinearity is stronger for pores of smaller diameter. Hydrodynamic transport due to the nanoscale vortices could be responsible for this faster than linear increase of the current. A similar phenomenon has also been observed when an external electric field is applied normal to the surface of an ion-selective nanoporous membrane immersed in an electrolyte solution. There, at a critical value of the applied field, the quiescent state undergoes a hydrodynamic instability resulting in the appearance of micro vortices that are responsible for an “overlimiting-current” in the current-voltage relationship [23]. In the nanopore problem however, there is no instability. The hydrodynamic flow is always present, its strength simply increases with the electric field.
Figure 8.
The current vs applied field (left panel) for several different pore diameters. The pore conductance determined from the slope of the initial linear region of the current-voltage characteristic is also shown as a function of the pore diameter (right panel).
Figure 8(b) shows the electric conductance (G) at low fields, which is calculated from the slope of the initial linear segment of the I — V curves. It is seen to be proportional to the nanopore diameter d, which is qualitatively in agreement with the experiments by Garaj et al. [41] and is as expected from the theoretical model where the pore is regarded as a hole in an infinitely thin insulating sheet in a uniform conductor. The resistance obtained for d = 3 nm is R = 199 MΩ, which is comparable to the values reported by Schneider et al [42], though we do not observe their G ∝ d2 dependence on pore diameter. The theoretical result G = σd for a hole of diameter `d' in an insulating sheet in a conducting medium of conductivity `σ' may be used to extract an “effective” conductivity from the data shown in the inset in Figure 8 . The conductivity obtained in this way is σ = 1.879 Sm−1, which is about a factor of 5 smaller than the bulk conductivity, σ = 9.3 Sm−1, for a 1 M NaCl solution. The discrepancy may arise from the fact that there are significant differences between a graphene nanopore immersed in an electrolyte and a hole in an insulating sheet in an Ohmic medium. As we have seen, one important difference lies in the existence of the concentration polarization layer which modifies the electric field distribution near the pore as well as drive a hydrodynamic flow that affects transport properties. The influence of these phenomena on pore conductance is still an open problem. A second source of discrepancy may be a due to a limitation of our computation. In a physical experiment, the nanopore radius is vanishingly small in comparison to the reservoir dimensions, so that essentially all of the electrical resistance arises from the pore. This assumption might not be satisfied as well in our simulated model, since, due to limitations of computational capabilities, the area of the graphene sheet that we constructed, 5nm × 5nm, is quite comparable to the pore diameter of 3 nm. These issues will be investigated further in future studies.
4. Conclusion
Molecular dynamics simulations were performed to study the transport properties of an electrolyte through a nanometer sized pore. Due to the partial blockage of the ionic current by the graphene membrane, a concentration polarization layer (CPL) develops next to the membrane when an external voltage is applied. The CPL is able to induce electric pressure in the fluid adjacent to the pore. If the applied voltage is large enough to overcome the effects of viscosity and Brownian fluctuations, vortices are generated in the fluid near the pore. These nanoscale vortices enhance the ionic current through a mechanism similar to the effect known as “overlimiting current” for perm selective membranes. Owing to the polarization of water molecules, the direction of the electric field might have significant influence on water structure near the graphene surface. This effect, together with the differing mobility and van der Waals attraction to C exhibited by the Cl and Na ions, brings about an asymmetric distribution of ions, and a net flux of water in the direction of the electric field through the pore. The average velocity of this hydrodynamic flow is found to increase approximately linearly with the electric field and appears to be independent of the pore diameter. Orientational order created in the water dipoles by the electric field enhances closer packing of the water dipoles. This is manifested in the appearance of regions of high water density within the pore. The electrical conductance of the system is found to vary linearly with the nanopore diameter, as one might expect from the classical theoretical relation G = σd for a hole in an insulating membrane within a conductor. However, the effective conductivity, G/d is found to be nearly 5 times the bulk conductivity of the electrolyte. The linear dependence of G on d is in accord with the experiments of Garaj et al. but we do not observe the G ∝ d2 dependence reported by Schneider et al. This could be due to differences in experimental techniques as a result of which their situation does not correspond to the model studied in this paper.
Acknowledgments
This work was supported by the National Science Foundation of China (Grant No. 10872122), Research Fund for the Doctoral Program of Higher Education of China (Grant No. 20103108110004), and Shanghai Program for Innovative Research Team in Universities. This project was supported in part by the American Recovery and Reinvestment Act (ARRA) funds through grant number R01 HG001234 to Northwestern University (USA) from the National Human Genome Research Institute, National Institutes of Health.
References
- [1].Declan A. Doyle, Cabral João Morais, Pfuetzner Richard A., Kuo Anling, Gulbis Jacqueline M., Cohen Steven L., Chait Brian T., MacKinnon Roderick. The structure of the potassium channel: Molecular basis of K+ conduction and selectivity. Science. 1998;280(5360):69–77. doi: 10.1126/science.280.5360.69. [DOI] [PubMed] [Google Scholar]
- [2].Minsoung Rhee, Burns Mark A. Nanopore sequencing technology: research trends and applications. Trends in Biotechnology. 2006 Dec;24(12):580–586. doi: 10.1016/j.tibtech.2006.10.005. [DOI] [PubMed] [Google Scholar]
- [3].Bala Murali Venkatesan, Bashir Rashid. Nanopore sensors for nucleic acid analysis. Nat Nano. 2011 Oct;6(10):615–624. doi: 10.1038/nnano.2011.129. [DOI] [PubMed] [Google Scholar]
- [4].Daniel Branton, Deamer David W, Marziali Andre, Bayley Hagan, Benner Steven A, Butler Thomas, Di Ventra Massimiliano, Garaj Slaven, Hibbs Andrew, Huang Xiaohua, Jovanovich Stevan B, Krstic Predrag S, Lindsay Stuart, Ling Xinsheng Sean, Mastrangelo Carlos H, Meller Amit, Oliver John S, Pershin Yuriy V, Ramsey J Michael, Riehn Robert, Soni Gautam V, Tabard-Cossa Vincent, Wanunu Meni, Wiggin Matthew, Schloss Jeffery A. The potential and challenges of nanopore sequencing. Nat Biotech. 2008;26(10):1146–1153. doi: 10.1038/nbt.1495. [DOI] [PMC free article] [PubMed] [Google Scholar]
- [5].Benoît Roux, Allen Toby, Bernèche Simon, Im Wonpil. Theoretical and computational models of biological ion channels. Quarterly Reviews of Biophysics. 2004;37(01):15–103. doi: 10.1017/s0033583504003968. [DOI] [PubMed] [Google Scholar]
- [6].Anna Demming. Nanopores—the 'Holey grail' in nanotechnology research. Nanotechnology. 2012 Jun;23(25):250201–250201. doi: 10.1088/0957-4484/23/25/250201. [DOI] [PubMed] [Google Scholar]
- [7].Aksimentiev A, Brunner R, Cruz-Chu E, Comer J, Schulten K. Modeling transport through synthetic nanopores. IEEE Nanotechnology Magazine. 2009 Mar;3(1):20–28. doi: 10.1109/MNANO.2008.931112. [DOI] [PMC free article] [PubMed] [Google Scholar]
- [8].Aleksij Aksimentiev, Schulten Klaus. Imaging α-Hemolysin with molecular dynamics: Ionic conductance, osmotic permeability, and the electrostatic potential map. Biophysical Journal. 2005 Jun;88(6):3745–3761. doi: 10.1529/biophysj.104.058727. [DOI] [PMC free article] [PubMed] [Google Scholar]
- [9].Jeffrey Comer, Dimitrov Valentin, Zhao Qian, Timp Gregory, Aksimentiev Aleksei. Microscopic mechanics of hairpin DNA translocation through synthetic nanopores. Biophysical Journal. 2009;96(2):593–608. doi: 10.1016/j.bpj.2008.09.023. [DOI] [PMC free article] [PubMed] [Google Scholar]
- [10].Eduardo R Cruz-Chu, Aksimentiev Aleksei, Schulten Klaus. Ionic current rectification through silica nanopores. The Journal of Physical Chemistry. C, Nanomaterials and Interfaces. 2009 Feb;113(5):1850. doi: 10.1021/jp804724p. PMID: 20126282. [DOI] [PMC free article] [PubMed] [Google Scholar]
- [11].Chaitanya Sathe, Zou Xueqing, Leburton Jean-Pierre, Schulten Klaus. Computational investigation of DNA detection using graphene nanopores. ACS Nano. 2011 Nov;5(11):8842–8851. doi: 10.1021/nn202989w. PMID: 21981556. [DOI] [PMC free article] [PubMed] [Google Scholar]
- [12].Myung E. Suk, Aluru NR. Water transport through ultrathin graphene. J. Phys. Chem. Lett. 2010;1(10):1590–1594. [Google Scholar]
- [13].Aleksij Aksimentiev, Heng Jiunn B., Timp Gregory, Schulten Klaus. Microscopic kinetics of DNA translocation through synthetic nanopores. Biophysical Journal. 2004 Sep;87(3):2086–2097. doi: 10.1529/biophysj.104.042960. [DOI] [PMC free article] [PubMed] [Google Scholar]
- [14].Maria E Gracheva, Xiong Anlin, Aksimentiev Aleksei, Schulten Klaus, Timp Gregory, Leburton Jean-Pierre. Simulation of the electric response of DNA translocation through a semiconductor nanopore-capacitor. Nanotechnology. 2006 Feb;17(3):622–633. [Google Scholar]
- [15].Binquan Luan, Aksimentiev Aleksei. Control and reversal of the electrophoretic force on DNA in a charged nanopore. Journal of Physics: Condensed Matter. 2010 Nov;22(45):454123. doi: 10.1088/0953-8984/22/45/454123. [DOI] [PMC free article] [PubMed] [Google Scholar]
- [16].Utkur Mirsaidov, Comer Jeffrey, Dimitrov Valentin, Aksimentiev Aleksei, Timp Gregory. Slowing the translocation of double-stranded DNA using a nanopore smaller than the double helix. Nanotechnology. 2010 Oct;21(39):395501. doi: 10.1088/0957-4484/21/39/395501. [DOI] [PMC free article] [PubMed] [Google Scholar]
- [17].Ghosal S. Electrophoresis of a polyelectrolyte through a nanopore. Phys. Rev. E. 2006;74:041901-1–041901-5. doi: 10.1103/PhysRevE.74.041901. [DOI] [PubMed] [Google Scholar]
- [18].Ghosal S. The effect of salt concentration on the electrophoretic speed of a polyelectrolyte through a nanopore. Phys. Rev. Lett. 2007;98:238104. doi: 10.1103/PhysRevLett.98.238104. [DOI] [PubMed] [Google Scholar]
- [19].Storm AJ, Chen JH, Zandbergen HW, Dekker C. Translocation of double-strand dna through a silicon oxide nanopore. Phys. Rev. E. 2005;71:051903-1–051903-10. doi: 10.1103/PhysRevE.71.051903. [DOI] [PubMed] [Google Scholar]
- [20].Smeets MMR, Keyser UF, Krapf D, Wu M, Dekker NH, Dekker C. Salt dependance of ion transport and dna translocation through solid state nanopores. Nano Letters. 2006;6(1):89–95. doi: 10.1021/nl052107w. [DOI] [PubMed] [Google Scholar]
- [21].Stijn van Dorp, Keyser Ulrich F., Dekker Nynke H., Dekker Cees, Lemay Serge G. Origin of the electrophoretic force on DNA in solid-state nanopores. Nat Phys. 2009 May;5(5):347–351. [Google Scholar]
- [22].Ghosal S. Electrokinetic-flow-induced viscous drag on a tethered dna inside a nanopore. Phys. Rev. E. 2007;76:061916. doi: 10.1103/PhysRevE.76.061916. [DOI] [PubMed] [Google Scholar]
- [23].Hsueh-Chia Chang, Yossifon Gilad, Demekhin Evgeny A. Nanoscale electrokinetics and microvortices: How microhydrodynamics affects nanofluidic ion flux. Annual Review of Fluid Mechanics. 2012 Jan;44(1):401–426. [Google Scholar]
- [24].Berendsen HJC, Grigera JR, Straatsma TP. The missing term in effective pair potentials. J. Phys. Chem. 1987;91(24):6269–6271. [Google Scholar]
- [25].Kun-Lin Yang, Yiacoumi Sotira, Tsouris Costas. Canonical monte carlo simulations of the fluctuating-charge molecular water between charged surfaces. The Journal of Chemical Physics. 2002 Jul;117(1):337–345. [Google Scholar]
- [26].Berk Hess, Kutzner Carsten, van der Spoel David, Lindahl Erik. GROMACS 4: Algorithms for highly efficient, Load-Balanced, and scalable molecular simulation. J. Chem. Theory Comput. 2008;4(3):435–447. doi: 10.1021/ct700301q. [DOI] [PubMed] [Google Scholar]
- [27].Xiaojing Gong, Li Jingyuan, Lu Hangjun, Wan Rongzheng, Li Jichen, Hu Jun, Fang Haiping. A charge-driven molecular water pump. Nat Nano. 2007;2(11):709–712. doi: 10.1038/nnano.2007.320. [DOI] [PubMed] [Google Scholar]
- [28].Hummer G, Rasaiah JC, Noworyta JP. Water conduction through the hydrophobic channel of a carbon nanotube. Nature. 2001;414(6860):188–190. doi: 10.1038/35102535. [DOI] [PubMed] [Google Scholar]
- [29].Zhou Xiao-Yan, Hang-Jun Lu. The structure and dynamics of water inside armchair carbon nanotube. Chinese Physics. 2007 Feb;16(2):335–339. [Google Scholar]
- [30].Tom Darden, York Darrin, Pedersen Lee. Particle mesh Ewald: An N.log(N) method for Ewald sums in large systems. The Journal of Chemical Physics. 1993;98(12):10089. [Google Scholar]
- [31].Thomas JA, McGaughey AJH. Density, distribution, and orientation of water molecules inside and outside carbon nanotubes. The Journal of Chemical Physics. 2008 Feb;128(8):084715–084715-6. doi: 10.1063/1.2837297. [DOI] [PubMed] [Google Scholar]
- [32].Werder T, Walther JH, Jaffe RL, Halicioglu T, Koumoutsakos P. On the Water-Carbon interaction for use in molecular dynamics simulations of graphite and carbon nanotubes. J. Phys. Chem. B. 2003;107(6):1345–1352. [Google Scholar]
- [33].Çağlar Ö Girit, Meyer Jannik C., Erni Rolf, Rossell Marta D., Kisielowski C, Yang Li, Park Cheol-Hwan, Crommie MF, Cohen Marvin L., Louie Steven G., Zettl A. Graphene at the edge: Stability and dynamics. Science. 2009 Mar;323(5922):1705–1708. doi: 10.1126/science.1166999. [DOI] [PubMed] [Google Scholar]
- [34].De-en Jiang, Cooper Valentino R., Dai Sheng. Porous graphene as the ultimate membrane for gas separation. Nano Letters. 2009;9(12):4019–4024. doi: 10.1021/nl9021946. [DOI] [PubMed] [Google Scholar]
- [35].Chunxiao Cong, Yu Ting, Sato Kentaro, Shang Jingzhi, Saito Riichiro, Dresselhaus Gene F., Dresselhaus Mildred S. Raman characterization of ABA- and ABC-Stacked trilayer graphene. ACS Nano. 2011;5(11):8760–8768. doi: 10.1021/nn203472f. [DOI] [PubMed] [Google Scholar]
- [36].Dusan Bratko, Daub Christopher D., Leung Kevin, Luzar Alenka. Effect of field direction on electrowetting in a nanopore. J. Am. Chem. Soc. 2007;129(9):2504–2510. doi: 10.1021/ja0659370. [DOI] [PubMed] [Google Scholar]
- [37].Christopher D. Daub, Bratko Dusan, Leung Kevin, Luzar Alenka. Electrowetting at the nanoscale. J. Phys. Chem. C. 2006;111(2):505–509. [Google Scholar]
- [38].Christopher D. Daub, Bratko Dusan, Luzar Alenka. Nanoscale wetting under electric field from molecular simulations. Topics in Current Chemistry. 2012;307:155–179. doi: 10.1007/128_2011_188. [DOI] [PubMed] [Google Scholar]
- [39].Guo-Hui Hu, Xu Ai-Jin, Xu Zhen, Zhou Zhe-Wei. Dewetting of nanometer thin films under an electric field. Physics of Fluids. 2008;20:102101. [Google Scholar]
- [40].Walther JH, Jaffe R, Halicioglu T, Koumoutsakos P. Carbon nanotubes in water: Structural characteristics and energetics. J. Phys. Chem. B. 2001;105(41):9980–9987. [Google Scholar]
- [41].Garaj S, Hubbard W, Reina A, Kong J, Branton D, Golovchenko JA. Graphene as a subnanometre trans-electrode membrane. Nature. 2010;467(7312):190–193. doi: 10.1038/nature09379. [DOI] [PMC free article] [PubMed] [Google Scholar]
- [42].Gregory F. Schneider, Kowalczyk Stefan W., Calado Victor E., Pandraud Gregory, Zandbergen Henny W., Vandersypen Lieven M. K., Dekker Cees. DNA translocation through graphene nanopores. Nano Lett. 2010;10(8):3163–3167. doi: 10.1021/nl102069z. [DOI] [PubMed] [Google Scholar]
- [43].Zuzanna S. Siwy, Davenport Matthew. Nanopores: Graphene opens up to DNA. Nat Nano. 2010;5(10):697–698. doi: 10.1038/nnano.2010.198. [DOI] [PubMed] [Google Scholar]


