

Abstract
Mammalian aortic bodies (ABs) are putative peripheral arterial chemoreceptors whose function remains controversial, partly because information on their cellular physiology is lacking. In this study, we used ratiometric Ca2+ imaging to investigate for the first time chemosensitivity in short-term cultures of dissociated cells of juvenile rat ABs, located near the junction of the left vagus and recurrent laryngeal nerves. Among the surviving cell population were glomus or type I cell clusters, endogenous local neurons and glia-like cells. A variety of chemostimuli, including hypoxia, isohydric or acidic hypercapnia, and isocapnic acidosis, caused a rise in intracellular [Ca2+] in AB type I cells. The Δ[Ca2+]i responses were indistinguishable from those in carotid body (CB) type I cells grown in parallel cultures from the same animals, and responses to acidic hypercapnia were prevented by the non-specific voltage-gated Ca2+ channel antagonist, 2 mm Ni2+. Furthermore, we identified a subpopulation (∼40%) of glia-like cells in AB cultures that resembled CB type II cells based on their approximately equal sensitivity to ATP and UTP, consistent with the expression of purinergic P2Y2 receptors. Finally, we showed that some local neurons, known to be uniquely associated with these AB paraganglia in situ, generated robust Δ[Ca2+]i responses to these chemostimuli. Thus, these AB type I cells and associated putative type II cells resemble those from the well-studied CB. Unlike the CB, however, they also associate with a special group of endogenous neurons which we propose may subserve a sensory function in local cardiovascular reflexes.
Key points
Mammalian aortic bodies (ABs) are putative peripheral chemoreceptor cells presumed to monitor the oxygen content of arterial blood, although their direct chemosensitivity has never been previously demonstrated at the cellular level.
We used Ca2+ imaging to show for the first time that a variety of stimuli, including hypoxia, isohydric and acidic hypercapnia, and isocapnic acidosis, caused increases in cytosolic [Ca2+] in AB chemoreceptor cells.
We also showed that some local neurons, known to be uniquely associated with these AB paraganglia in situ, generated robust [Ca2+]i responses to these chemostimuli, suggesting that they may subserve a sensory function.
These results will help us better understand how AB cells sense the composition of the blood in their local environment near the heart, and how they communicate with sensory neurons to initiate homeostatic reflexes during situations of low oxygen supply, like anaemia.
Introduction
Peripheral arterial chemoreceptors sense the chemical composition of arterial blood, i.e.  and
and  , and initiate compensatory reflex responses so as to maintain homeostasis. In mammals, the primary peripheral arterial chemoreceptors are the carotid bodies (CBs), which are located at the bifurcation of the common carotid arteries and mediate their effects via the control of ventilation. Thus, a fall in arterial
  (i.e. hypoxia) is sensed by the CBs, leading to hyperventilation and a restoration of blood
  (Gonzalez et al. 1994). A second group of putative peripheral arterial chemoreceptors, i.e. the aortic bodies (ABs), is distributed diffusely as small paraganglia along the vagus nerve and its branches near the aortic arch (McDonald & Blewett, 1981). These AB chemoreceptors have been the subject of controversy for decades, due to uncertainties about their exact location, adequate stimuli and indeed, whether or not they are present in all mammalian species (Sapru et al. 1981; Brophy et al. 1999). Nevertheless, there is compelling ultrastructural and immunocytochemical evidence that the vagal AB paraganglia show striking similarities to CB chemoreceptors. For example, the fine structure of parenchymal chemoreceptor glomus or type I cells and their innervation are indistinguishable from those of the CB (McDonald & Blewett, 1981), and in both cases the type I cells express multiple neurotransmitters, including catecholamines, acetylcholine (ACh), serotonin (5–HT) and ATP (Dvorakova & Kummer, 2005; Piskuric et al. 2011).
Despite a consensus about their morphological and biochemical properties, the physiological function of ABs remains controversial. In a classical study, Comroe (1939) showed that the respiratory and cardiovascular responses induced by hypoxia and cyanide in cats and dogs were partly due to a second, extra-carotid chemoreceptor located near the aortic arch. Decades later, Lahiri and co-workers carried out an extensive series of physiological studies on ABs in anaesthetized, neuromuscularly blocked and artificially ventilated cats (Lahiri et al. 1979, 1981a; Pokorski & Lahiri, 1983). During extracellular recordings from single or few fibres of the aortic nerve, they found that AB chemoafferents were activated by hypoxia, hypercapnia, metabolic and respiratory acidosis, though their responses (especially to hypercapnia) were significantly lower than those of CB chemoafferents. In the rat, hypoxia and/or cyanide were found to stimulate chemoafferent activity in the aortic and superior laryngeal nerves (Brophy et al. 1999; Jones, 2000; O’Leary et al. 2004); however, the physiological significance of these findings in terms of respiratory or cardiovascular reflexes has been questioned (Kobayashi et al. 1999). One comparative view regarding AB function is that whereas the CB senses oxygen partial pressure  and is primarily involved in ventilatory control so as to ensure adequate O2 supply to the gas exchange surfaces, the AB senses changes in blood O2 content and its main function is in cardiovascular regulation, ensuring adequate O2 transport capacity and blood volume (Hatcher et al. 1978; Lahiri et al. 1980, 1981b; Milsom & Burleson, 2007). While this posit is attractive in that it assigns separate and distinct functions to the CB and AB, it fails to provide a satisfactory explanation for how the sensing mechanisms may differ, if at all. In the case of the AB, a major contributing factor is that, to our knowledge, there have been no studies to date that directly address the cellular physiology and putative chemoreceptive properties of mammalian AB type I cells, in marked contrast to the numerous comparable studies on CB type I cells (reviewed in Gonzalez et al. 1994; Nurse, 2010).
In the present study, we address this void for the first time by focusing on a particular group of rat AB chemoreceptors located at the junction of the left vagus and recurrent laryngeal nerves. The ABs can be routinely identified within this region where they occur in association with a group of local neurons (Dvorakova & Kummer, 2005; Piskuric et al. 2011). Importantly, we previously found that some of these local neurons express purinergic P2X2 and P2X3 receptor subunits, and that dissociation of the tissue yields an in vitro preparation where isolated type I clusters, local neurons and glia-like cells survive for a few days (Piskuric et al. 2011). As a first step towards understanding the cellular mechanisms of AB chemoreception, we used this in vitro preparation to investigate the effects of various chemostimulants on isolated AB cells. Since the small size of these ABs resulted in a paucity of type I cell clusters compared with the well-studied CBs, we used ratiometric fura–2 intracellular Ca2+ imaging in order to optimize sampling frequency. As a positive control, as well as to facilitate a direct comparison of chemosensitivity between AB and CB cells at a similar developmental stage, we monitored Ca2+ responses in parallel dissociated CB preparations taken from the same animals. We found that AB type I cells were sensitive to hypoxia, isohydric and acidic hypercapnia, and isocapnic acidosis, similar to CB type I cells. Moreover, some local AB neurons were also sensitive to these stimuli, suggesting that they may subserve a sensory function.
Methods
Ethical approval
All procedures for animal handling and tissue dissections were carried out according to the guidelines of the Canadian Council on Animal Care (CCAC) and institutional guidelines. The authors have read, and the experiments comply with, the policies and regulations of The Journal of Physiology given by Drummond (2009).
Cell cultures
Juvenile rat pups, 9–14 days old (Wistar, Charles River, Quebec, Canada), were rendered unconscious by a blow to the back of the head and then killed immediately by decapitation. The vagus nerve was cut peripheral to the nodose ganglion and caudal to the bifurcation of the left recurrent laryngeal nerve (RLN); this portion along with the attached RLN was excised. Carotid bodies (CBs) from the same animals were also removed bilaterally and kept separate. The data presented in this study are derived from 20 rat litters, with each litter comprising ∼12 pups. All aortic body (AB) tissue harvested was used for the experiments described here; CB tissue was shared between this and other studies being performed concurrently in our laboratory. Tissues were incubated for 1 h at 37°C in an enzymatic solution containing 0.1% trypsin (Gibco, Grand Island, NY, USA) and 0.1% collagenase (Gibco or Sigma Aldrich, Oakville, Ontario, Canada), prior to mechanical dissociation and trituration. The resulting cell suspension, containing either AB or CB cells, was plated onto a thin layer of Matrigel (Collaborative Research, Bedford, MA, USA) that was previously applied to the central wells of modified 35 mm tissue culture dishes (Zhong et al. 1997). Cultures were grown in F-12 nutrient medium supplemented with 5% fetal bovine serum, 1% penicillin–streptomycin, 1% glutamine, 0.3% glucose and 3 μg ml−1 insulin, at 37°C in a humidified atmosphere of 95% air–5% CO2 (Zhong et al. 1997). In a few cases, cells were cultured in the presence of a prophylactic dose of plasmocin (5 μg ml−1); data derived from such cells were similar to those obtained from cells cultured without plasmocin. AB and CB cells were used in Ca2+ imaging experiments after ∼24 h in culture.
Intracellular Ca2+ measurements
Intracellular free Ca2+ concentration ([Ca2+]i) was monitored using the fluorescent Ca2+ indicator, fura–2 AM (Molecular Probes, Eugene, OR, USA). Cells were loaded with 2.5 μm fura–2 AM diluted in standard bicarbonate-buffered solution (BBS) for 30 min at 37°C, and subsequently washed for ∼15 min to remove free dye. Ratiometric Ca2+ imaging was performed using a Nikon Eclipse TE2000-U inverted microscope (Nikon, Mississauga, ON, Canada) equipped with a Lambda DG-4 ultra-high-speed wavelength changer (Sutter Instrument Co., Novato, CA, USA), a Hamamatsu OCRCA-ET digital CCD camera (Hamamatsu, Sewickley, PA, USA) and a Nikon S-Fluor 40× oil-immersion objective lens with a numerical aperture of 1.3. Dual images at 340 nm and 380 nm excitation (510 nm emission) were acquired every 2 s, with an exposure time of 100–200 ms. Pseudocolour ratiometric data were obtained using Simple PCI software version 5.3. All experiments were performed at 21–23°C, and cells were continuously perfused with BBS to maintain an extracellular pH of ∼7.4.
The imaging system was calibrated using the Fura-2 Calcium Imaging Calibration Kit from Molecular Probes (Cat. no. F-6774). Photometric data at 340 nm and 380 nm excitation (510 nm emission) were obtained for 11 buffers of known Ca2+ concentration (from zero free Ca2+ to saturating Ca2+, i.e. 39 μm). After correcting for background fluorescence, these values were used to calculate the following ratios (where ‘R’ is the 510 nm emission intensity with excitation at 340 nm, to 510 nm emission intensity with excitation at 380 nm); Rmin, the ratio at zero free Ca2+; Rmax, the ratio at saturating Ca2+; and β, the fluorescence intensity with excitation at 380 nm for zero free Ca2+ (F380max), to the fluorescence intensity at saturating free Ca2+ (F380min). Substituting these ratios into the Grynkiewicz equation,
where Rmin= 0.18, Rmax= 7.81, β= 12.29, Kd= 225 nm and R is the ratio obtained during an experiment, gave the intracellular free [Ca2+] for a given cell (Grynkiewicz et al. 1985).
Solutions and drugs
Cells were perfused with standard BBS containing (in mm): 24 NaHCO3, 115 NaCl, 5 glucose, 5 KCl, 2 CaCl2 and 1 MgCl2, and the pH was maintained at ∼7.4 by bubbling with 5% CO2–95% air mixture. Hypoxic solution was made by aerating BBS with 5% CO2–95% N2.  was measured using a Micro Dissolved Oxygen Electrode (Model DO-166 MT-1; Lazar Research Laboratories, Inc., Los Angeles, CA, USA). The electrode was calibrated in room air and used to measure the
  (∼25 mmHg) in the bathing solution. Isohydric hypercapnia was generated by doubling the concentration of NaHCO3 to 48 mm (maintaining osmolarity by reducing NaCl to 91 mm) and aerating with 10% CO2–90% air (pH ∼7.4). Isocapnic acidosis contained 8.6 mm NaHCO3 (130.4 mm NaCl) and was aerated with 5% CO2–95% air mixture (pH ∼6.9). Finally, acidic hypercapnia was generated by bubbling standard BBS with 10% CO2–90% air (pH ∼7.1). High extracellular K+ solution (30 mm KCl) was made by equimolar substitution of NaCl for KCl. Nickel(II) chloride hexahydrate was purchased from Sigma Aldrich (Cat. no. N6136).
Statistical analysis
Cells with a basal [Ca2+]i greater than 200 nm, or cells whose baseline exhibited continuous ramping throughout the experiment, were excluded from analyses. Furthermore, only those cells that responded to 30 mm KCl with a rise in [Ca2+]i greater than 100 nm (peak minus baseline) were included in statistical analyses (excluding glia-like cells). Data are reported as mean ± standard error of the mean (SEM), where the mean is the average [Ca2+]i during application of the stimulus (usually 2 min) minus the averaged baseline immediately preceding the stimulus (30 s). Cells were classified as ‘responsive’ if their mean Δ[Ca2+]i was >20 nm. Differences between data sets were analysed using the repeated measures Friedman test with Dunn's multiple comparison post hoc tests (for non-parametric data). The significance level was set at 0.05. Statistical analyses were performed in GraphPad Prism 5.
Immunocytochemistry and confocal imaging
Whole-mounts
Procedures for processing whole-mounts of the left vagus–recurrent laryngeal nerve bifurcation for tyrosine hydroxylase (TH) immunostaining were similar to those described in detail elsewhere (Piskuric et al. 2011).
Cell cultures
AB and CB cultures were stained after 24 h in vitro. Cells were washed with warmed PBS and fixed in 5% acetic acid–95% methanol for 1 h at −20°C. After washing with PBS (3×10 min), cells were incubated in primary antibody diluted in 1% BSA–PBS for 24 h at 4°C. Primary antibodies were rabbit anti-tyrosine hydroxylase (TH) polyclonal antibody at 1:2000 (Millipore, Cat. no. AB152, Temecula, CA, USA) and mouse anti-glial fibrillary acidic protein (GFAP) monoclonal antibody at 1:500 (Millipore, Cat. no. MAB360). After washing off primary antibody 3× with PBS (10 min each), secondary antibodies (diluted in BSA–PBS) were applied, including DYLIGHT goat anti-mouse (1:500) and FITC goat anti-rabbit (1:50) (both from Jackson ImmunoResearch Laboratories, Inc., West Grove, PA, USA). After 1 h at room temperature, specimens were washed 3× (5 min each), and Vectashield (Vector Laboratories, Burlington, Ontario, Canada) was applied to prevent photobleaching. No control peptides were available for control staining; however, it is noteworthy that each antibody specifically labelled only one cell type within these heterogeneous cultures. Stained specimens were first examined using a standard epifluorescence microscope (Zeiss IM35) in order to identify regions of interest for further confocal examination. For the best specimens, coverslips were removed from the undersides of the dishes and placed upside-down onto a dab of Vectasheild on a microscope slide, and the edges were sealed with nail polish. Images presented here were obtained using the Leica TCS SP5 II confocal system, equipped with argon (458, 476, 488, 515 nm) and helium–neon (543, 594, 633 nm) lasers, and a 63× oil objective with a 1.4 numerical aperture (Leica). Specimens were scanned in optical sections separated by 1.0–2.5 μm. Data acquisition and adjustment of brightness and contrast were controlled with the aid of LAS AF (version 2.1.2, Leica). Images were cropped and/or rotated in Adobe Photoshop CS3 Extended (version 10.0.1) and figures were compiled in Adobe Illustrator CS3 (13.0.1).
Results
In this study, all data on aortic body (AB) cultures were derived from ABs located at the junction of the left vagus and recurrent laryngeal nerves from 9- to 14–day-old rats. The location and distribution of type I cells, identified by positive tyrosine hydroxylase (TH) immunostaining in tissue whole-mounts of this region, are illustrated in the confocal immunofluorescence images of Fig. 1A and B. Details on the relationship between type I cells and endogenous local neurons in this region have been described in detail in our recent study (Piskuric et al. 2011).
Figure 1. Identification of rat aortic body and carotid body cell types in situ and/or in dissociated cell culture.
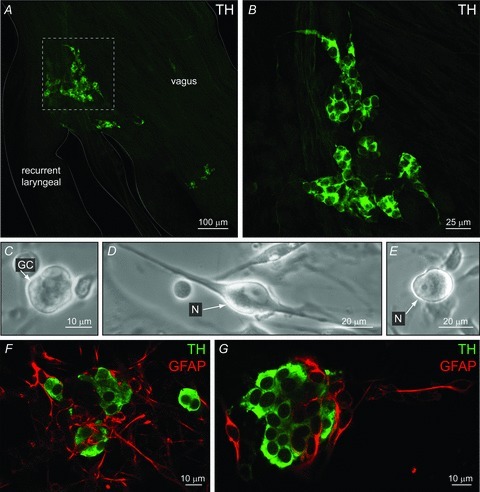
A, confocal section of a whole-mount containing the vagus and recurrent laryngeal nerve bifurcation reveals aortic body type I cell clusters, immunostained for tyrosine hydroxylase (TH); inset in A shown at higher magnification in B. C–E, phase contrast micrographs of dissociated AB cells after 24 h in culture. An isolated AB type I or glomus cell (GC) cluster is shown in C; the soma of local neurons (N) with and without visible processes are shown in D and E, respectively. Parallel cultures of dissociated AB cells (F) and CB cells (G) from the same animals, showing type I clusters immunopositive for TH (green), and glia-like cells, immunopositive for glial-fibrillary acidic protein (GFAP, red). Note GFAP-positive cells are more abundant in AB cultures (F), relative to CB cultures in which GFAP is known to stain predominantly glia-like, type II cells (G).
Appearance and composition of aortic body cultures
The appearance of AB cultures under phase contrast microscopy was similar to that reported in our previous study (Piskuric et al. 2011). The small size of the AB (with ∼100 glomus or type I cells) at the bifurcation of the vagus and recurrent laryngeal nerves meant that there was generally a poor yield of isolated type I cell clusters even after pooling dissociated cells from nerve bundles from ∼12 rat pups (e.g. Fig. 1C). Given the bilateral asymmetry of the vagus and recurrent laryngeal nerves, only nerves from the left side were used because of their proximity to the aortic arch, contributing also to a low cell yield. In fact, some cultures appeared to be devoid of recognizable type I cell clusters. A characteristic feature of these AB cultures was the presence of occasional, easily identified cell bodies of local neurons (Fig. 1D and E). This contrasts with the bilateral rat carotid bodies (CBs), which can be individually isolated relatively free from attached nerves and contains ∼9000 type I cells per CB (McDonald & Mitchell, 1975). These CB cultures usually give rise to many dispersed islands of type I clusters, but lack viable neurons under our growth conditions (Nurse, 1990; Nurse & Fearon, 2002).
A comparison of fluorescence micrographs from typical dissociated 24 h AB and CB cultures after immunostaining for the type I cell marker, TH, and the glial-cell marker, glial fibrillary acidic protein (GFAP), is shown in Fig. 1F and G, respectively (n = 3). Whereas GFAP-positive cells in rat CB cultures correspond predominantly to glia-like, sustentacular or type II cells (Nurse & Fearon, 2002), the situation is more complex for AB cultures. In particular, because the ABs reside within nerve bundles, AB cultures contain a much higher proportion of GFAP-positive cells (cf. Fig. 1G and F; see also Piskuric et al. 2011), the majority of which probably originate from glial (e.g. Schwann) cells associated with the large peripheral vagus and recurrent laryngeal nerves. Because of these morphological considerations, we initially focused on small, putative chemoreceptor type I clusters (<5 cells) for monitoring stimulus-evoked intracellular Ca2+ responses, so as to minimize contamination from interspersed glial cells.
Ca  responses in aortic body vs. carotid body type I cells during chemostimulation
In the majority of experiments, intracellular Ca2+ responses were recorded from parallel AB and CB cultures derived from the same litters ∼24 h after plating. Putative single, and small clusters (2–4 cells) of type I cells were identified morphologically under brightfield optics prior to data acquisition, and evidence in support of their identity was obtained at the end of each trace by a positive response to the depolarizing stimulus, high extracellular K+ (30 mm KCl). It should be noted, however, that at 24 h it is difficult to distinguish type I from type II cells morphologically, especially when both are present in the same cluster. Pooled data from all cultures revealed that the mean resting intracellular Ca2+ concentration, [Ca2+]i, recorded from putative type I cells in AB cultures was 39.7 ± 1.2 nm (range, 10.1–138.1 nm; n = 265); this value appeared similar for type I cells in parallel CB cultures (mean, 39.3 ± 1.3 nm; n = 341). Often, AB type I cells showed random baseline [Ca2+]i fluctuations that included spikes of variable amplitudes. As exemplified in Fig. 2, type I cells from parallel AB and CB cultures showed increases in [Ca2+]i in response to several chemostimuli including hypoxia ( ∼25 mmHg), isohydric hypercapnia (10% CO2; pH ∼7.4), acidic hypercapnia (10% CO2; pH ∼7.1) and isocapnic acidosis (5% CO2; pH ∼6.9). A subset (7/24, 29%) of AB type I cells in smaller clusters (<5 cells) responded to hypoxia with a significant increase in intracellular [Ca2+]i, corresponding to a Δ[Ca2+]i of ∼60 nm above basal (Fig. 3). A comparable response to the same hypoxic stimulus was seen in small clusters (<5 cells) of CB type I cells from parallel cultures, where a larger proportion of cells (10/22, 45%) responded with a mean Δ[Ca2+]i of ∼86 nm above basal (Fig. 3).
Figure 2. Intracellular calcium ( ) responses of aortic body (AB) and carotid body (CB) type I cells to chemostimuli.
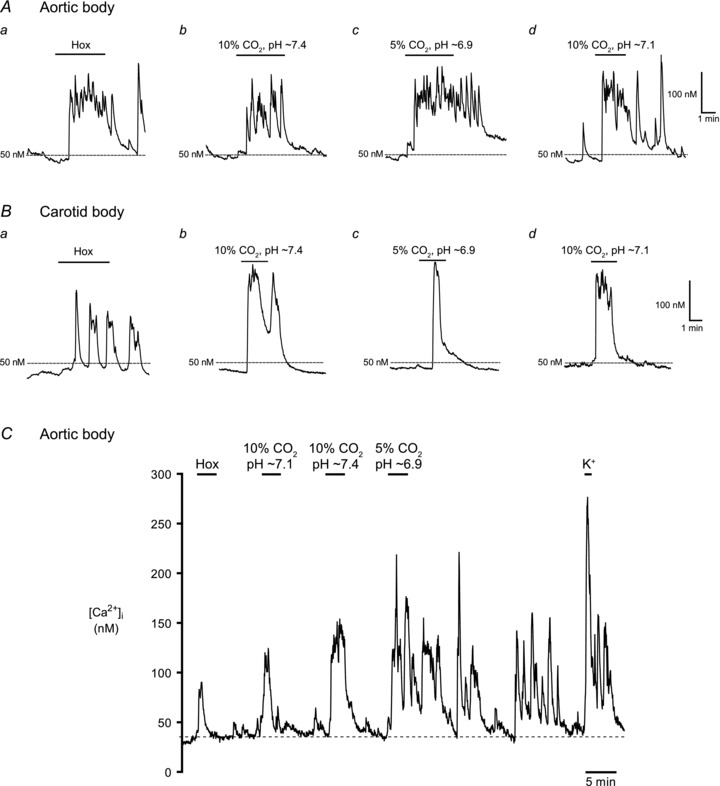
Example Ca2+ traces from responsive AB type I cells (A) and CB type I cells (B), to hypoxia (Hox;  ∼25 mmHg), isohydric hypercapnia (10% CO2, pH 7.4), isocapnic acidosis (5% CO2, pH ∼6.9; H+) and acidic hypercapnia (10% CO2, pH ∼7.1). In C, a complete
  trace from an AB type I cell within a triplet shows responses to all 4 chemostimuli and the depolarizing stimulus, high (30 mm) K+. Isocapnic acidosis (H+) elicited the largest responses regardless of stimulus order, but was usually applied last because there was continuous Ca2+ activity even after washout.
Figure 3. Summary of intracellular Ca2+ responses in aortic body (AB) and carotid body (CB) type I cells to various chemostimuli.
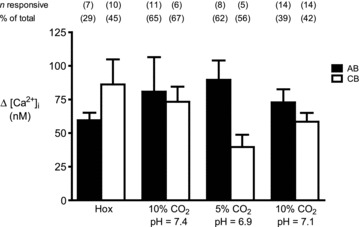
Bars represent the mean (+SEM) increase in [Ca2+]i induced by the given stimulus in responsive AB (filled bars) and CB (open bars) type I cells from small (i.e. <5 cell) clusters, averaged over a 2–4 min interval. The number of responsive cells (‘n’) for each group is given in parenthesis above each bar as well as the % of total (n responsive/total number of cells sampled).
Compared with hypoxia, isohydric hypercapnia and isocapnic acidosis elicited more robust Δ[Ca2+]i responses in AB type I cells and a greater proportion of cells responded. As illustrated in Fig. 3, 65% (11/17) of AB type I cells responded to isohydric hypercapnia with a mean Δ[Ca2+]i of ∼81 nm, whereas 62% (8/13) responded to isocapnic acidosis with a mean Δ[Ca2+]i of ∼90 nm. Surprisingly, when AB type I cells from small clusters were challenged with acidic hypercapnia (10% CO2; pH ∼7.1), the proportion of responsive cells (14/37, 39%) and mean Δ[Ca2+]i (∼73 nm) appeared lower than that seen with isohydric hypercapnia. Though not studied in detail, a common occurrence in AB type I cells after exposure to isocapnic acidosis was a prolonged oscillating Ca2+ response that continued for several minutes after termination of the stimulus (Fig. 2A and C). This observation suggests that these cells may be quite acid sensitive. Data from comparable studies in parallel CB cultures are summarized in Fig. 3; 67% (6/9) of CB type I cells responded to isohydric hypercapnia, 56% (i.e. 5/9) responded to isocapnic acidosis, and 42% (14/33) responded to acidic hypercapnia. In general, for hypercapnic stimuli the magnitude of Δ[Ca2+]i responses and proportion of those responsive were similar in both sets of cultures when comparing single, and small (<5 cells) clusters of, type I cells. Combined data for all chemostimuli based on measurements of Ca2+ responses in type I clusters of all sizes are summarized in Table 1. It should be noted that contaminating glial cells are more likely to be present within the larger cell clusters.
Table 1.
Summary of Δ[Ca2+]i from responsive aortic body and carotid body type I cells
| Hox | 10% CO2, pH ∼7.4 | 5% CO2, pH ∼6.9 | 10% CO2, pH ∼7.1 | 30 mm KCl | |
|---|---|---|---|---|---|
| AB | |||||
| Mean ± SEM (nm) | 69.3 ± 8.2 | 62.8 ± 9.1 | 89.7 ± 19.4 | 56.0 ± 5.4 | 118.6 ± 5 |
| % responsive | 8 | 63 | 41 | 13 | 100 |
| n (total) | 160 | 52 | 37 | 250 | 265 |
| CB | |||||
| Mean ± SEM (nm) | 45.7 ± 3.9 | 76.7 ± 5.6 | 53.4 ± 4.8 | 46.5 ± 2.2 | 207.5 ± 6 |
| % responsive | 26 | 84 | 51 | 48 | 100 |
| n (total) | 262 | 97 | 76 | 310 | 341 |
Effect of Ni2+ on the chemosensory responses of AB vs. CB type I cells
It is well established that rat CB type I cells respond to hypoxia and acidic hypercapnia via extracellular Ca2+ entry through predominantly L-type voltage-gated Ca2+ channels (Buckler & Vaughan-Jones, 1994a,b). To investigate the source of  in the responses of AB type I cells to chemostimuli, we tested the effects of the non-specific voltage-gated Ca2+ channel antagonist, 2 mm Ni2+. First, we confirmed that under our recording conditions 2 mm Ni2+ was effective in inhibiting CO2/H+-induced
  responses in CB type I cells (Fig. 4A). Of 59 CB type I cells tested, acidic hypercapnia elicited a significant rise in [Ca2+]i in 45 cells (i.e. 76%); the mean Δ[Ca2+]i in responsive cells was 85.9 ± 8.0 nm. As illustrated in Fig. 4A, B and D, this
  response was completely abolished in the presence of 2 mm Ni2+ (Friedman test with Dunn's multiple comparison post hoc test, P < 0.0001, n = 45). In fact, the Δ[Ca2+]i during Ni2+ application was −4.07 ± 1.07 nm, which is consistent with a reduction in baseline spontaneous
  activity after application of Ni2+ (e.g. Fig. 4B). The response to acidic hypercapnia was completely recoverable after washout of Ni2+ (Fig. 4A, B and D); the Δ[Ca2+]i after recovery was 78.92 ± 8.97 nm (Friedman test with Dunn's multiple comparison post hoc test, P = ns, n = 45). It was routinely noted, however, that there was a ‘rebound’ in [Ca2+]i immediately after washout of Ni2+, characterized by a large, fast spike in [Ca2+]i followed by prolonged spontaneous activity (e.g. Fig. 4B), consistent with previous reports (Buckler & Vaughan-Jones, 1994a).
Figure 4. Blockade of intracellular Ca2+ responses to acidic hypercapnia by 2 m.

mNi2+A, acidic hypercapnia (10% CO2, pH 7.1) elicited a rise in [Ca2+]i in a carotid body (CB) type I cell that was reversibly blocked by the non-specific voltage-gated Ca2+ channel antagonist, 2 mm Ni2+. The same protocol was applied in B, although in this case the CB type I cells exhibited spontaneous  activity before and especially after washout of the stimulus; 2 mm Ni2+ reversibly blocked the spontaneous activity as well as the response to acidic hypercapnia. In C, an aortic body (AB) type I cell with spontaneous
  activity responded to acidic hypercapnia, and this response was blocked by 2 mm Ni2+; note that application of Ni2+ immediately caused a reduction in the baseline [Ca2+]i, as indicated by the hatched lines. Although the effect of acidic hypercapnia was poorly reversible, there was still a detectable response to high K+. Cumulative data for all 10% CO2/H+-responsive CB and AB type I cells exposed to this protocol are illustrated in D and E.
A similar pattern of Ni2+ sensitivity was observed in AB type I cells following exposure to acidic hypercapnia (Fig. 4C), though the data set was smaller. In a group of six cells that responded initially to acidic hypercapnia with a significant rise in  (mean Δ[Ca2+]i= 68.0 ± 18.2 nm), application of 2 mm Ni2+ caused a rapid decrease in the spontaneous [Ca2+]i activity, and the baseline [Ca2+]i began to decline (e.g. Fig. 4C, hatched lines; Fig. 4E). In the continued presence of 2 mm Ni2+, the Δ[Ca2+]i response was blocked on re-application of acidic hypercapnia, consistent with a role of Ca2+ entry through voltage-gated Ca2+ channels (Fig. 4C and E; Friedman test with Dunn's multiple comparison post hoc test, P = 0.02, n = 6). Upon washout of Ni2+, AB type I cells exhibited ‘rebound’[Ca2+]i transients, similar to that observed for CB cells; however, the response to a subsequent exposure to acidic hypercapnia was greatly diminished relative to the initial response (mean Δ[Ca2+]i= 6.9 ± 14.9 nm; Fig. 4C and E).
Effects of P2 purinoceptor agonists on glia-like cells in AB vs. CB cultures
Previous anatomical studies indicated that type I cells are more abundant than the surrounding glia-like, type II cells by a factor of 3× in the subclavian AB (Hansen, 1981) and 8× in the recurrent laryngeal AB (Dahlqvist et al. 1984). This ratio compares favourably with similar anatomical studies on the CB indicating that type I cells outnumber type II cells by a factor of 3–5× (McDonald & Mitchell, 1975). Using GFAP-immunostaining as a general marker for glial cells, our routine observations do not support such relative proportions of type I to type II cells in AB cultures, which contain a much higher proportion of GFAP-positive cells (e.g. Fig. 1F). This raised the possibility that the majority of GFAP-positive cells in AB cultures were not bona fide type II cells, but probably included other glial cells (e.g. Schwann cells) associated with the vagus and recurrent laryngeal nerves. This prompted us to investigate the properties of glia-like cells in AB cultures, especially because type II cells are now thought to participate in paracrine interactions in the CB via purinergic P2Y2 receptors (Xu et al. 2003)
Since P2Y2 receptors display roughly equal sensitivities to ATP and UTP (von Kugelgen, 2006), we first confirmed that ATP and UTP were equally effective in eliciting [Ca2+]i responses in CB type II cells, as previously reported (Xu et al. 2003). In CB cultures, type II cells occurred within, at the periphery of, or outside type I cell clusters (see Fig. 1; Nurse & Fearon, 2002), and were classified as such based on [Ca2+]i responses to ATP (100 μm) and failure to respond to the depolarizing stimulus, high K+ (30 mm).
As illustrated in Fig. 5Aa and b, ATP and UTP elicited similar increases in [Ca2+]i in CB type II cells as expected, though there was some variability in the magnitude of the responses from cell to cell (Fig. 5Aa). UTP (100 μm) elicited responses in 76% of glial cells, all of which were ATP sensitive. The average ATP- and UTP-induced Δ[Ca2+]i in CB glia-like cells were 131.2 ± 17.9 nm and 92.7 ± 21.6 nm, respectively; the average change in [Ca2+]i following exposure to 30 mm KCl was negligible (−4.4 ± 5.9 nm, n = 33).
Figure 5. Comparison of glia-like cells in aortic body (AB) cultures to carotid body (CB) type II cells.
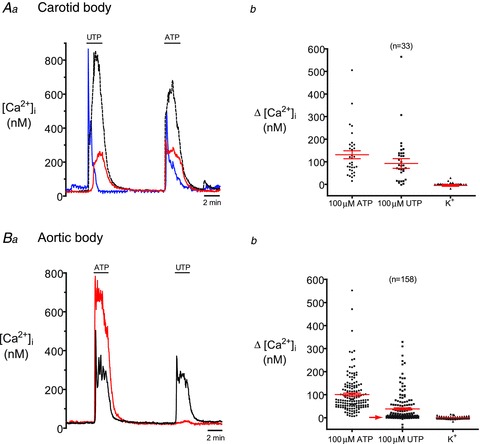
Note that cells were classified as ‘glia-like’ based on positive  responses to ATP (100 μm) but no responses to the depolarizing stimulus, high (30 mm) K+. Example Ca2+ traces from 3 glia-like cells in a CB culture are shown in Aa. As expected, all 3 cells respond with almost equal sensitivity to ATP (100 μm) and the P2Y2 receptor agonist, UTP (100 μm), a characteristic profile for the P2Y2 receptors expressed by rat CB type II cells (Xu et al. 2003). The summarized data are shown in Ab. B, by contrast, only about half of the ATP-sensitive, K+-insensitive cells in AB cultures responded to UTP. For example, in Ba the red cell responded robustly to ATP but failed to respond to 100 μm UTP. Data are summarized in Bb, where the UTP-insensitive cells are represented by the population indicated by the red arrow.
By contrast, when the same protocol was applied to AB cultures only 37% (59/158) of ATP-sensitive, high-K+-insensitive cells, responded to UTP (Fig. 5Bb). In about one-half of the cases studied, applying UTP first slightly increased the proportion of responsive cells, suggesting that previous exposure to ATP may desensitize P2Y receptors and/or deplete intracellular Ca2+ stores. Figure 5Ba shows simultaneous Ca2+ recordings from two glia-like cells in the same AB culture; both cells responded to ATP, though only one was UTP sensitive (i.e. black trace). The UTP-insensitive population of glia-like cells is represented in Fig. 5Bb by the group of data points indicated by the arrow. Of the UTP-sensitive population, the average Δ[Ca2+]i in response to 100 μm UTP was 94.6 ± 9.7 nm (n = 59), a value very similar to that of CB type II cells; the average Δ[Ca2+]i in response to 100 μm ATP was 100.7 ± 6.3 nm (n = 158) for the combined UTP-sensitive and UTP-insensitive populations. Again, the average response of the total population to 30 mm KCl was negligible, i.e. −0.5 ± 0.3 nm (n = 158).
Are local aortic body neurons sensory?
A unique feature of the vagus-recurrent laryngeal nerve ABs in situ and in dissociated cell culture is the presence of local neurons, some of which appear to make contact with type I cells (Piskuric et al. 2011). We showed previously that subpopulations of these neurons located at the periphery of AB paraganglia in this region express P2X2 and P2X3 purinoceptors, as do nerve terminals associated with type I cells in situ. As the physiological function of these neurons is unknown, we considered the possibility that they may be sensitive to AB chemostimuli, and perhaps act as sensory relay neurons. Interestingly, we found subpopulations of local neurons that responded to hypoxia, isohydric and acidic hypercapnia, and isocapnic acidosis with a significant rise in [Ca2+]i, as exemplified in Fig. 6A, B, C and E; these neurons also responded to the depolarizing stimulus high (30 mm) K+ with an increase in [Ca2+]i. We randomly selected a total of 39 AB neurons from 33 different cultures and tested the effects of one or more stimulus(i). The proportion of responsive neurons was variable with 50% (10/20) responding to hypoxia, 67% (4/6) responding to isohydric hypercapnia, 67% (4/6) responding to isohydric acidosis, and 35% (13/37) responding to acidic hypercapnia. Pooled data of the Δ[Ca2+]i in responsive neurons evoked by these various chemostimuli are summarized in the histogram of Fig. 6D. In many cases, the [Ca2+]i responses in these neurons were prolonged and often persisted for several minutes after the stimulus was terminated. Though the underlying reasons for this effect are presently unclear, the combined data are consistent with the notion that at least some local neurons may have a sensory function.
Figure 6. Intracellular Ca2+ responses elicited by chemosensory stimuli in local neurons endogenous to the aortic body (AB).
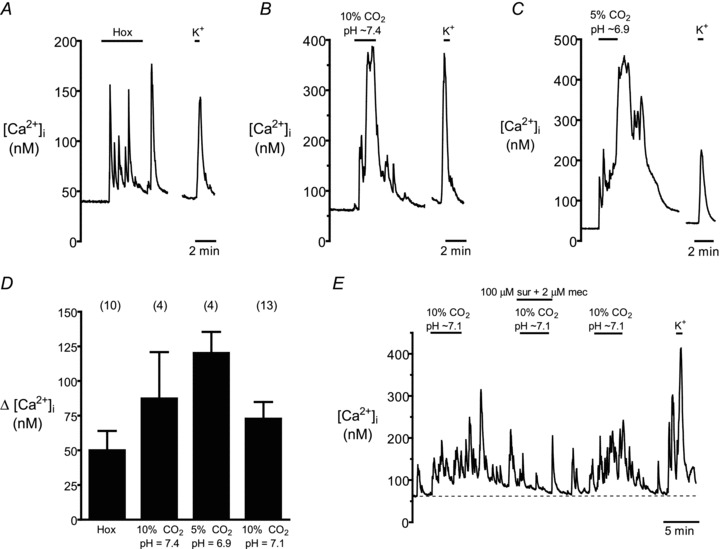
Upper traces (A–C) show Δ[Ca2+]i in neurons from different cultures exposed to hypoxia (Hox), isohydric hypercapnia (10% CO2, pH 7.4), isocapnic acidosis (H+, 5% CO2, pH 6.9), as well as the depolarizing stimulus high (30 mm) K+. Pooled data from all chemosensitive neurons, including those exposed to acidic hypercapnia (10% CO2, pH 7.1), are summarized in the histogram (D). E, effect of combined application of purinergic P2X and nicotinic ACh receptor blockers, i.e. suramin (sur, 100 μm) and mecamylamine (mec, 2 μm) respectively, on a neuronal [Ca2+]i response induced by acidic hypercapnia; note reversible suppression of  response by these blockers, as well as the robust response to high K+ at the end of the experiment (n = 3).
The above [Ca2+]i responses observed in AB local neurons could be attributable to a direct chemosensitivity of the neurons themselves or, they may arise secondarily, from interactions with chemoreceptor type I cells and/or other interneurons. As ATP is a key sensory CB transmitter that is thought to be co-released with ACh from rat type I cells (Nurse, 2010), we wondered whether the neuronal [Ca2+]i responses in AB cultures could be inhibited by purinergic and/or nicotinic receptor blockers. The results of these experiments were inconclusive (n = 5), in part because of the prolonged, spontaneous Δ[Ca2+]i spike activity that commonly occurred after stimulus application (see above), and secondly, the response to multiple stimulus applications tended to run down over time. Nonetheless, in 2 out of 3 cases, one of which is illustrated in Fig. 6E, it appeared that the Δ[Ca2+]i signal in an AB neuron that responded to acidic hypercapnia was partially inhibited during co-incubation with suramin (100 μm) and mecamylamine (2 μm), i.e. non-specific blockers of P2 and nicotinic ACh receptors, respectively. Clearly, further studies are required to elucidate the mechanisms underlying the intracellular Ca2+ responses of local AB neurons to chemostimuli.
Discussion
In this study, we show for the first time that rat aortic body (AB) type I cells located at the junction of the left vagus and recurrent laryngeal nerves are directly sensitive to a variety of chemostimuli. In a previous study using patch-clamp techniques, 5-HT-containing epithelioid cells in the chick AB were found to be hypoxia sensitive (Ito et al. 1999) and, to our knowledge, this represents the only other case where aortic chemoreceptor cells have been directly studied in vertebrates. Using a novel dissociated cell culture model and ratiometric Ca2+ imaging, we found that several stimuli that typically activate chemoreceptor type I cells of the mammalian carotid body (CB), including hypoxia and hypercapnia, elicited reversible increases in cytosolic [Ca2+] in the AB type I cells. Interestingly, these stimuli also increased [Ca2+]i in a population of local neurons that are endogenous to the ABs in this region. These neurons not only survived our culture conditions but appear to represent a distinct population whose origin and function were previously unknown (Dvorakova & Kummer, 2005; Piskuric et al. 2011). By contrast, innervation of rat ABs by the sensory nodose ganglion has been demonstrated in multiple labelling and immunohistochemical studies (Hansen, 1981; Kummer & Neuhuber, 1989; Dahlqvist et al. 1994), and the presence of chemoafferent fibres, in addition to baroreceptor ones, has been demonstrated in the rat aortic nerve (Cheng et al. 1997). Moreover, in single- or few-fibre recordings from the rat aortic and superior laryngeal nerves, respiratory stimulants (e.g. cyanide) were found to activate AB chemoafferents (Brophy et al. 1999; O’Leary et al. 2004), although other studies appear contradictory (Sapru et al. 1981; Kobayashi et al. 1999).
Sensitivity of aortic body type I cells to chemostimuli
The present study provides strong evidence that rat AB type I cells are directly chemosensitive, responding to a variety of stimuli, i.e. hypoxia, isohydric or acidic hypercapnia, and isocapnic acidosis, with a rise in intracellular [Ca2+]i. In the prototypic CB, these chemostimuli are thought to depolarize type I cells, leading to voltage-gated Ca2+ entry and neurotransmitter release (Gonzalez et al. 1994; Buckler, 2007). Thus, measurements of Δ[Ca2+]i in response to chemostimuli have proved to be a useful tool for studying type I cell chemosensitivity in the CB (Buckler & Vaughan-Jones, 1994a,b). Notwithstanding the possibility that the chemosensitivity of AB and CB type I cells may develop along different time courses, it appeared that within the same animals the [Ca2+]i responses for a given stimulus were similar in cells obtained from the two regions. Also, the [Ca2+]i responses to acidic hypercapnia in both AB and CB type I cells were inhibited by 2 mm Ni2+, a non-specific blocker of voltage-gated Ca2+ channels, consistent with previous studies on CB type I cells (Buckler & Vaughan-Jones, 1994a,b). The present study did not address the ionic mechanisms mediating the presumptive stimulus-induced depolarization of AB type I cells. However, it is noteworthy that at least one background K+ channel subunit (i.e. TASK 3), known to contribute to hypoxia- and acidic chemotransduction in CB type I cells (Buckler, 2007), also appears to be expressed in AB type I cells (Yamamoto & Taniguchi, 2003).
Data on single type I cells or small clusters (<5 cells) provided a more reliable estimate of the percentage of responsive AB chemoreceptor cells to the various stimuli. Larger clusters were more likely to be contaminated by non-chemoreceptor, GFAP-positive glial cells, which were much more abundant in AB relative to CB cultures (Nurse & Fearon, 2002; Piskuric et al. 2011). In the present study, glial cells were identified in part by their failure to elicit a [Ca2+]i response to the depolarizing stimulus high K+; however, they do respond to ATP which is now thought to be a key excitatory sensory transmitter released from type I cells following stimulus-induced depolarization (see below; Nurse, 2010). Among the smaller clusters, we found a similar percentage of responsive type I cells to elevated CO2/H+ in AB and CB cultures, though the percentage of responsive cells to moderate hypoxia appeared lower in AB cultures. Given that previous studies have suggested that the AB is less sensitive to  than the CB (Lahiri et al. 1981a), it may not be surprising that moderate hypoxia activated a smaller proportion of AB type I cells. This apparent blunting of
  sensitivity in AB type I cells may be related to the idea that the AB resides in a microenvironment where the tissue
  is thought to be lower than that in the CB (Lahiri et al. 1981b). This may have developmental consequences on
  sensitivity, analogous to the situation that occurs when rat pups are raised in a chronic reduced O2 environment during early fetal and post-natal stages. Such conditions are well known to cause blunting of CB type I cell chemosensitivity, associated with reduced expression of O2-sensitive K+ currents (Wyatt et al. 1995). Though acidic hypercapnia appeared to elicit smaller and fewer positive responses than isohydric hypercapnia or isocapnic acidosis in any given cell type, a direct comparison is invalid as corrections for the effect of intracellular acidity on the Kd of the fluorescent probe fura-2 were not taken into account. Indeed, failing to correct for this change means that all Δ[Ca2+]i responses to acidic stimuli are probably underestimates. In general, regardless of the stimulus, direct comparisons of the percentage of responsive cells between this and other studies are not possible because of several unknown factors including: (i) differences in relative sampling of single cells vs. cells in clusters of variable sizes and (ii) differences in the criteria used for classifying cells as ‘responsive’.
A subset of glia-like cells in AB cultures may be analogous to CB type II cells
As mentioned above, a characteristic feature of AB cultures was the high density of GFAP-positive glia-like cells, many of which seemed to overlap clusters of TH-positive type I cells (Fig. 1; see also Piskuric et al. 2011). Because earlier studies of AB morphology reported that type I cells are ∼3–4 times more abundant than GFAP-positive, glia-like type II cells in vivo (Kummer & Neuhuber, 1989), as is the case for the CB (McDonald & Mitchell, 1975), the origin of glia-like cells in AB cultures was uncertain. A major source of these glial cells is likely to be from the surrounding peripheral vagus and recurrent laryngeal nerves, which are expected to contain GFAP-positive Schwann cells. This is in contrast to the CB cultures, where glial cells are predominantly type II cells (Nurse & Fearon, 2002), which are thought to participate in purinergic paracrine cell–cell signalling via P2Y2 receptors during chemotransduction (Xu et al. 2003). Given that P2Y2 receptors on CB type II cells show roughly equal sensitivities to ATP and UTP (Xu et al. 2003), we compared the effects of these two agonists on Δ[Ca2+]i in glia-like cells in AB cultures. Approximately 40% of glia-like cells were sensitive to ATP and UTP, whereas the remainder was ATP sensitive, but UTP insensitive. These data suggest that not all glia-like cells in AB cultures are analogous to type II cells of the CB and that the ATP-sensitive, UTP-insensitive populations are probably non-myelinating Schwann cells from the vagus nerve that express P2Y1 purinergic receptors (Mayer et al. 1998).
Possible significance of local neurons to aortic body function
Physiological reflexes initiated by ABs have so far not been well studied in the rat; however, extensive studies on AB chemoafferents in cats may provide some clues. Lahiri and co-workers showed that increases in arterial  (with the associated changes in arterial [H+]) increased chemoafferent discharge rates even in hyperoxia, and the combined effects of hypoxia and hypercapnia were additive (Lahiri et al. 1979). Furthermore, they found that although ABs are excited by changes in arterial
  and
and  , they are less sensitive than CBs especially to increases in CO2 (Lahiri et al. 1981a). Also, stressors known to decrease arterial O2 content while maintaining arterial
  (e.g. anaemia, hypotension and carboxyhemoglobinemia) caused significant excitation of AB chemoafferents, but had no effect on the CB (Hatcher et al. 1978; Lahiri et al. 1980, 1981b). These studies led to the hypothesis that the delivery of oxyhaemoglobin is important for AB but not CB tissue, suggesting a limited blood flow to the AB. This could partially explain why AB chemoafferents had weak responses to increases in arterial
  in vivo, i.e. a lower blood flow resulted in a lower CO2 delivery to the AB tissue. However, in the present study stimulus levels reaching the cells were similar in both CB and AB cell culture preparations; this resulted in significant and comparable responses to elevations in CO2/H+.
A significant and novel finding in this study was that all chemostimuli tested were effective in eliciting [Ca2+]i responses in at least a subpopulation of local AB neurons. In our recent study, processes from some local AB neurons appeared to contact type I clusters both in situ and in vitro (Piskuric et al. 2011). It is noteworthy that the pattern of chemosensitivity displayed by AB neurons paralleled that of AB type I cells, i.e. isohydric hypercapnia and isocapnic acidosis excited the largest proportion of neurons and type I cells, and also elicited the largest responses. This would be expected if the neuronal responses were indirect and mediated via chemical synaptic transmission from type I cells. Indeed, in the rat CB, release of ATP along with other excitatory co-transmitters (e.g. ACh) from type I cells onto chemoafferent nerve endings is thought to be the principal mechanism mediating sensory transmission (Zhang et al. 2000; Zhang & Nurse, 2004; Nurse, 2010). In the present study, attempts to block [Ca2+]i responses in AB neurons using purinergic and nicotinic receptor blockers that are effective in the CB met with only limited success. Thus, although AB type I cells are transducers of the chemostimuli used in this study, we cannot presently exclude the possibility that local neurons may also be directly chemosensitive. In this regard, the proportion of neurons responding to hypoxia may appear higher than that for type I cells. Such inferences, however, should be interpreted with caution. First, all local AB neurons appear to be cholinergic, as indicated by positive immunoreactivity against the vesicular ACh transporter, VAChT (Dvorakova & Kummer, 2005; Piskuric et al. 2011), and could potentially interact with each other via chemical (and possibly electrical) synapses; this could lead to an overestimation of the actual proportion of ‘chemosensory’ neurons. Second, the effects of weakly responsive type I cells in a cluster could summate so as to drive a single neuron whose branches made functional contacts with these cells (Piskuric et al. 2011).
What is the purpose of local AB neurons that are present in situ as well as in dissociated cell culture (Piskuric et al. 2011)? Previous authors have suggested that local neurons near AB paraganglia are either sensory or autonomic efferent neurons (Kummer & Neuhuber, 1989). Consistent with this view, a small percentage (∼5%) of nerve endings on AB paraganglia did not degenerate after vagotomy (Hansen, 1981), and some vagal neurons were retrogradely labelled by tracer injection into the nodose ganglion (Kummer & Neuhuber, 1989). By contrast, the CB is known to contain a small population of nNOS-positive autonomic ‘microganglion’ neurons thought to be involved in chemoreceptor inhibition (Wang et al. 1993; Campanucci & Nurse, 2007); however, these neurons do not survive our culture conditions. In a previous study (Piskuric et al. 2011), we showed that some local AB neurons expressed purinergic receptor subunits (i.e. P2X2, P2X3) which, incidentally, are characteristic of CB sensory afferent and autonomic efferent neurons (Prasad et al. 2001; Campanucci et al. 2006). Though further studies are required to firmly establish the role of AB local neurons, we suggest that in addition to relaying chemoreceptor input to the central nervous system, these neurons may participate in the regulation of the local vasculature or cardiac function. Thus, the placement of the AB near the aortic arch at the junction of the vagus and recurrent laryngeal nerves would be strategic, endowing it with a unique physiological function that is separate from the CB, and specific to its niche near the heart.
In summary, we demonstrate for the first time that rat AB type I cells are directly chemosensitive, responding to a variety of chemostimuli with increases in cytosolic [Ca2+]. Moreover, we found that some of the local neurons at the periphery of the AB paraganglion are also chemosensitive, and this is consistent with a putative sensory function. Further studies are required to identify the chemosensory mechanisms and cellular targets of these local neurons.
Acknowledgments
The authors thank Cathy Vollmer for her expert technical assistance. This work was supported by an operating grant from the Canadian Institutes of Health Research (MOP 12037) to C.A.N. N.A.P. was supported by a Vanier Canada Graduate Scholarship from the Natural Sciences and Engineering Research Council of Canada (NSERC). The Leica TCS SP5 II confocal system was purchased with a grant from the Canadian Foundation for Innovation-Leaders Opportunity Fund.
Glossary
Abbreviations
- AB
aortic body
- BBS
bicarbonate-buffered solution
- CB
carotid body
- GFAP
glial-fibrillary acidic protein
- nNOS
neuronal nitric oxide synthase
- RLN
recurrent laryngeal nerve
- TH
tyrosine hydroxylase
- VAChT
vesicular acetylcholine transporter
Author contributions
N.A.P. conceived and designed the experiments, collected, analysed and interpreted the data, and wrote the manuscript. C.A.N. participated in conception and design of experiments and revision of the manuscript. Both authors approved the final version of this manuscript.
References
- Brophy S, Ford TW, Carey M, Jones JF. Activity of aortic chemoreceptors in the anaesthetized rat. J Physiol. 1999;514:821–828. doi: 10.1111/j.1469-7793.1999.821ad.x. [DOI] [PMC free article] [PubMed] [Google Scholar]
- Buckler KJ. TASK-like potassium channels and oxygen sensing in the carotid body. Respir Physiol Neurobiol. 2007;157:55–64. doi: 10.1016/j.resp.2007.02.013. [DOI] [PubMed] [Google Scholar]
- Buckler KJ, Vaughan-Jones RD. Effects of hypoxia on membrane potential and intracellular calcium in rat neonatal carotid body type I cells. J Physiol. 1994a;476:423–428. doi: 10.1113/jphysiol.1994.sp020143. [DOI] [PMC free article] [PubMed] [Google Scholar]
- Buckler KJ, Vaughan-Jones RD. Effects of hypercapnia on membrane potential and intracellular calcium in rat carotid body type I cells. J Physiol. 1994b;478:157–171. doi: 10.1113/jphysiol.1994.sp020239. [DOI] [PMC free article] [PubMed] [Google Scholar]
- Campanucci VA, Nurse CA. Autonomic innervation of the carotid body: role in efferent inhibition. Respir Physiol Neurobiol. 2007;157:83–92. doi: 10.1016/j.resp.2007.01.020. [DOI] [PubMed] [Google Scholar]
- Campanucci VA, Zhang M, Vollmer C, Nurse CA. Expression of multiple P2X receptors by glossopharyngeal neurons projecting to rat carotid body O2-chemoreceptors: role in nitric oxide-mediated efferent inhibition. J Neurosci. 2006;26:9482–9493. doi: 10.1523/JNEUROSCI.1672-06.2006. [DOI] [PMC free article] [PubMed] [Google Scholar]
- Cheng Z, Powley TL, Schwaber JS, Doyle FJ., 3rd A laser confocal microscopic study of vagal afferent innervation of rat aortic arch: chemoreceptors as well as baroreceptors. J Auton Nerv Syst. 1997;67:1–14. doi: 10.1016/s0165-1838(97)00085-4. [DOI] [PubMed] [Google Scholar]
- Comroe JHJ. The location and function of the chemoreceptors of the aorta. Am J Physiol. 1939;127:176–191. [Google Scholar]
- Dahlqvist A, Carlsoo B, Domeij S, Hellstrom S. Morphometric analysis of glomus cells within the recurrent laryngeal nerve of the rat. J Neurocytol. 1984;13:407–416. doi: 10.1007/BF01148331. [DOI] [PubMed] [Google Scholar]
- Dahlqvist A, Neuhuber WL, Forsgren S. Innervation of laryngeal nerve paraganglia: an anterograde tracing and immunohistochemical study in the rat. J Comp Neurol. 1994;345:440–446. doi: 10.1002/cne.903450310. [DOI] [PubMed] [Google Scholar]
- Drummond GB. Reporting ethical matters in The Journal of Physiology: standards and advice. J Physiol. 2009;587:713–719. doi: 10.1113/jphysiol.2008.167387. [DOI] [PMC free article] [PubMed] [Google Scholar]
- Dvorakova MC, Kummer W. Immunohistochemical evidence for species-specific coexistence of catecholamines, serotonin, acetylcholine and nitric oxide in glomus cells of rat and guinea pig aortic bodies. Ann Anat. 2005;187:323–331. doi: 10.1016/j.aanat.2005.03.006. [DOI] [PubMed] [Google Scholar]
- Gonzalez C, Almaraz L, Obeso A, Rigual R. Carotid body chemoreceptors: from natural stimuli to sensory discharges. Physiol Rev. 1994;74:829–898. doi: 10.1152/physrev.1994.74.4.829. [DOI] [PubMed] [Google Scholar]
- Grynkiewicz G, Poenie M, Tsien RY. A new generation of Ca2+ indicators with greatly improved fluorescence properties. J Biol Chem. 1985;260:3440–3450. [PubMed] [Google Scholar]
- Hansen JT. Innervation of the rat aortic (subclavian) body: an ultrastructural study following axonal degeneration. J Ultrastruct Res. 1981;74:83–94. doi: 10.1016/s0022-5320(81)80111-6. [DOI] [PubMed] [Google Scholar]
- Hatcher JD, Chiu LK, Jennings DB. Anemia as a stimulus to aortic and carotid chemoreceptors in the cat. J Appl Physiol. 1978;44:696–702. doi: 10.1152/jappl.1978.44.5.696. [DOI] [PubMed] [Google Scholar]
- Ito S, Ohta T, Nakazato Y. Characteristics of 5-HT-containing chemoreceptor cells of the chicken aortic body. J Physiol. 1999;515:49–59. doi: 10.1111/j.1469-7793.1999.049ad.x. [DOI] [PMC free article] [PubMed] [Google Scholar]
- Jones JF. Aortic body chemoreflex of the anaesthetized rat. Electrophysiological, morphological, and reflex studies. Adv Exp Med Biol. 2000;475:789–792. doi: 10.1007/0-306-46825-5_79. [DOI] [PubMed] [Google Scholar]
- Kobayashi M, Cheng ZB, Tanaka K, Nosaka S. Is the aortic depressor nerve involved in arterial chemoreflexes in rats? J Auton Nerv Syst. 1999;78:38–48. doi: 10.1016/s0165-1838(99)00054-5. [DOI] [PubMed] [Google Scholar]
- Kummer W, Neuhuber WL. Vagal paraganglia of the rat. J Electron Microsc Tech. 1989;12:343–355. doi: 10.1002/jemt.1060120407. [DOI] [PubMed] [Google Scholar]
- Lahiri S, Mokashi A, Mulligan E, Nishino T. Comparison of aortic and carotid chemoreceptor responses to hypercapnia and hypoxia. J Appl Physiol. 1981a;51:55–61. doi: 10.1152/jappl.1981.51.1.55. [DOI] [PubMed] [Google Scholar]
- Lahiri S, Mulligan E, Nishino T, Mokashi A. Aortic body chemoreceptor responses to changes in PCO2 and PO2 in the cat. J Appl Physiol. 1979;47:858–866. doi: 10.1152/jappl.1979.47.4.858. [DOI] [PubMed] [Google Scholar]
- Lahiri S, Mulligan E, Nishino T, Mokashi A, Davies RO. Relative responses of aortic body and carotid body chemoreceptors to carboxyhemoglobinemia. J Appl Physiol. 1981b;50:580–586. doi: 10.1152/jappl.1981.50.3.580. [DOI] [PubMed] [Google Scholar]
- Lahiri S, Nishino T, Mokashi A, Mulligan E. Relative responses of aortic body and carotid body chemoreceptors to hypotension. J Appl Physiol. 1980;48:781–788. doi: 10.1152/jappl.1980.48.5.781. [DOI] [PubMed] [Google Scholar]
- McDonald DM, Blewett RW. Location and size of carotid body-like organs (paraganglia) revealed in rats by the permeability of blood vessels to Evans blue dye. J Neurocytol. 1981;10:607–643. doi: 10.1007/BF01262593. [DOI] [PubMed] [Google Scholar]
- McDonald DM, Mitchell RA. The innervation of glomus cells, ganglion cells and blood vessels inthe rat carotid body: a quantitative ultrastructural analysis. J Neurocytol. 1975;4:177–230. [Google Scholar]
- Mayer C, Quasthoff S, Grafe P. Differences in the sensitivity to purinergic stimulation of myelinating and non-myelinating Schwann cells in peripheral human and rat nerve. Glia. 1998;23:374–382. doi: 10.1002/(sici)1098-1136(199808)23:4<374::aid-glia9>3.0.co;2-2. [DOI] [PubMed] [Google Scholar]
- Milsom WK, Burleson ML. Peripheral arterial chemoreceptors and the evolution of the carotid body. Respir Physiol Neurobiol. 2007;157:4–11. doi: 10.1016/j.resp.2007.02.007. [DOI] [PubMed] [Google Scholar]
- Nurse CA. Carbonic anhydrase and neuronal enzymes in cultured glomus cells of the carotid body of the rat. Cell Tissue Res. 1990;261:65–71. doi: 10.1007/BF00329439. [DOI] [PubMed] [Google Scholar]
- Nurse CA. Neurotransmitter and neuromodulatory mechanisms at peripheral arterial chemoreceptors. Exp Physiol. 2010;95:657–667. doi: 10.1113/expphysiol.2009.049312. [DOI] [PubMed] [Google Scholar]
- Nurse CA, Fearon IM. Carotid body chemoreceptors in dissociated cell culture. Microsc Res Tech. 2002;59:249–255. doi: 10.1002/jemt.10199. [DOI] [PubMed] [Google Scholar]
- O’Leary DM, Murphy A, Pickering M, Jones JF. Arterial chemoreceptors in the superior laryngeal nerve of the rat. Respir Physiol Neurobiol. 2004;141:137–144. doi: 10.1016/j.resp.2004.05.003. [DOI] [PubMed] [Google Scholar]
- Piskuric NA, Vollmer C, Nurse CA. Confocal immunofluorescence study of rat aortic body chemoreceptors and associated neurons in situ and in vitro. J Comp Neurol. 2011;519:856–873. doi: 10.1002/cne.22553. [DOI] [PubMed] [Google Scholar]
- Pokorski M, Lahiri S. Aortic and carotid chemoreceptor responses to metabolic acidosis in the cat. Am J Physiol Regul Integr Comp Physiol. 1983;244:R652–R658. doi: 10.1152/ajpregu.1983.244.5.R652. [DOI] [PubMed] [Google Scholar]
- Prasad M, Fearon IM, Zhang M, Laing M, Vollmer C, Nurse CA. Expression of P2X2 and P2X3 receptor subunits in rat carotid body afferent neurones: role in chemosensory signalling. J Physiol. 2001;537:667–677. doi: 10.1111/j.1469-7793.2001.00667.x. [DOI] [PMC free article] [PubMed] [Google Scholar]
- Sapru HN, Gonzalez E, Krieger AJ. Aortic nerve stimulation in the rat: cardiovascular and respiratory responses. Brain Res Bull. 1981;6:393–398. doi: 10.1016/s0361-9230(81)80009-3. [DOI] [PubMed] [Google Scholar]
- von Kugelgen I. Pharmacological profiles of cloned mammalian P2Y-receptor subtypes. Pharmacol Ther. 2006;110:415–432. doi: 10.1016/j.pharmthera.2005.08.014. [DOI] [PubMed] [Google Scholar]
- Wang ZZ, Bredt DS, Fidone SJ, Stensaas LJ. Neurons synthesizing nitric oxide innervate the mammalian carotid body. J Comp Neurol. 1993;336:419–432. doi: 10.1002/cne.903360308. [DOI] [PubMed] [Google Scholar]
- Wyatt CN, Wright C, Bee D, Peers C. O2-sensitive K+ currents in carotid body chemoreceptor cells from normoxic and chronically hypoxic rats and their roles in hypoxic chemotransduction. Proc Natl Acad Sci U S A. 1995;92:295–299. doi: 10.1073/pnas.92.1.295. [DOI] [PMC free article] [PubMed] [Google Scholar]
- Xu J, Tse FW, Tse A. ATP triggers intracellular Ca2+ release in type II cells of the rat carotid body. J Physiol. 2003;549:739–747. doi: 10.1113/jphysiol.2003.039735. [DOI] [PMC free article] [PubMed] [Google Scholar]
- Yamamoto Y, Taniguchi K. Heterogeneous expression of TASK-3 and TRAAK in rat paraganglionic cells. Histochem Cell Biol. 2003;120:335–339. doi: 10.1007/s00418-003-0577-5. [DOI] [PubMed] [Google Scholar]
- Zhang M, Nurse CA. CO2/pH chemosensory signaling in co-cultures of rat carotid body receptors and petrosal neurons: role of ATP and ACh. J Neurophysiol. 2004;92:3433–3445. doi: 10.1152/jn.01099.2003. [DOI] [PubMed] [Google Scholar]
- Zhang M, Zhong H, Vollmer C, Nurse CA. Co-release of ATP and ACh mediates hypoxic signalling at rat carotid body chemoreceptors. J Physiol. 2000;525:143–158. doi: 10.1111/j.1469-7793.2000.t01-1-00143.x. [DOI] [PMC free article] [PubMed] [Google Scholar]
- Zhong H, Zhang M, Nurse CA. Synapse formation and hypoxic signalling in co-cultures of rat petrosal neurones and carotid body type 1 cells. J Physiol. 1997;503:599–612. doi: 10.1111/j.1469-7793.1997.599bg.x. [DOI] [PMC free article] [PubMed] [Google Scholar]