In patients with acute pulmonary embolism, right heart dilatation was associated with higher risk of short-term mortality along with history of congestive heart failure and cancer.
Abstract
Purpose:
To assess the correlation between volumetric measurements of clot, semiquantitative clot burden indexes, and signs of right heart dysfunction at computed tomographic (CT) pulmonary angiography in patients with acute pulmonary embolism (PE) and to determine whether clot burden and signs of right heart dysfunction are associated with short-term mortality.
Materials and Methods:
This retrospective study was institutional review board approved and HIPAA compliant. CT pulmonary angiographic studies (January 2007 through December 2007) with findings positive for PE were retrieved. Two readers evaluated signs of right heart dysfunction at CT pulmonary angiography, measured clot volume using a dedicated software program, and assessed clot burden using semiquantitative scores (Qanadli and Mastora). Spearman rank coefficient was used to investigate correlation between clot burden measures and signs of right heart dysfunction. Uni- and multivariate analyses were used to test association between CT pulmonary angiographic findings and short-term mortality.
Results:
A total of 635 CT pulmonary angiographic studies from 635 patients (304 men, 331 women; mean age, 59 years) were included; 39 (6%) patients died within 30 days. Clot volume was strongly correlated with Qanadli score (ρ = 0.841, P < .01) and Mastora score (ρ = 0.863, P < .01) and moderately correlated (ρ = 0.378, P < .01) with the ratio of right ventricle diameter to left ventricle diameter (RV/LV ratio). Among the pulmonary angiographic signs, only increase in RV/LV ratio (cut-off value, 1.0) was independently associated with short-term mortality in multivariate analysis.
Conclusion:
Clot volume strongly correlated with semiquantitative CT scores of clot burden, and greater clot volume was associated with higher incidence of right heart dilatation. Increase in RV/LV ratio was associated with short-term mortality; however, measures of clot burden were not.
© RSNA, 2012
Supplemental material: http://radiology.rsna.org/lookup/suppl/doi:10.1148/radiol.12110802/-/DC1
Introduction
Risk stratification for patients with acute pulmonary embolism (PE) is important to establish appropriate treatment and management (1). Patients at high risk of mortality associated with PE may receive thrombolytic treatment and close surveillance in intensive care settings, whereas patients with low risk may be discharged earlier and treated with anticoagulation (1,2). Current risk prediction rules for patients with PE are mainly based on clinical and laboratory parameters (3,4). Additional information for risk prediction may be obtained from clinical imaging studies used for the detection of PE. Among the commonly used clinical imaging modalities, computed tomographic (CT) pulmonary angiography is widely accepted as the first-line of diagnostic imaging (5) and offers the potential for prognostic imaging biomarkers.
CT signs of right heart strain, as well as dedicated CT pulmonary angiographic indexes of clot burden, such as Qanadli (also known as pulmonary artery obstruction index) (6) and Mastora scores (7), have been proposed as predictive biomarkers for short-term mortality in patients with acute PE (8–15). However, other studies reported no significant association between mortality and CT pulmonary angiographic signs of right heart strain (12,15–17) or clot burden indexes (10–12,15,18). This controversy may be associated with the fact that some of these studies included small sample size and only few studies correlated their results with patients’ clinical presentation and morbidity status (11–15,17).
Recent studies suggested that the measurement of blood clot volume at CT pulmonary angiography may be used as a new CT imaging biomarker in patients with acute PE (19,20). Compared with previously reported clot burden indexes, fully quantitative volumetric measurement of PE may provide a more precise indication of the patient’s clot burden as it would not be subjected to arbitrary qualitative weighting factors, including clot location within the pulmonary vasculature and the grade of obstruction. However, the potential predictive role of clot volume as measured on CT pulmonary angiographic images has received limited attention (20).
Thus, the purposes of our study were to assess the correlation between the direct volumetric measurement of clot, semiquantitative clot burden indexes (Qanadli and Mastora scores), and signs of right heart dysfunction at CT pulmonary angiography in patients with acute PE and to determine whether clot burden and signs of right heart dysfunction are associated with short-term mortality.
Materials and Methods
After institutional review board approval, imaging and clinical data from January 1, 2007 through December 31, 2007 were retrospectively reviewed by using the institutional medical archive system (21). All subjects were older than 18 years of age and underwent at least one CT pulmonary angiographic examination with a mention of terminology suggesting a PE event. Subjects were initially identified by means of procedure codes, then radiology reports were retrieved and reviewed by two trained radiologists (A.F., A.P., each with 4 years of experience in chest CT) to confirm the PE diagnosis. All data were collected and reviewed in compliance with the Health Insurance Portability and Accountability Act. All clinical and imaging data were de-identified prior to analysis by using an institutional honest broker system.
Population
From January 2007 through December 2007, 5425 CT pulmonary angiographic studies were performed at our institution for evaluation of PE. The studies verified as positive for PE (n = 724) were retrieved. Radiologist readers (A.F., A.P., each with 4 years of experience in chest CT) reviewed the images of each study and determined their inclusion into the study population according to the criteria specified in the Imaging Analysis session. If a patient underwent multiple CT pulmonary angiographic studies during the study period, only the CT with acute PE at initial presentation was included. De-identified history and physical emergency room notes, discharge summaries, and progress notes were retrieved for each patient by the honest broker of the study (M.S.). Information such as patient demographics (age, sex, race), preexisting comorbidities, and discharge disposition were obtained. Comorbidities considered in the study were cancer, congestive heart failure, myocardial infarction, chronic lung disease, chronic renal disease, and cerebrovascular disease (ie, transient ischemic attack or stroke) (4). Positive history of congestive heart failure and/or myocardial infarction indicated impaired cardiac reserve, whereas positive history of chronic obstructive pulmonary disease indicated impaired respiratory reserve. Short-term death was defined as death within 30 days of CT (12).
CT Pulmonary Angiography Protocol
CT pulmonary angiographic studies were performed with either a 64-section (615 patients) or a 16-section (20 patients) multidetector CT scanner (GE Medical System, Milwaukee, Wis) by using a standard CT pulmonary angiography protocol for PE with the following imaging parameters: detector width, 64 × 0.625 or 16 × 1.25 mm; section thickness, 1.25 mm; rotation time, 0.5 second; 120 kVp; and 380 mAs. Images were obtained after intravenous administration of 125 mL of ioversol (Optiray 350; Tyco Health/Mallinckrodt, St Louis, Mo) at a rate of 4–5 mL/sec. The CT scanning was performed with either a 20-second delay or a bolus-tracking technique after the start of the contrast medium injection, from the lowest hemidiaphragm to the top of the lungs.
Image Analysis
All CT pulmonary angiographic images were de-identified and transferred from our picture archiving and communication system (iSite; Philips Healthcare) to a dedicated workstation by means of a virtual private network. Image analysis was performed in consensus by two observers (A.F.; A.P.), each with 4 years of experience in body CT. Any disagreement was resolved by the senior investigator (K.T.B., 15 years of experience interpreting chest CT images). Readers were blinded to the patient’s condition at the time of presentation and the final clinical outcome. Initially, readers performed an overall evaluation of the quality of the CT pulmonary angiographic study (22). Only studies providing acceptable visualization of the pulmonary arteries were included; studies affected by poor vessel enhancement, motion (ie, respiratory or pulsation) artifacts, and noise were excluded. For each study, readers reviewed the CT pulmonary angiographic images and identified each embolus, while comparing the findings described in the radiology diagnostic report. PE was defined as presence of an endoluminal central filling defect partially or completely occluding the pulmonary arteries. Readers were allowed to adjust the window setting to maximize the enhancement between the emboli and the enhanced pulmonary arterial blood according to the windowing scheme published in a previous study (23). Interpretation was performed by using axial images. Reconstructed coronal and sagittal images were also used when axial images alone were deemed inadequate for differentiating clots from adjacent soft tissue.
CT signs of right heart dysfunction.—CT signs used to assess (A.F., A.P.) function of the right heart included the ratio of right ventricle diameter to left ventricle diameter (RV/LV ratio), ratio of main pulmonary artery diameter to ascending aorta diameter (PA/Ao ratio), superior vena cava diameter, azygos vein diameter, interventricular septum morphology, and presence of contrast medium reflux into the inferior vena cava (IVC). Diameters (minor axes) of right and left ventricle were measured on the axial CT image of the heart at their widest point in diastole (usually the image showing the atrioventricular valves) between the inner surface of the free wall and the surface of the interventricular septum (9,24). The RV/LV ratio was calculated. The diameters of the main pulmonary artery and the ascending aorta were measured on the transverse image at which the right pulmonary artery is in contiguity with the main pulmonary artery (25). The PA/Ao ratio was calculated. The diameters of the superior vena cava and azygos vein were measured on the transverse CT image where the azygos vein reaches the superior vena cava (9). Morphology of interventricular septum was considered normal (convex toward the right ventricle), flattened, or bowing (convex toward the left ventricle) (9). Reflux of contrast medium was judged present when it could be detected in the intrahepatic portion of the IVC (9). Finally, pulmonary infarct was deemed present with the identification of a peripheral wedge-shaped consolidation with central lucency (26).
Clot burden.—CT measures of clot burden in each patient included the Qanadli score (ie, pulmonary arterial obstruction index) (6), the Mastora score (7), and quantification of blood clot volume. In addition, the total number of clots and the proximal extension of the clot (27) were also recorded. The most proximal level of the clot (proximal extension of the clot) was classified as mediastinal pulmonary arteries (ie, pulmonary artery trunk, main right and left pulmonary arteries, and right and left interlobar pulmonary arteries), lobar pulmonary arteries, segmental pulmonary arteries, and subsegmental pulmonary arteries (27). Mediastinal and lobar pulmonary arteries were considered central, whereas segmental and subsegmental pulmonary arteries were considered peripheral. The algorithms for the calculation of Qanadli and Mastora scores are described in Appendix E1 (online). The Qanadli and Mastora scores were converted to a percentage value of the obstruction of the pulmonary arterial vessels by dividing them by 40 and 155, respectively. The quantification of PE volume (in cubic millimeters) was performed by using a dedicated software program developed on the basis of a modified seeded region-growing algorithm and implemented in a dedicated workstation for image analysis (19). The algorithm is briefly explained in Appendix E2 (online).
Statistical Analysis
The normal distribution of the measures of clot burden (clot volume, Qanadli score, Mastora score) was tested by using Shapiro-Wilk W test. The correlation between clot volume and two clot burden indexes (Qanadli and Mastora scores) was assessed with the Pearson coefficient (r) for normally distributed data and with the Spearman rank coefficient (ρ) for nonnormally distributed data. The correlation between clot volume and CT signs of right heart dysfunction was also evaluated. A P value of .05 was used to indicate a significant association. Patients were divided into four groups according to their cardiac and respiratory reserve. Group 1 included those with normal cardiac and respiratory reserve; group 2, impaired cardiac reserve but normal respiratory reserve; group 3, normal cardiac reserve but impaired respiratory reserve; and group 4, impaired cardiac and respiratory reserve. The Kruskal-Wallis test was used to assess the significance in the difference of clot volume among the four patient groups with RV/LV ratio of less than 1.0 and with RV/LV ratio of greater than or equal to 1.0 (right heart dilatation). Pairwise comparison among groups was conducted by using the Mann-Whitney U test.
Associations between short-term mortality and comorbid conditions, CT signs of right heart dysfunction, and clot burden measures were assessed by using logistic regression models. To identify CT imaging parameters independently associated with 30-day mortality, only clinical and imaging variables that were significant (P = .1, univariate analysis) were included in the multivariate stepwise logistic regression analysis. For scale variables independently associated with short-term mortality, the classification and regression tree method was used to determine the optimal cut-off values predictive of short-term mortality (28). All statistical analyses were performed by using commercially available software program (Stata version 11; Stata, College Station, Tex).
Results
Population
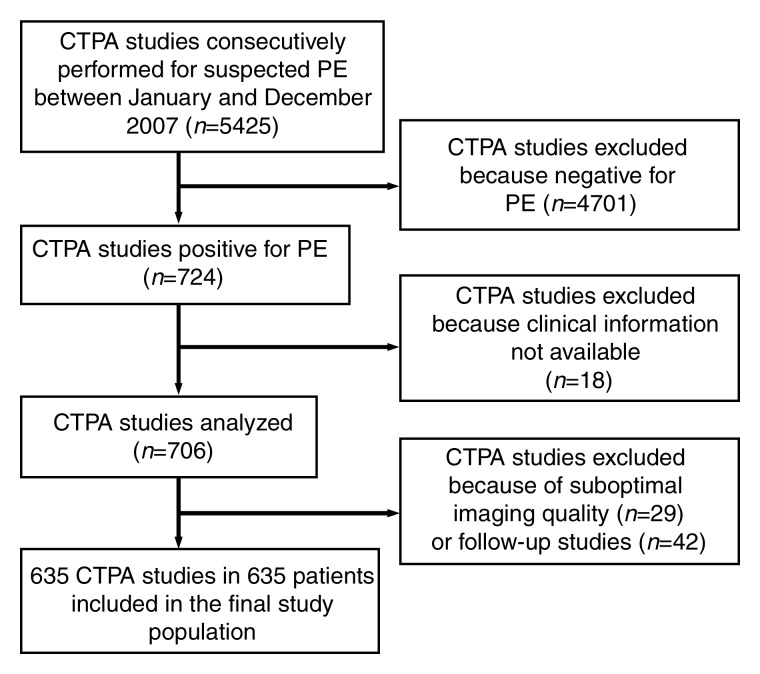
Among 5425 clinical CT pulmonary angiographic studies, findings of 724 (13.3%) were positive for PE. A total of 60 studies were excluded because clinical information (ie, short-term mortality and comorbidities) was not available (n = 18) or because they were follow-ups of the initial CT pulmonary angiographic studies (n = 42). In the remaining 664 studies, 29 were excluded because of suboptimal image quality, that is, diagnostic for PE but inadequate image quality for accurate quantification of clot burden. Consequently, a total of 635 studies from 635 patients were included in the final study population (Fig 1). There were 304 (48%) men (mean age, 58 years; range, 18–94 years) and 331 (52%) women (mean age, 61 years; range, 18–102 years). Patients’ comorbidities are presented in Table 1. There were 513 (80%) inpatients and 122 (20%) outpatients. Thirty-nine (6%) patients died within 30 days after CT scanning; the interval between the diagnosis of PE and death was 0–25 days (mean, 10 days).
Figure 1:
Flowchart of patient selection.
Table 1.
Distribution of the Final Population According to Sex and Comorbidities
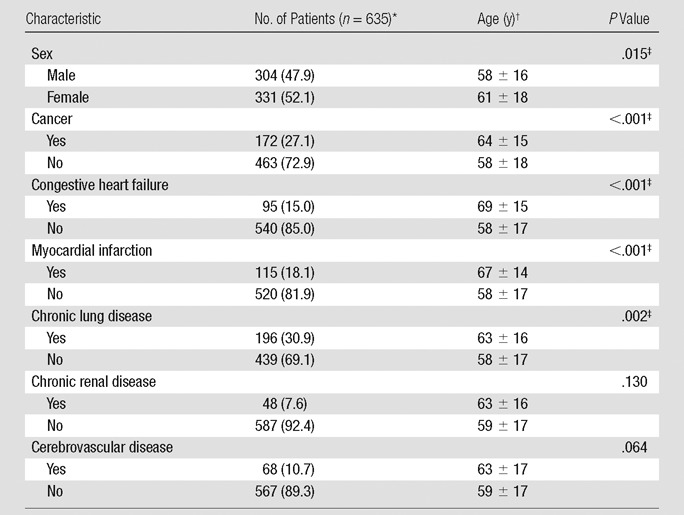
Data in parentheses are percentages.
Data are means ± standard deviation.
Significant at P < .05 (Student t test, two tailed).
There were a total of 1937 PEs in 635 patients, with a median of two clots per patient (range, 1–29). The most proximally affected pulmonary artery branch was mediastinal in 182 (28%) patients, lobar in 151 (25%) patients, segmental in 202 (32%) patients, and subsegmental in 100 (15%) patients. The median blood clot volume per patient was 885.8 mm3 (range, 6.8–47 220.4 mm3). The median Qanadli score was 12.5% (range, 0%–82.5%) and the median Mastora score was 5.2% (range, 0%–82.6%). Signs of right heart dysfunction as measured on the CT pulmonary angiographic images are summarized in Table 2. In 12 cases, disagreement in imaging analysis among the readers was resolved by the senior investigator.
Table 2.
CT Pulmonary Angiographic Signs of Right Heart Dysfunction
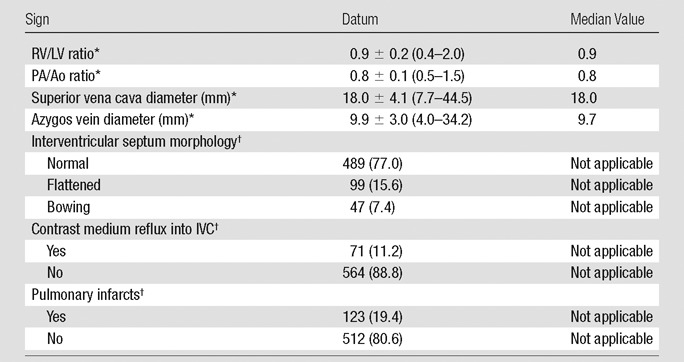
Data are means ± standard deviation; data in parentheses are the range.
Data are the number of patients; data in parentheses are percentages.
Correlation between Clot Volume and Other Indexes of Clot Burden
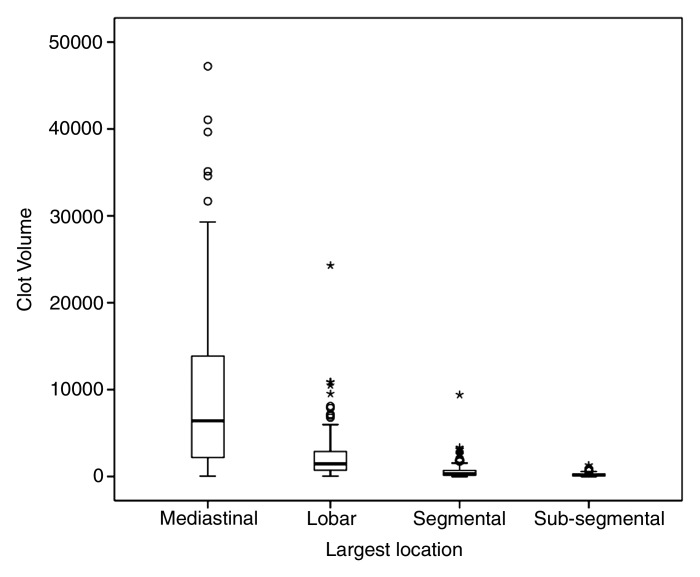
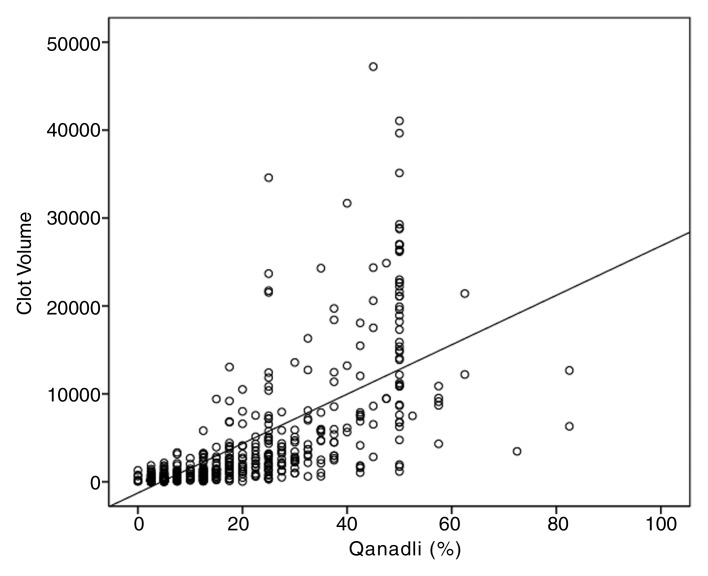
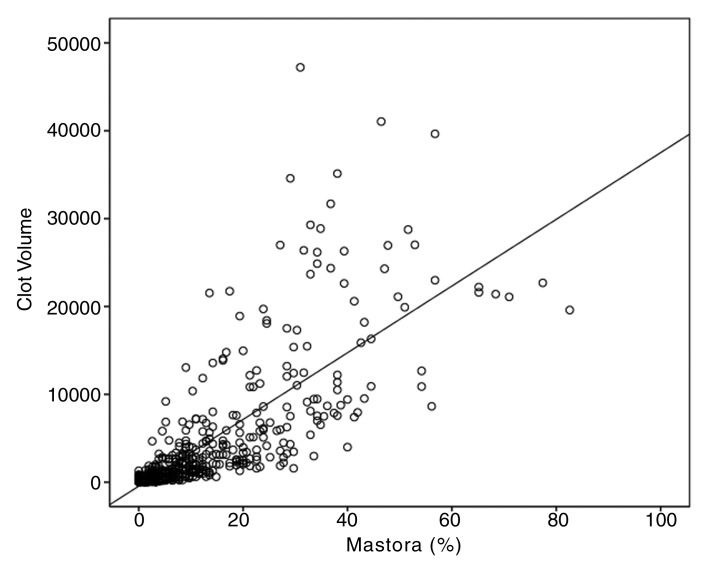
Clot volume showed moderate (ρ = 0.550, P < .001) correlation with the number of clots and strong correlation with the proximal extension of the clot (ρ = 0.762, P < .001); distribution of clot volume according to proximal extension of the clot is shown in Figure 2. The measures of clot burden per location and the correlations between clot volume and Qanadli and Mastora scores are presented in Table 3. For the entire set of 635 CT pulmonary angiographic studies, strong positive correlations were noted between clot volume and Qanadli score (ρ = 0.841, P < .001) (Fig 3a) and between clot volume and Mastora score (ρ = 0.863, P < .001) (Fig 3b). Furthermore, the Qanadli score correlated strongly with the Mastora score (ρ = 0.876, P < .001).
Figure 2:
Box-and-whisker plot shows distribution of clot volume according to the proximal extension of the clot (largest pulmonary artery affected): mediastinal (mean, 9546.3 mm3 ± 699.6; median, 6419.1 mm3), lobar (mean, 2391.8 mm3 ± 234.3; median, 1454.9 mm3), segmental (mean, 613.6 mm3 ± 64.2; median, 314.4 mm3), and subsegmental (mean, 223.8 mm3 ± 23.5; median, 152.1 mm3). Mediastinal = main pulmonary trunk, right and left interlobar arteries.
Table 3.
Correlation between Clot Volume and CT Indexes of Clot Burden according to Most Proximal Extension of PE

Note.—All correlations were calculated by using Spearman rank coefficient. PA = pulmonary arteries.
Data are means ± standard deviation; data in parentheses are the medians.
Significant at P <.01 (two tailed).
Mediastinal and lobar pulmonary arteries.
Segmental and subsegmental pulmonary arteries.
Figure 3a:
Scatter diagrams show strong positive correlation between (a) clot volume and Qanadli score (ρ = 0.841, P <.01) and (b) clot volume and Mastora score (ρ = 0.863, P <.01).
Figure 3b:
Scatter diagrams show strong positive correlation between (a) clot volume and Qanadli score (ρ = 0.841, P <.01) and (b) clot volume and Mastora score (ρ = 0.863, P <.01).
Correlation between Clot Volume and CT Signs of Right Heart Dysfunction
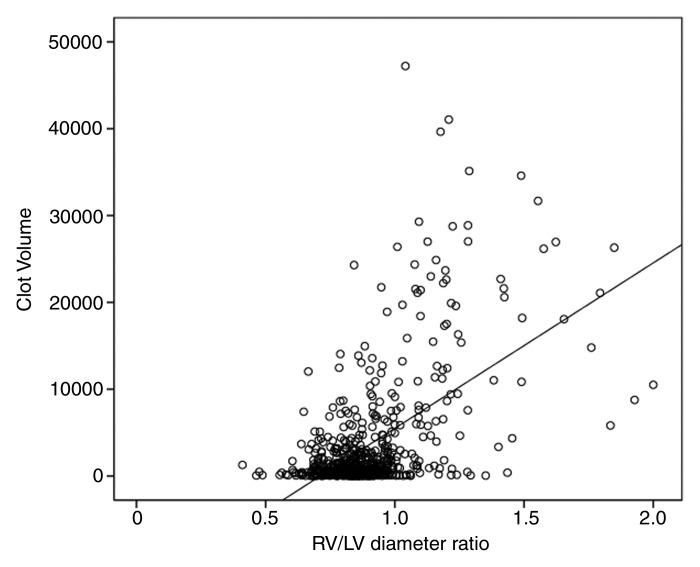
Clot volume showed moderate correlation (ρ = 0.378, P < .001) with RV/LV ratio (Fig 4). The RV/LV ratio was greater than or equal to 1.0 in 114 (18%) patients and less than 1.0 in 521 (82%) patients. The clot volume in patients with RV/LV ratio of greater than or equal to 1.0 was significantly larger (median, 8371.8 mm3) than in patients with RV/LV ratio of less than 1.0 (median, 638.4 mm3) (P < .001). Among the patients with RV/LV ratio of greater than or equal to 1.0, there was a significant difference in the clot volume among the four groups of patients with different cardiac and respiratory reserve (P = .011), whereas no significant difference was appreciated in patients with RV/LV ratio of less than 1.0 (Table 4). Results of pairwise comparisons among the groups in patients with RV/LV ratio of greater than or equal to 1.0 are reported in Table 5. The clot volume in patients with impaired cardiac reserve but normal respiratory reserve (group 2) was significantly lower than that in patients with normal cardiac and respiratory reserve (group 1) (P = .048); the clot volume in patients with impaired cardiac and respiratory reserve (group 4) was significantly lower than that in patients with normal cardiac reserve but impaired respiratory reserve (group 3) (P = .044). There was no significant difference in clot volume between group 3 and group 1, and no difference was appreciated between group 2 and group 4.
Figure 4:
Scatter diagram shows moderate positive correlation between clot volume and RV/LV ratio (ρ = 0.378, P <.01).
Table 4.
Clot Volume according to RV/LV Ratio and Cardiac and Pulmonary Reserve Group

Note.—Group 1, normal cardiac and respiratory reserve; group 2, impaired cardiac reserve but normal respiratory reserve; group 3, normal cardiac reserve but impaired respiratory reserve; and group 4, impaired cardiac and respiratory reserve.
Data are means ± standard deviation; data in parentheses are the medians. Significant at P <.05 (Kruskal-Wallis test).
Table 5.
Pairwise Comparison among Different Groups of Cardiac and Pulmonary Reserve for Patients with RV/LV Ratio ≥ 1.0
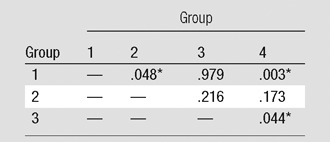
Note.—Data are P values. Group 1, normal cardiac and respiratory reserve; group 2, impaired cardiac reserve but normal respiratory reserve; group 3, normal cardiac reserve but impaired respiratory reserve; and group 4, impaired cardiac and respiratory reserve.
Significant at P < .05 (Mann-Whitney test).
The correlation between clot volume and interventricular septum morphology was moderate (ρ = 0.433). The clot volume in patients with normal morphology interventricular septum (n = 489; median, 593.5 mm3) was significantly lower than that in patients with flattened interventricular septum (n = 99; median, 2895.2 mm3; P < .001; Mann-Whitney U test) and that in patients with bowing interventricular septum (n = 47; median, 15 377.8 mm3; P < .001; Mann-Whitney U test). The clot volume showed only weak correlation with the other CT signs of right heart dysfunction, including the PA/Ao ratio (ρ = 0.224), the superior vena cava diameter (ρ = 0.104), the azygos vein diameter (ρ = 0.167), and contrast medium reflux into the IVC (ρ = 0.067).
Association of Short-term Mortality with Measures of Clot Burden and Signs of Right Heart Dysfunction at CT
Univariate analysis.—Among the patients’ demographics and comorbidities, only presence of cancer (P = .007) and congestive heart failure (P = .006) were significantly associated with short-term death at univariate analysis (Table 6). The associations between CT signs of right heart dysfunction and short-term mortality are reported in Table 7; increased RV/LV ratio (P < .001), increased PA/Ao ratio (P = .052), flattening of interventricular septum (P = .030), bowing of interventricular septum (P = .005), and contrast medium reflux into the IVC (P = .001) were significantly associated with short-term mortality at univariate analysis. Table 8 displays the association between the measures of clot burden and short-term mortality. No significant association was found between the short-term mortality and the number (P = .247) or proximal extension (P > .152) of PEs, nor was there any significant association between the Qanadli score and short-term mortality (P = .995) or between the Mastora score and short-term mortality (P = .659). There was no significant association between blood clot volume and short-term mortality (P = .750).
Table 6.
Univariate Associations between Patient Demographics, Comorbidities, and Short-term Mortality

Numbers in parentheses are percentages.
Significant at P <.1.
Table 7.
Univariate Associations between CT Signs of Right Heart Strain and Short-term Mortality

Values are the medians and values in parentheses are means ± standard deviation.
Significant at P < .1.
Values are number of patients and values in parentheses are percentages.
Table 8.
Univariate Associations between Measures of Clot Burden and Short-term Mortality
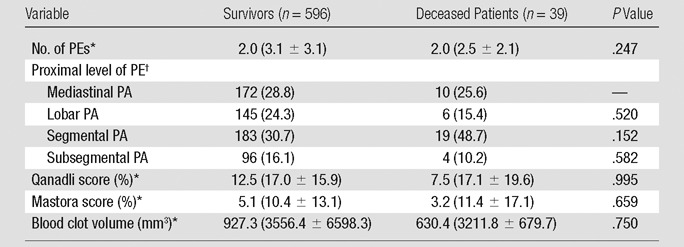
Note.—PA = pulmonary artery. Mediastinal pulmonary artery includes pulmonary artery trunk, main right and left pulmonary arteries, and right and left interlobar pulmonary arteries.
Values are median, and values in parentheses are means ± standard deviation.
Values are the number of patients and values in parentheses are percentages.
Multivariate analysis.—A multivariate model was created by using the following variables: cancer, congestive heart failure, RV/LV ratio, PA/Ao ratio, flattening of interventricular septum, bowing of interventricular septum, and contrast medium reflux into the IVC. After the analysis, history of congestive heart failure (P = .004), cancer (P = .004), and increased RV/LV ratio (P < .001) remained independently and significantly associated with short-term mortality (Table 9). The discriminator cut-off value for RV/LV ratio calculated with the classification and regression tree method was 1.0.
Table 9.
Multivariate Stepwise Logistic Regression Analysis

Significant at P < .05.
Discussion
The results of our study demonstrated that in patients with acute PE, the clot volume measured on CT pulmonary angiographic images strongly correlated with the conventional indexes of clot burden (ie, Qanadli and Mastora scores). This finding is expected, since both the clot volume and the clot burden indexes should likewise increase as the number of pulmonary artery segments and heightened degree of obstruction are affected by PE. In particular, correlations between clot volume and Qanadli and Mastora scores were stronger with the involvement of central pulmonary arteries than with the involvement of peripheral pulmonary arteries. This difference could be explained, since the clot burden from subsegmental pulmonary arteries is less contributory to the Mastora and Qanadli index. The subsegmental clots are not included in the calculation of the Mastora score, whereas they are given one point in the Qanadli scoring, regardless of their extension and number of the affected subsegmental arteries in each segmental branch. In our study, 100 (15%) patients had clots located only in subsegmental arteries, with a median volume of 152.1 mm3 (range, 7.4–1305.4 mm3).
A number of CT signs of right heart dysfunction have been proposed for predicting prognosis of patients with acute PE (9–12). Among the signs included in this study, the RV/LV ratio (ρ = 0.378) and the morphology of the interventricular septum (ρ = 0.433) showed the highest correlation with clot volume. The results of our study demonstrated that patients with right heart dilatation (RV/LV ratio ≥ 1.0) tended to have significantly larger clot volume than those without right heart dilatation; accordingly, the clot volume in patients with flattened or bowing interventricular septum was larger than that in patients with normal (convex toward right side) interventricular septum morphology. Increased clot volume is likely to interfere with pulmonary circulation, resulting in pressure overload of the right ventricle and right heart dilatation. Furthermore, we noticed that in patients with right heart dilatation, the clot volume changed significantly according to the patient’s cardiac and respiratory function; in particular, patients with underlying impaired cardiac reserve (history of congestive heart failure and/or myocardial infarction) had significantly lower clot volume than patients with normal cardiac reserve. On the other hand, the clot volume did not significantly differ in patients with preexisting impaired respiratory reserve. This differential finding may be interpreted such that patients with preexisting impaired cardiac reserve tend to develop right heart strain with lesser amount of clot blood than patients with normal cardiac reserve (29,30). However, it may be difficult to discern in patients with impaired cardiorespiratory reserve, whether right heart dilatation is associated with de novo clot burden or represents a preexisting alteration.
In our study, among the considered CT signs of right heat dysfunction, the RV/LV ratio, PA/Ao ratio, flattening and bowing of interventricular septum, and contrast medium reflux into the IVC were associated with short-term mortality in the univariate analysis. However, only the increase in RV/LV ratio was independently associated with short-term mortality, along with history of congestive heart failure and cancer. Other CT signs of right heart dysfunction or CT measures of clot burden were not independently significant for the prediction of short-term mortality. Our results are in agreement with those of some previous studies; a larger RV/LV ratio detected at CT pulmonary angiography has been correlated with clinically severe PE (15) and an increased risk of short-term mortality (10,11,31). Hemodynamic effect of PE leading to the development of right heart dysfunction has been previously described (32). Pulmonary arterial obstruction increases pulmonary vascular resistance and sudden elevation in afterload, thereby resulting in a dilatation of the right ventricle, compromise of coronary perfusion and septal shift toward the left ventricle, and reduction of left ventricular preload. The cut-off values of RV/LV ratio associated with right heart dysfunction vary among published studies. The value of 0.9 was proposed when the ratio was measured on a reconstructed four-chamber view (31,33). On the other hand, values of 1.0–1.5 were used when the measurements were performed on standard axial view of the heart (9,12,17,24). In our study, a RV/LV ratio cut-off value of 1.0 was found to be predictive of short-term mortality. However, other previous studies failed to prove any association between mortality and increased RV/LV ratio (12,15,16). We postulate that the inconsistency noted in previous studies could be partially due to the difference in the RV/LV ratio measurements (eg, standard axial view of the heart vs reconstructed four-chamber view) and diversity of CT acquisition (different CT scanner geometry).
According to our results, flattening and bowing of interventricular septum to the left was associated with short-term mortality in the univariate analysis, as was in previous observations on an echocardiography study (34). However, two studies based on CT imaging findings reported that bowing of interventricular septum was inconsistent in predicting death associated with PE (12,17). Reflux of contrast medium into the IVC was recently described as a predictor of mortality in patients with PE (10). The univariate analysis in our study also revealed that reflux into the IVC was significantly associated with short-term mortality. However, it was not significant in the multivariable analysis. This observation is in agreement with that in a study that compared this sign in patients with severe versus nonsevere PE and reported no significant difference between the two groups (9). No significant association between the diameters of the superior vena cava and the azygos vein, presence of pulmonary infarcts, and short-term mortality was observed. However, another study noted a significant difference in the diameter of superior vena cava between patients with severe PE and patients with nonsevere PE (9). Two other studies reported that the mean diameter of the azygos vein and superior cava vena was higher in nonsurvivors than in survivors (10,11). Presence of pulmonary infarcts was not associated with mortality in two previous studies (10,17).
Our results demonstrated that semiquantitative scores of clot burden or clot volume were not significantly associated with the prediction of short-term mortality. According to the literature, two small studies reported strong correlations between semiquantitative scores of clot burden and short-term mortality (13,14), whereas a greater number of studies failed to show a significant correlation between the Qanadli score and short-term mortality (10–12,15,18) or between the Mastora score and short-term mortality (10). According to our results, blood clot volume does not appear to increase the risk of short-term mortality, which is in agreement with findings of a recent study (20). Nakada et al (20) measured PE volume in 48 patients by manually defining clot contours on CT pulmonary angiographic images and demonstrated that clot volume was not significantly different between survivors and deceased patients. In addition to clot burden, there may be a number of factors affecting cardiovascular response to PE. For example, the release of a vasoconstrictor, such as serotonin, appears to play an important role in determining pulmonary vasoconstriction (ie, reflex vasoconstriction) (35). Furthermore, changes in lung perfusion may not be directly reflected by clot volume; morphology of the clot may play an important role. Finally, the lack of association between clot burden and short-term mortality may in part be due to the low clot burden observed in our study population; there was a median of two clots per patients, and the median obstruction scores were relatively low (Qanadli, 12.5%; Mastora, 5.2%). This reflects the inclusion of consecutive patients with acute PE diagnosed at CT pulmonary angiographic imaging without specific predilection to severity of disease and patient’s cardiopulmonary status.
In the literature, few studies address the role of CT pulmonary angiographic parameters for helping predict intermediate and long-term prognosis in patients with PE (14,17,25,36). Further study with a longer clinical follow-up to examine the significance of clot burden on long-term prognosis of PE will be required.
Besides the retrospective design, we acknowledge certain limitations to our study. First, we evaluated cardiorespiratory reserve on the basis of history of comorbidities because laboratory values were not available at the time of data collection. Second, all measurements were performed in consensus; no information about interreader variability is, therefore, available. However, a recent study showed that the clot volume measurement was highly accurate and reliable with small interreader variability (19). Third, the cardiac measures may be compromised because the scanning was performed without electrocardiographic gating and the measurements were acquired by using only the axial images. An electrocardiographically gated CT scan is not routinely obtained at our hospital for the evaluation of PE because of the technical complexity involved, as well as the potential increase in patient’s radiation exposure with that type of scanning. Therefore, it is difficult to justify the incremental resulting benefit over a routine non- electrocardiographically gated CT pulmonary angiographic acquisition (37). Furthermore, a recent study reported cardiac measurements obtained on axial images were comparable with those obtained on four-chamber view reconstructed images (38).
In conclusion, in patients with acute PE, clot volume strongly correlated with semiquantitative CT scores of clot burden. Clot volume was larger in patients with right heart dilatation than those without right heart dilatation, and this difference was more pronounced in the subgroup of patients who had normal cardiorespiratory reserve. In addition, in patients with acute PE, right heart dilatation was associated with higher risk for short-term mortality along with history of congestive heart failure and cancer. Other CT signs of right heart dysfunction and measures of clot burden did not show statistically significant association with short-term mortality.
Advances in Knowledge.
• On CT pulmonary angiographic images of patients with acute pulmonary embolism (PE), increase in the ratio of right ventricle diameter to left ventricle diameter (RV/LV ratio) was independently associated (odds ratio, 12.27; P <.001) with short-term (30-day) mortality, with a cut-off value of 1.0.
• Clot volume measurement on CT pulmonary angiographic images is larger (median, 8371.8 mm3) in patients with right heart dilatation (RV/LV ratio $ 1.0) than in patients with RV/LV ratio of less than 1.0 (median volume, 638.4 mm3; P <.001).
• Among patients with acute PE and right heart dilatation, the clot volume is significantly lower in patients with underlying impaired cardiac reserve (P = .048) and in those with underlying impaired cardiac and respiratory reserve (P = .003).
• Measures of clot burden at CT pulmonary angiography, including semiquantitative scores (P >.659) and direct quantification of blood clot volume (P = .750), were not associated with short-term mortality in our patient sample.
Implication for Patient Care.
• Among patients with acute PE, those with history of congestive heart failure and cancer and with RV/LV ratio greater than 1.0 at CT pulmonary angiography are at increased risk of short-term mortality.
Disclosures of Relevant Conflicts of Interest: A.F. Financial activities related to the present article: none to disclose. Financial activities not related to the present article: institution has RSNA fellow grant RF1108 pending. Other relationships: none to disclose. A.A. No relevant conflicts of interest to disclose. C.C.H.C. No relevant conflicts of interest to disclose. A.P. No relevant conflicts of interest to disclose. K.N.J. No relevant conflicts of interest to disclose. B.P. No relevant conflicts of interest to disclose. D.T.F. Financial activities related to the present article: none to disclose. Financial activities not related to the present article: author received graduate medical resident salary from University of Pittsburgh Medical Center, institution has NIH STTR PAR-09-221 grant. Other relationships: unpaid medical imaging consultant for KitWare for development of open-source imaging software. Area of interest deals with registration algorithms for detection of lung nodules and not for the evaluation of pulmonary embolism. M.S. No relevant conflicts of interest to disclose. M.S.R. Financial activities related to the present article: none to disclose. Financial activities not related to the present article: institution received NIH R01 grant. Other relationships: none to disclose. K.T.B. Financial activities related to the present article: none to disclose. Financial activities not related to the present article: author received consultancy fees from Bracco, Covidien, and Otsuka; has patents pending from Covidien and Medrad; and received royalties from Covidien. Other relationships: none to disclose.
Supplementary Material
Received April 19, 2011; revision requested June 9; revision received January 31, 2012; accepted March 19; final version accepted May 18.
Funding: This research was supported by the National Institutes of Health (grant HL095115).
Abbreviations:
- IVC
- inferior vena cava
- PA/Ao
- ratio of main pulmonary artery diameter to ascending aorta diameter
- PE
- pulmonary embolism
- RV/LV
- ratio of right ventricle diameter to left ventricle diameter
References
- 1.Torbicki A, Perrier A, Konstantinides S, et al. Guidelines on the diagnosis and management of acute pulmonary embolism: the Task Force for the Diagnosis and Management of Acute Pulmonary Embolism of the European Society of Cardiology (ESC). Eur Heart J 2008;29(18):2276–2315 [DOI] [PubMed] [Google Scholar]
- 2.Jaff MR, McMurtry MS, Archer SL, et al. Management of massive and submassive pulmonary embolism, iliofemoral deep vein thrombosis, and chronic thromboembolic pulmonary hypertension: a scientific statement from the American Heart Association. Circulation 2011;123(16):1788–1830 [DOI] [PubMed] [Google Scholar]
- 3.Masotti L, Righini M, Vuilleumier N, et al. Prognostic stratification of acute pulmonary embolism: focus on clinical aspects, imaging, and biomarkers. Vasc Health Risk Manag 2009;5(4):567–575 [DOI] [PMC free article] [PubMed] [Google Scholar]
- 4.Aujesky D, Obrosky DS, Stone RA, et al. Derivation and validation of a prognostic model for pulmonary embolism. Am J Respir Crit Care Med 2005;172(8):1041–1046 [DOI] [PMC free article] [PubMed] [Google Scholar]
- 5.Remy-Jardin M, Pistolesi M, Goodman LR, et al. Management of suspected acute pulmonary embolism in the era of CT angiography: a statement from the Fleischner Society. Radiology 2007;245(2):315–329 [DOI] [PubMed] [Google Scholar]
- 6.Qanadli SD, El Hajjam M, Vieillard-Baron A, et al. New CT index to quantify arterial obstruction in pulmonary embolism: comparison with angiographic index and echocardiography. AJR Am J Roentgenol 2001;176(6):1415–1420 [DOI] [PubMed] [Google Scholar]
- 7.Mastora I, Remy-Jardin M, Masson P, et al. Severity of acute pulmonary embolism: evaluation of a new spiral CT angiographic score in correlation with echocardiographic data. Eur Radiol 2003;13(1):29–35 [DOI] [PubMed] [Google Scholar]
- 8.Bankier AA, Janata K, Fleischmann D, et al. Severity assessment of acute pulmonary embolism with spiral CT: evaluation of two modified angiographic scores and comparison with clinical data. J Thorac Imaging 1997;12(2):150–158 [DOI] [PubMed] [Google Scholar]
- 9.Collomb D, Paramelle PJ, Calaque O, et al. Severity assessment of acute pulmonary embolism: evaluation using helical CT. Eur Radiol 2003;13(7):1508–1514 [DOI] [PubMed] [Google Scholar]
- 10.Ghaye B, Ghuysen A, Willems V, et al. Severe pulmonary embolism:pulmonary artery clot load scores and cardiovascular parameters as predictors of mortality. Radiology 2006;239(3):884–891 [DOI] [PubMed] [Google Scholar]
- 11.Ghuysen A, Ghaye B, Willems V, et al. Computed tomographic pulmonary angiography and prognostic significance in patients with acute pulmonary embolism. Thorax 2005;60(11):956–961 [DOI] [PMC free article] [PubMed] [Google Scholar]
- 12.Araoz PA, Gotway MB, Harrington JR, Harmsen WS, Mandrekar JN. Pulmonary embolism: prognostic CT findings. Radiology 2007;242(3):889–897 [DOI] [PubMed] [Google Scholar]
- 13.Wu AS, Pezzullo JA, Cronan JJ, Hou DD, Mayo-Smith WW. CT pulmonary angiography: quantification of pulmonary embolus as a predictor of patient outcome—initial experience. Radiology 2004;230(3):831–835 [DOI] [PubMed] [Google Scholar]
- 14.Engelke C, Rummeny EJ, Marten K. Acute pulmonary embolism on MDCT of the chest: prediction of cor pulmonale and short-term patient survival from morphologic embolus burden. AJR Am J Roentgenol 2006;186(5):1265–1271 [DOI] [PubMed] [Google Scholar]
- 15.Araoz PA, Gotway MB, Trowbridge RL, et al. Helical CT pulmonary angiography predictors of in-hospital morbidity and mortality in patients with acute pulmonary embolism. J Thorac Imaging 2003;18(4):207–216 [DOI] [PubMed] [Google Scholar]
- 16.Stein PD, Beemath A, Matta F, et al. Enlarged right ventricle without shock in acute pulmonary embolism: prognosis. Am J Med 2008;121(1):34–42 [DOI] [PMC free article] [PubMed] [Google Scholar]
- 17.Moroni AL, Bosson JL, Hohn N, Carpentier F, Pernod G, Ferretti GR. Non-severe pulmonary embolism: prognostic CT findings. Eur J Radiol 2011;79(3):452–458 [DOI] [PubMed] [Google Scholar]
- 18.Pech M, Wieners G, Dul P, et al. Computed tomography pulmonary embolism index for the assessment of survival in patients with pulmonary embolism. Eur Radiol 2007;17(8):1954–1959 [DOI] [PubMed] [Google Scholar]
- 19.Furlan A, Patil A, Park B, Chang CC, Roberts MS, Bae KT. Accuracy and reproducibility of blood clot burden quantification with pulmonary CT angiography. AJR Am J Roentgenol 2011;196(3):516–523 [DOI] [PubMed] [Google Scholar]
- 20.Nakada K, Okada T, Osada H, Honda N. Relation between pulmonary embolus volume quantified by multidetector computed tomography and clinical status and outcome for patients with acute pulmonary embolism. Jpn J Radiol 2010;28(1):34–42 [DOI] [PubMed] [Google Scholar]
- 21.Yount RV, Vries JK, Councill CD. The medical archival system: an information retrieval system based on distributed parallel processing. Inf Process Manag 1991;27(4):379–389 [Google Scholar]
- 22.Jones SE, Wittram C. The indeterminate CT pulmonary angiogram: imaging characteristics and patient clinical outcome. Radiology 2005;237(1):329–337 [DOI] [PubMed] [Google Scholar]
- 23.Bae KT, Mody GN, Balfe DM, et al. CT depiction of pulmonary emboli: display window settings. Radiology 2005;236(2):677–684 [DOI] [PubMed] [Google Scholar]
- 24.Reid JH, Murchison JT. Acute right ventricular dilatation: a new helical CT sign of massive pulmonary embolism. Clin Radiol 1998;53(9):694–698 [DOI] [PubMed] [Google Scholar]
- 25.van der Meer RW, Pattynama PM, van Strijen MJ, et al. Right ventricular dysfunction and pulmonary obstruction index at helical CT: prediction of clinical outcome during 3-month follow-up in patients with acute pulmonary embolism. Radiology 2005;235(3):798–803 [DOI] [PubMed] [Google Scholar]
- 26.Revel MP, Triki R, Chatellier G, et al. Is It possible to recognize pulmonary infarction on multisection CT images? Radiology 2007;244(3):875–882 [DOI] [PubMed] [Google Scholar]
- 27.Ghanima W, Abdelnoor M, Holmen LO, Nielssen BE, Sandset PM. The association between the proximal extension of the clot and the severity of pulmonary embolism (PE): a proposal for a new radiological score for PE. J Intern Med 2007;261(1):74–81 [DOI] [PubMed] [Google Scholar]
- 28.Breiman L, Friedman JH, Olshen RA, Stone CJ. Classification and regression trees. Boca Raton, Fla: Chapman & Hall/CRC, 1984 [Google Scholar]
- 29.McIntyre KM, Sasahara AA. The hemodynamic response to pulmonary embolism in patients without prior cardiopulmonary disease. Am J Cardiol 1971;28(3):288–294 [DOI] [PubMed] [Google Scholar]
- 30.McIntyre KM, Sasahara AA. Determinants of right ventricular function and hemodynamics after pulmonary embolism. Chest 1974;65(5):534–543 [DOI] [PubMed] [Google Scholar]
- 31.Schoepf UJ, Kucher N, Kipfmueller F, Quiroz R, Costello P, Goldhaber SZ. Right ventricular enlargement on chest computed tomography: a predictor of early death in acute pulmonary embolism. Circulation 2004;110(20):3276–3280 [DOI] [PubMed] [Google Scholar]
- 32.Wood KE. Major pulmonary embolism: review of a pathophysiologic approach to the golden hour of hemodynamically significant pulmonary embolism. Chest 2002;121(3):877–905 [DOI] [PubMed] [Google Scholar]
- 33.Quiroz R, Kucher N, Schoepf UJ, et al. Right ventricular enlargement on chest computed tomography: prognostic role in acute pulmonary embolism. Circulation 2004;109(20):2401–2404 [DOI] [PubMed] [Google Scholar]
- 34.Ribeiro A, Lindmarker P, Juhlin-Dannfelt A, Johnsson H, Jorfeldt L. Echocardiography Doppler in pulmonary embolism: right ventricular dysfunction as a predictor of mortality rate. Am Heart J 1997;134(3):479–487 [DOI] [PubMed] [Google Scholar]
- 35.Smulders YM. Pathophysiology and treatment of haemodynamic instability in acute pulmonary embolism: the pivotal role of pulmonary vasoconstriction. Cardiovasc Res 2000;48(1):23–33 [DOI] [PubMed] [Google Scholar]
- 36.Engelke C, Rummeny EJ, Marten K. Pulmonary embolism at multi-detector row CT of chest: one-year survival of treated and untreated patients. Radiology 2006;239(2):563–575 [DOI] [PubMed] [Google Scholar]
- 37.Lu MT, Cai T, Ersoy H, et al. Comparison of ECG-gated versus non-gated CT ventricular measurements in thirty patients with acute pulmonary embolism. Int J Cardiovasc Imaging 2009;25(1):101–107 [DOI] [PubMed] [Google Scholar]
- 38.Stein PD, Matta F, Yaekoub AY, et al. Reconstructed 4-chamber views compared with axial imaging for assessment of right ventricular enlargement on CT pulmonary angiograms. J Thromb Thrombolysis 2009;28(3):342–347 [DOI] [PubMed] [Google Scholar]
Associated Data
This section collects any data citations, data availability statements, or supplementary materials included in this article.


