

Multipeak modeling of fat improves the agreement between R2* and liver iron and single-peak modeling of fat leads to underestimation of liver fat compared with multipeak fat spectral modeling.
Abstract
Purpose:
To investigate the effect of the multipeak spectral modeling of fat on R2* values as measures of liver iron and on the quantification of liver fat fraction, with biopsy as the reference standard.
Materials and Methods:
Institutional review board approval and informed consent were obtained. Patients with liver disease (n = 95; 50 men, 45 women; mean age, 57.2 years ± 14.1 [standard deviation]) underwent a nontargeted liver biopsy, and 97 biopsy samples were reviewed for steatosis and iron grades. MR imaging at 1.5 T was performed 24–72 hours after biopsy by using a three-echo three-dimensional gradient-echo sequence for water and fat separation. Data were reconstructed off-line, correcting for T1 and T2* effects. Fat fraction and R2* maps (1/T2*) were reconstructed and differences in R2* and steatosis grades with and without multipeak modeling of fat were tested by using the Kruskal-Wallis test. Spearman rank correlation coefficient was used to assess fat fractions and steatosis grades. Linear regression analysis was performed to compare the fat fraction for both models.
Results:
Mean steatosis grade at biopsy ranged from 0% to 95%. Biopsy specimens in 26 of 97 patients (27%) showed liver iron (15 mild, six moderate, and five severe). In all 71 samples without iron, a strong increase in the apparent R2* was observed with increasing steatosis grade when single-peak modeling of fat was used (P = .001). When multipeak modeling was used, there were no differences in the apparent R2* as a function of steatosis grading (P = .645), and R2* values agreed closely with those reported in the literature. Good correlation between fat fraction and steatosis grade was observed (rS= 0.85) both without and with spectral modeling.
Conclusion:
In the presence of fat, multipeak spectral modeling of fat improves the agreement between R2* and liver iron. Single-peak modeling of fat leads to underestimation of liver fat.
© RSNA, 2012
Supplemental material: http://radiology.rsna.org/lookup/suppl/doi:10.1148/radiol.12112520/-/DC1
Introduction
Nonalcoholic fatty liver disease (NAFLD) and chronic liver iron overload are the most common metabolic causes of chronic liver disease (1). NAFLD is a spectrum of diseases including isolated steatosis, steatohepatitis, cirrhosis, liver failure, and hepatocellular carcinoma. NAFLD is a feature of metabolic syndrome, which includes obesity, type 2 diabetes, and cardiovascular disease (2–4). Liver iron overload, which results from hereditary hemochromatosis, multiple transfusions, hereditary anemia (eg, thalassemia), and chronic liver disease, has the potential to accelerate liver damage that can lead to cirrhosis and hepatocellular carcinoma (5). In addition, up to 40% of patients with NAFLD have concomitant iron overload (6–9). A strong association between iron and aggressive NAFLD has been shown (7,8), and in hemochromatosis, the severity of disease progression worsens in patients with steatosis (10).
Liver core biopsy with histologic analysis is the most widely accepted reference standard for assessment of liver fat and iron. Unfortunately, liver core biopsy is expensive and invasive. Although the risk of complications is low, hospitalization after biopsy is necessary in 1%–3% of cases, and death occurs in 1 in 10 000–12 000 patients (11,12). Furthermore, liver core biopsy has a high sampling variability, which limits its utility for quantitative assessment of diffuse liver disease because regional heterogeneity may occur (13,14). Indeed, both steatosis and iron deposition are well known to be geographically heterogeneous. For these reasons, noninvasive imaging techniques that allow visualization of the entire liver are desirable for measurement of liver fat and iron. The presence of liver fat can be detected noninvasively with ultrasonography (US) (15,16) or computed tomography (CT) (17), but both imaging modalities have limited accuracy. Furthermore, liver iron overload cannot be quantified reliably by using US or CT, although severe iron overload can be detected by using CT (18).
Noninvasive magnetic resonance (MR) imaging techniques such as MR spectroscopy and chemical shift encoded MR imaging with water and fat separation can provide reliable quantification of liver fat (18–22). However, to obtain accurate liver fat fraction measurements, MR imaging techniques must account for several confounding factors, including T2* and T1 relaxation effects, noise bias, and spectral modeling of fat (23–27).
T2* decay can affect fat quantification, particularly in tissues with short T2* (eg, in the presence of iron). Currently, correction for T2* relaxation effects has the advantage of providing an R2* map as a byproduct of fat quantification, because R2* is equal to 1/T2*. Although it is necessary for accurate fat quantification, the R2* map is of clinical interest because the correlation between R2* and liver iron has been well established both theoretically (28) and clinically (29,30).
T1 effects can introduce errors in fat quantification when gradient-echo pulse sequences are used (24). T1 effects can be avoided by using small flip angles, or they can be corrected by means of postprocessing (31).
Another source of systematic error in fat quantification by using chemical shift techniques is the spectral complexity of the fat signal (containing multiple peaks in the 1H MR spectrum). When chemical-shift MR imaging methods that do not include multipeak fat spectral modeling are used, only the single methylene fat peak at a frequency shift of −3.3 ppm (−217 Hz at 1.5 T) relative to the water signal is considered. However, fat contains multiple 1H peaks from the various chemical moieties of triglycerides. Spectral modeling including multiple fat peaks is well established as necessary for accurate quantification of the proton density fat fraction with MR imaging (19–21,25,27,32,33).
Various investigators have reported differences in apparent R2* maps in fatty tissue (eg, visceral and subcutaneous fat) when multipeak spectral modeling of fat was (25) and was not (34) used in their studies. However, the influence of the multipeak spectral model in the assessment of liver R2* values for iron quantification has not been rigorously evaluated.
The purpose of this study was to investigate the effect of multipeak spectral modeling of fat in the estimation of R2* values as a measure of liver iron and in the quantification of liver fat fraction by using biopsy as the reference standard.
Materials and Methods
S.K. is an employee of Siemens Healthcare (Erlangen, Germany). He had no control of inclusion of data and information. He was not involved in the data acquisition and data analyses.
This prospective study was approved by the institutional review board of the University Hospital, Greifswald, Germany. Written informed consent was obtained separately for liver biopsy and postinterventional MR imaging.
Patients and Liver Core Biopsy
Between January 2009 and September 2010, a total of 97 patients underwent clinically indicated liver biopsy and postinterventional liver MR imaging including a study sequence for liver fat quantification. Inclusion criteria were patient age of 18 years or older and a clear clinical indication for the liver core biopsy, and consent to participate in this study. Exclusion criteria included contraindications to MR imaging, such as metallic implants, pacing devices, or claustrophobia. No patients were excluded from the study for these reasons (n = 0). In two patients, two independent biopsies were performed at the same biopsy setting at two different locations in areas of focal steatosis. A total of 99 independent biopsy specimens in 97 patients were obtained; however, data from two patients were not included because raw MR imaging data were not stored for these patients.
Therefore, a total of 97 biopsy specimens from 95 patients (50 men, mean age ± standard deviation, 56.1 years ± 14.6; 45 women, mean age 58.4 years ± 13.6) with complete MR imaging data sets were available for data analysis. Fifty-one patients had elevated liver enzyme levels, and 44 patients were suspected of having malignant liver tumors. Per institutional guidelines, patients suspected of having liver tumors underwent two biopsies. One biopsy was obtained in the liver lesion, and the second, nontargeted biopsy was obtained from liver parenchyma that was remote from any focal liver lesions to evaluate for diffuse liver disease. Image- guided liver biopsy was performed by using 16- to 18-gauge biopsy systems (Bard Peripheral Vascular, Tempe, Ariz; Somatex Medical Technologies GmbH, Teltow, Germany) while the patients were under conscious sedation.
A total of 97 core samples obtained from liver parenchyma (remote from focal lesions) were included in this study. The Couinaud segment from which the image-guided biopsy was obtained was recorded. Patients with a parenchymal hemorrhage detected at MR imaging (defined as circumscribed hyperintense signal intensity in the study sequence) were to be excluded; however, no post-interventional parenchymal hemorrhage was observed.
Histologic Assessment of Liver Core Biopsy
Two board-certified pathologists (M.E. and F.D., with 12 and 17 years of experience in liver pathology, respectively) reviewed the biopsy samples to evaluate for steatosis and iron. Both readers were blinded to the results from MR imaging. Liver steatosis (degree of hepatocellular fat content) was evaluated on a scale of 0%–100% (0%, no steatosis; 3%–5%, mild steatosis; and 5%–100% in steps of 5% for higher grades) by using hematoxylin-eosin stain. In cases of disagreement of more than 5% between pathologists, a consensus value was used. Steatosis was also graded on a four-point scale according to methods described by Brunt et al (35): grade 0 (none), less than 5% of hepatocytes affected; grade 1 (mild), 5%–33% of hepatocytes affected; grade 2 (moderate), 34%–66% of hepatocytes affected; and grade 3 (severe) 67% or more of the hepatocytes affected.
In addition, liver iron was evaluated by using Perl’s Prussian blue staining for all samples. According to local institutional practice, iron was subjectively graded by evaluating the relative number of hepatocytes containing iron granules as follows: grade 0 (no iron), less than 5% of hepatocytes affected but may contain a single intracytoplasmic iron granule; grade 1 (mild), 5%–20% of hepatocytes affected, usually contains a group of iron granules in a small portion of the cytoplasm; grade 2 (moderate), 21%–50% of hepatocytes affected, shows occasional diffuse cytoplasmic iron staining; grade 3 (severe), more than 50% of hepatocytes affected, shows either a diffuse cytoplasmic staining or large deep blue clusters of iron deposits.
MR Equipment and Study Sequences
All patients underwent abdominal MR imaging 24–72 hours after liver biopsy. MR imaging was performed by using a 1.5-T MR imaging system (Magnetom Avanto, software version VB15; Siemens Healthcare) with a 12-channel phased-array surface coil.
Three-dimensional gradient-echo data with three echoes and flyback readout gradient were acquired from an axial slab during a single 19-second breath hold. Imaging parameters included repetition time, 11 msec; echo times, 2.4, 4.8, and 9.6 msec; flip angle, 10°; number of signals acquired, one; bandwidth, ± 1065 hertz per pixel; matrix, 224 Χ 168 Χ 64; field of view, 410 Χ 308 mm; parallel imaging effective acceleration factor, 1.8; and section thickness, 3.0 mm.
Offline reconstructions of fat fraction (including correction for T1 bias and T2* decay) and R2* mapping were performed from magnitude images of the three-echo acquisition by using both single-peak and multipeak modeling of fat to compare the two models. Fat and water ambiguities were resolved by using the phase of the acquired data. Mathematical details on the reconstruction are provided in Appendix E1 (online).
MR Imaging Data Analysis
One radiologist (J.K., with more than 5 years of experience in liver imaging) reviewed the images, which consisted of two R2* maps (estimated by using single-peak and multipeak fat models) and two fat fraction maps (single-peak and multipeak fat; both with correction for T1 bias and T2* effects). The readers were unaware of histologic results but had knowledge of the Couinaud segment from which the biopsy was obtained. Mean fat fractions and R2* values were determined at operator-defined regions of interest of 1.5–2.0 cm2 placed at the known biopsy segment, by using Osirix (v3.8.1; Pixmec Sarl, Bernex, Switzerland). Care was taken when the regions of interest were placed to avoid blood vessels and regions that were obviously contaminated by partial volume effects and motion artifacts.
Statistical Analysis
Variables were described as means and standard deviations. The Kruskal-Wallis test was used to test for significant differences between R2* values and defined groups of histologic steatosis grade, and between R2* values and histologic iron grade according to the type of image reconstruction (single-peak or multipeak model).
To compare the image-based fat fraction and the histologically determined steatosis grade, Spearman rank correlation coefficients (rS) were calculated separately for single- and multi-peak data. Furthermore, a comparison of the MR imaging fat fractions determined by using single-peak and multipeak modeling of fat was performed by calibration to regress single-peak values on their multipeak counterparts. From these regressions the coefficient of determination (r2), slope, intercept, and standard errors were extracted. In addition, receiver operating characteristic analyses including a calculation of sensitivity, specificity, accuracy, and area under the curve (AUC) for each method (single vs multipeak) and each measured quantity (fat fraction and iron) were performed. Threshold values that provided a good balance of sensitivity and specificity of R2* and MR imaging–based fat fraction according to histologic results were defined. To enable computation of diagnostic accuracy measures, histologic grades were dichotomized as follows: 0 versus greater than 0; 0 versus 1; 1 versus 2; and 2 versus 3.
Results were considered to indicate a statistically significant difference when P values were less than .05. Analyses and plots were performed by using commercially available software (SPSS, release 14.0, Chicago, Ill; and R, release 2.12.1, R Development Core Team 2009, Vienna, Austria).
Results
The histologically determined steatosis grades for the 97 specimens ranged from 0% to 95%, with 46 (47%) grade 0, 38 (39%) grade 1, seven (7%) grade 2, and six (6%) grade 3. In the 97 specimens, increased liver iron was observed in 26 (27%), including 15 (15%) with grade 1 iron overload, six (6%) with grade 2, and five (5%) with grade 3. Seventy-one of 97 samples (73%) had no increased iron identified at histologic examination (grade 0).
Examples of R2* maps in two patients without iron detected on histologic examination, which were generated by using single-peak and multipeak models are shown in Figure 1. Results of the R2* measurements in the patients with no iron detected at histologic examination and their relationship to steatosis grade from histologic examination are shown in Figure 2. When single-peak modeling of fat was used, there was a progressive and marked increase in the mean apparent R2* as the steatosis grade increased (grade 0, 31.3 sec−1 ± 5.1; grade 1, 37.1 sec−1 ± 5.9; grade 2, 45.9 sec−1± 5.3; grade 3, 63.± sec−1 ± 17.0) (P <.001). However, when multipeak modeling of fat was used, there was no dependence of the R2* measurements on steatosis grade (grade 0, 29.4 sec−1 ± 5.1; grade 1, 31.1 sec−1 ± 5.5; grade 2, 30.9 sec−1 ± 3.7; grade 3, 29.6 sec−1 ± 5.2) (P = .645). The average R2* values measured in those patients without iron on biopsy were 37.0 sec−1 ± 10.9 by using single-peak modeling and 30.1 sec−1 ± 5.1 by using multipeak modeling of fat.
Figure 1:

Two women, aged 56 (top row, patient A) and 72 (bottom row, patient B) years with increased liver enzymes who underwent nontargeted liver biopsy. In both patients, histologic results showed no liver iron overload, but steatosis grade was 3% in patient A and 80% in patient B. R2* maps were calculated by using single-peak (left column) and multipeak (right column) modeling of fat. Patient A showed no changes in apparent R2* values because she had little liver fat. Patient B had elevated liver fat and apparent R2* increase, which could lead to the incorrect conclusion that patient B had iron overload. With multipeak modeling of fat, apparent R2* values of both patients returned to more reasonable values. Note high apparent R2* in subcutaneous tissue of both patients in single-peak modeling images.
Figure 2:

Box and whisker plots of apparent R2* values measured in 71 patients without liver iron overload by using A, single-peak and, B, multipeak modeling of fat. Marked increase in apparent R2* is shown, with increasing steatosis grade when single-peak modeling of fat was used (P ≤ .001). With multipeak modeling of fat, no differences in R2* values were observed with increasing steatosis grade (P = .645).
For all 97 samples, the corresponding R2* maps (single-peak and multipeak modeling) were compared with histologic iron grades. Examples are shown in Figure 3. As is shown in Figure 4, R2* values measured by using both single-peak reconstruction and multipeak reconstruction showed significant increases in histologic iron grade (P = .001). In comparison with single-peak reconstruction, however, the use of a multipeak reconstruction model led to fewer outliers in groups 0 and 1. These outliers corresponded to patients with high steatosis grades. One of the outliers (steatosis grade 3) is shown in Figure 1.
Figure 3:

R2* maps (left) estimated by using multipeak modeling of fat in four patients with different grades of liver iron overload and corresponding images at histologic examination (right) obtained by using Perl’s Prussian blue stain (magnification, ×400). Excellent correlation between R2* values and histologic iron grades was observed.
Figure 4:

Box and whisker plots of apparent R2* measured in all 97 biopsy samples compared with histologic iron grading, for, A, single-peak and, B, multipeak modeling of fat. Results show excellent correlation with iron grading. However, there were several outliers when single-peak modeling of fat was used. In most cases, outliers were caused by erroneous R2* measurements in the presence of high liver fat: patients 1 (95% fat), 2 (85% fat), 3 (80% fat [shown in Figure 1b]), and 4 (80% fat). Range of R2* values was different between the two reconstructions (particularly for iron groups 1 and 2) and was caused by overestimation of R2* in patients with high liver fat when single-peak modeling of fat was used.
On the basis of histologic iron grading, threshold R2* values were generated (Table 1). These results showed improved specificity, accuracy, and AUC (receiver operating characteristic analysis) for liver iron quantification by using multipeak reconstruction in the presence of liver fat. The improvement in AUC when multipeak reconstruction was used was statistically significant for distinguishing iron grade 0 from iron grades 1–3.
Table 1.
MR Imaging R2* Values Compared with Histologically Determined Iron Grades
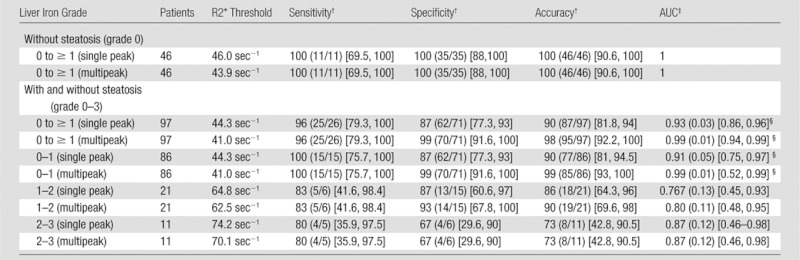
Note.—After exclusion of all patients with steatosis grades of 1 or more (first rows), there were no significant differences of AUC, and excellent sensitivity, specificity, accuracy were observed when single-peak and multipeak reconstruction were used for histologically determined iron grade 0 to ≥ 1. In comparison, there was a significant difference in AUC for single-peak reconstruction if samples with fat were included (P = .005). Iron quantification with R2* mapping is confounded by the presence of fat when single-peak reconstruction is used. Threshold values for different histologic iron grades are defined in the third column.
Data are percentages, with numerator and denominator in parentheses and 95% confidence interval in brackets.
Data in parentheses are standard error, with 95% confidence interval in brackets.
Indicates a statistically significant difference, P <.05.
Figure 5, A, shows the apparent fat fraction measured by using both single- and multipeak modeling of fat plotted against the histologic steatosis grade from all 97 biopsy samples. For both methods, excellent correlation was observed compared with histologic results when regressed to an exponential curve. Good correlation was observed for both groups (Spearman correlation coefficients of rS = 0.848 for single-peak model and rS = 0.849 for a multipeak model).
Figure 5:

Scatterplot A shows fat fraction calculated by using single-peak (red circles) and multipeak (black circles) modeling of fat plotted against steatosis grades from biopsy specimens. Excellent correlation is seen between both reconstruction methods and histologic results when an exponential function is used. In scatterplot B, direct comparision of fat fraction measured by using single- and multipeak reconstruction shows excellent correlation (r2 = 0.999). Disagreement is shown between the two methods with a slope and intercept that are statistically different from 1.0 (P ≤ .001) and not statistically different from 0.0 (P = .104), respectively.
Figure 5, B, plots fat fractions measured by using single-peak modeling compared with multipeak modeling. Excellent correlation (r2 = 0.999) between the two models was observed. However, there was disagreement between the two methods evidenced by a slope (± standard deviation) of 0.89 ± 0.001 (P <.001) and an intercept of −0.03% ± 0.018 (P = .104). The slope was statistically different from 1.0 (P <.001), although the intercept was not statistically different from 0.0 (P = .104). Overall, this indicates statistical disagreement between the fat fraction measurements obtained by using the two models of fat signal.
On the basis of histologic steatosis grading, threshold values for fat fraction were generated (Table 2). Compared with histologic results, different calibrations with different threshold fat fraction values were observed for each model. However, because of this linear relationship between fat fraction measured with single-peak and multipeak models, the sensitivity, specificity, accuracy, and AUC were the same in all steatosis grades.
Table 2.
Fat Fraction Thresholds Compared with Histologically Determined Liver Fat Grades
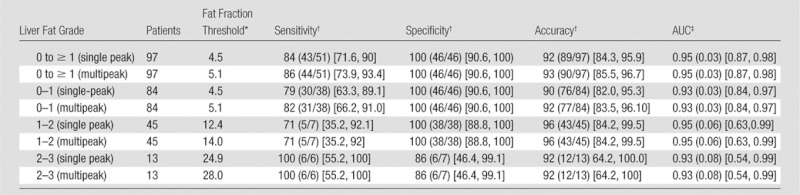
Note.—No differences in sensitivity, specificity, accuracy, and AUC in liver fat quantification were observed when single-peak and multipeak reconstruction were used. However, the thresholds of the MR imaging fat fraction were different between the models. Threshold MR imaging fat fraction values for different steatosis grades measured with single-peak reconstruction are only valid for the particular protocol and device used in this study.
Data are percentages.
Data are percentages, with numerator and denominator in parentheses and 95% confidence interval in brackets.
Data in parentheses are standard error, with 95% confidence interval in brackets.
Discussion
In our study, we have investigated the effect of multipeak spectral modeling of fat on the quantification of liver R2* values as a measure of liver iron overload and of liver fat fraction in combination with three-echo three-dimentional gradient-echo acquisition. Our data show that, unless it is accounted for in the signal model, the spectral complexity of the fat signal introduces errors in R2* measurement because the multiple peaks introduce additional modulations in the measured signal that manifest as erroneous increases in the apparent R2*. Errors in R2* occured even when in-phase echo times (as performed in our study) were used because only the main methylene fat peak was in phase with water at those times, but the remaining fat peaks had accrued additional phases with respect to water and methylene protons. In other words, the only true “in-phase” echo time occured when echo time was 0 msec for gradient-echo imaging. For these reasons, the use of single-peak modeling results in errors in R2* quantification in the presence of high fat concentration.
When multipeak modeling was used, there was no dependence on the apparent R2* with steatosis grading, and the observed values of R2* agreed with expected values of R2* from the literature (36). These observations indicate that multipeak modeling of fat results in improved agreement between R2* and liver iron, particularly when fat is present.
Liver iron overload introduces microscopic magnetic field inhomogeneities and can be indirectly detected by using MR imaging (18). One accepted method for quantifying the liver iron concentration is R2* relaxometry, which was used in this study. Compared with other MR-based iron quantification techniques, such as signal-intensity ratio based on T2* or T2 weighted imaging (37–39) or R2 relaxometry based on T2 weighted imaging (40–42) R2* relaxometry is more sensitive to iron effects throughout the entire diagnostic range of liver iron concentration and can be acquired in a single breath hold (43,44).
Our results confirmed that fat confounds the ability of gradient-echo methods to quantify R2* when conventional multiecho imaging methods are used. Our work also demonstrated how the effects of fat on R2* measurements can be mitigated by using multipeak spectral modeling of the fat signal. Thus, it is important to use the multipeak fat model to obtain fat-independent R2* values and accurate iron quantification.
Previous studies that used chemical shift–based methods with T2* correction and multipeak spectral modeling showed excellent agreement with spectroscopy for quantification of liver fat (19–21). These studies demonstrated that, when multipeak spectral modeling of fat was used, MR imaging could accurately measure the proton density fat fraction. The proton density fat fraction is a fundamental property of tissue, and is defined as the ratio of unconfounded fat signal and the sum of unconfounded water and fat signal. For a protocol to be independent of both the platform and imaging parameters (ie, robust) it is essential to correct for all known confounding factors, such as T2*, T1, and the spectral complexity of fat. If all confounding factors are not addressed, apparent fat fraction may depend on imaging parameters such as the number of echoes, echo spacing, repetition time.
Our study results demonstrated excellent correlation between apparent fat fraction measured with MR imaging and biopsy results by using both the single-peak and multipeak models. Furthermore, we demonstrated excellent correlation between apparent fat fractions measured by using both fat models (r2 = 0.999). However, we also demonstrated statistically significant disagreement between the two reconstruction methods. For this reason, we must conclude that at least one (or both) of the measurements (single-peak-or multipeak model) does not accurately measure proton density fat fraction. Given previous validation of multipeak spectral modeling to measure proton density fat fraction, and also the need for multipeak modeling of fat for R2* quantification in this work, we concluded indirectly that fat fraction measurements made without multipeak modeling of fat do not accurately measure the proton density fat fraction. The calibration between fat fraction and steatosis grade and the generated threshold values for MR imaging fat fraction and steatosis grades measured with single-peak reconstruction are only valid for the particular protocol used in this study. Furthermore, we expect, although have not shown rigorously, that the calibration curve measured by using multipeak spectral modeling should be robust (ie, independent of imaging parameters and broadly applicable). Further studies are needed to investigate the robustness of these methods with changes in imaging parameters.
This study had several limitations. First, our study population had a limited number of patients with both elevated fat and iron. A second limitation of this study was the use of biopsy results as the reference standard for liver fat quantification, given the known sampling variability of biopsy. Third, in this study we calculated R2* values from a multiecho sequence by using only three echoes. R2* quantification may be more accurately performed by using a gradient-echo sequence with more than three echoes. Fourth, the thresholds for R2* presented in Tables 1 and2 depended on how histologic grades were dichotomized; as a consequence, they may have been based on small samples, and would require further validation before they can be considered sufficiently robust for clinical use.
In conclusion, large systematic errors in R2* estimation with the potential for misdiagnosis of iron overload can occur if the spectral complexity of the fat signal is not considered, even when using in-phase echoes. Thus, multipeak modeling of fat improves the agreement between R2* and liver iron in the presence of liver fat. Furthermore, single-peak modeling of fat leads to underestimation of liver fat relative to multipeak fat spectral modeling. By using multipeak modeling of fat, it is possible to perform simultaneous quantification of liver fat concentration and liver iron concentration throughout the entire liver from only three echoes in a single breath hold.
Advances in Knowledge.
• In the presence of liver fat, R2* values will be estimated incorrectly by using chemical shift encoded MR imaging unless multipeak spectral modeling of fat is used and results in significant differences in R2* values in patients without liver iron (P = .001).
• In patients with fatty liver, the fat fraction is systematically underestimated when the single-peak model is used, compared with the use of the multipeak fat model (slope = 0.89 ± 0.001, P <.001; intercept = −0.03 ± 0.018, P = .104); however, both approaches correlate closely with biopsy results, with a Spearman correlation coefficient for both of 0.85.
• Correcting for the spectral complexity of the fat signal (multi-peak modeling of fat) removes both errors in R2* estimation and the underestimation of fat fraction.
Implications for Patient Care.
• Multipeak fat spectral modeling is necessary for reliable liver fat and iron quantification in patients with liver fat.
• It is possible to quantify liver steatosis and liver iron overload in one breath hold by using three-echo chemical shift encoded MR imaging and multipeak fat spectral modeling.
Disclosures of Potential Conflicts of Interest: J.P.K. No potential conflicts of interest to disclose. D.H. No potential conflicts of interest to disclose. A.M.d.R. Financial activities related to the present article: none to disclose. Financial activities not related to the present article: Received payment for consultancy from Lippincott, Williams and Wilkins for statistical review. Other relationships: none to disclose. M.E. Financial activities related to the present article: Received grant from Deutsche Forschungsgemeinsch aft. Financial activities not related to the present article: none to disclose. Other relationships: none to disclose. S.K. Financial activities related to the present article: none to disclose. Financial activities not related to the present article: Author employed by and owns stock in Siemens. Other relationships: none to disclose. H.V. Financial activities related to the present article: Institution received grant from Siemens. Financial activities not related to the present article: none to disclose. Other relationships: none to disclose. B.M. No potential conflicts of interest to disclose. R.P. No potential conflicts of interest to disclose. N.H. No potential conflicts of interest to disclose. S.B.R. Financial activities related to the present article: none to disclose. Financial activities not related to the present article: none to disclose. Other relationships: none to disclose.
Supplementary Material
Acknowledgments
We acknowledge contribution to this work by Julia Mayerle, Markus M. Lerch, Frank Dombrowski, and further Wesley Gilson as primary developer of WIP #432.
Received November 30, 2011; revision requested January 24, 2012; revision received March 21; accepted April 3; final version accepted April 27.
Supported by the Coulter Foundation and the WARF Accelerator program.
Funding: This research was supported by the National Institutes of Health (grants R01 DK083380, R01 DK088925, and RC1 EB010384).
Abbreviations:
- AUC
- area under the curve
- NAFLD
- nonalcoholic fatty liver disease
References
- 1.Bosserhoff A, Hellerbrand C. Obesity and fatty liver are ‘grease’ for the machinery of hepatic fibrosis. Dig Dis 2011;29(4):377–383 [DOI] [PubMed] [Google Scholar]
- 2.Ekstedt M, Franzén LE, Mathiesen UL, et al. Long-term follow-up of patients with NAFLD and elevated liver enzymes. Hepatology 2006;44(4):865–873 [DOI] [PubMed] [Google Scholar]
- 3.Schindhelm RK, Diamant M, Heine RJ. Nonalcoholic fatty liver disease and cardiovascular disease risk. Curr Diab Rep 2007;7(3):181–187 [DOI] [PubMed] [Google Scholar]
- 4.Scorletti E, Calder PC, Byrne CD. Non-alcoholic fatty liver disease and cardiovascular risk: metabolic aspects and novel treatments. Endocrine 2011;40(3):332–343 [DOI] [PubMed] [Google Scholar]
- 5.Kew MC. Hepatic iron overload and hepatocellular carcinoma. Cancer Lett 2009;286(1):38–43 [DOI] [PubMed] [Google Scholar]
- 6.Dongiovanni P, Fracanzani AL, Fargion S, Valenti L. Iron in fatty liver and in the metabolic syndrome: a promising therapeutic target. J Hepatol 2011;55(4):920–932 [DOI] [PubMed] [Google Scholar]
- 7.Bonkovsky HL, Jawaid Q, Tortorelli K, et al. Non-alcoholic steatohepatitis and iron: increased prevalence of mutations of the HFE gene in non-alcoholic steatohepatitis. J Hepatol 1999;31(3):421–429 [DOI] [PubMed] [Google Scholar]
- 8.George DK, Goldwurm S, MacDonald GA, et al. Increased hepatic iron concentration in nonalcoholic steatohepatitis is associated with increased fibrosis. Gastroenterology 1998;114(2):311–318 [DOI] [PubMed] [Google Scholar]
- 9.Moirand R, Mortaji AM, Loréal O, Paillard F, Brissot P, Deugnier Y. A new syndrome of liver iron overload with normal transferrin saturation. Lancet 1997;349(9045):95–97 [DOI] [PubMed] [Google Scholar]
- 10.Powell EE, Ali A, Clouston AD, et al. Steatosis is a cofactor in liver injury in hemochromatosis. Gastroenterology 2005;129(6):1937–1943 [DOI] [PubMed] [Google Scholar]
- 11.Bravo AA, Sheth SG, Chopra S. Liver biopsy. N Engl J Med 2001;344(7):495–500 [DOI] [PubMed] [Google Scholar]
- 12.Copel L, Sosna J, Kruskal JB, Kane RA. Ultrasound-guided percutaneous liver biopsy: indications, risks, and technique. Surg Technol Int 2003;11:154–160 [PubMed] [Google Scholar]
- 13.Ratziu V, Charlotte F, Heurtier A, et al. Sampling variability of liver biopsy in nonalcoholic fatty liver disease. Gastroenterology 2005;128(7):1898–1906 [DOI] [PubMed] [Google Scholar]
- 14.Abdi W, Millan JC, Mezey E. Sampling variability on percutaneous liver biopsy. Arch Intern Med 1979;139(6):667–669 [PubMed] [Google Scholar]
- 15.Fishbein MH, Mogren C, Gleason T, Stevens WR. Relationship of hepatic steatosis to adipose tissue distribution in pediatric nonalcoholic fatty liver disease. J Pediatr Gastroenterol Nutr 2006;42(1):83–88 [PubMed] [Google Scholar]
- 16.Strauss S, Gavish E, Gottlieb P, Katsnelson L. Interobserver and intraobserver variability in the sonographic assessment of fatty liver. AJR Am J Roentgenol 2007;189(6):W320–W323 [DOI] [PubMed] [Google Scholar]
- 17.Park SH, Kim PN, Kim KW, et al. Macrovesicular hepatic steatosis in living liver donors: use of CT for quantitative and qualitative assessment. Radiology 2006;239(1):105–112 [DOI] [PubMed] [Google Scholar]
- 18.Sirlin CB, Reeder SB. Magnetic resonance imaging quantification of liver iron. Magn Reson Imaging Clin N Am 2010;18(3):359–381, ix. [DOI] [PMC free article] [PubMed] [Google Scholar]
- 19.Meisamy S, Hines CD, Hamilton G, et al. Quantification of hepatic steatosis with T1-independent, T2-corrected MR imaging with spectral modeling of fat: blinded comparison with MR spectroscopy. Radiology 2011;258(3):767–775 [DOI] [PMC free article] [PubMed] [Google Scholar]
- 20.Yokoo T, Shiehmorteza M, Hamilton G, et al. Estimation of hepatic proton-density fat fraction by using MR imaging at 3.0 T. Radiology 2011;258(3):749–759 [DOI] [PMC free article] [PubMed] [Google Scholar]
- 21.Yokoo T, Bydder M, Hamilton G, et al. Nonalcoholic fatty liver disease: diagnostic and fat-grading accuracy of low-flip-angle multiecho gradient-recalled-echo MR imaging at 1.5 T. Radiology 2009;251(1):67–76 [DOI] [PMC free article] [PubMed] [Google Scholar]
- 22.Reeder SB, Sirlin CB. Quantification of liver fat with magnetic resonance imaging. Magn Reson Imaging Clin N Am 2010;18(3):337–357, ix. [DOI] [PMC free article] [PubMed] [Google Scholar]
- 23.Hines CD, Yu H, Shimakawa A, et al. Quantification of hepatic steatosis with 3-T MR imaging: validation in ob/ob mice. Radiology 2010;254(1):119–128 [DOI] [PMC free article] [PubMed] [Google Scholar]
- 24.Liu CY, McKenzie CA, Yu H, Brittain JH, Reeder SB. Fat quantification with IDEAL gradient echo imaging: correction of bias from T(1) and noise. Magn Reson Med 2007;58(2):354–364 [DOI] [PubMed] [Google Scholar]
- 25.Yu H, Shimakawa A, McKenzie CA, Brodsky E, Brittain JH, Reeder SB. Multiecho water-fat separation and simultaneous R2* estimation with multifrequency fat spectrum modeling. Magn Reson Med 2008;60(5):1122–1134 [DOI] [PMC free article] [PubMed] [Google Scholar]
- 26.Yu H, McKenzie CA, Shimakawa A, et al. Multiecho reconstruction for simultaneous water-fat decomposition and T2* estimation. J Magn Reson Imaging 2007;26(4):1153–1161 [DOI] [PubMed] [Google Scholar]
- 27.Bydder M, Yokoo T, Hamilton G, et al. Relaxation effects in the quantification of fat using gradient echo imaging. Magn Reson Imaging 2008;26(3):347–359 [DOI] [PMC free article] [PubMed] [Google Scholar]
- 28.Ghugre NR, Wood JC. Relaxivity-iron calibration in hepatic iron overload: probing underlying biophysical mechanisms using a Monte Carlo model. Magn Reson Med 2011;65(3):837–847 [DOI] [PMC free article] [PubMed] [Google Scholar]
- 29.Wood JC, Enriquez C, Ghugre N, et al. MRI R2 and R2* mapping accurately estimates hepatic iron concentration in transfusion-dependent thalassemia and sickle cell disease patients. Blood 2005;106(4):1460–1465 [DOI] [PMC free article] [PubMed] [Google Scholar]
- 30.Anderson LJ, Holden S, Davis B, et al. Cardiovascular T2-star (T2*) magnetic resonance for the early diagnosis of myocardial iron overload. Eur Heart J 2001;22(23):2171–2179 [DOI] [PubMed] [Google Scholar]
- 31.Hines CD, Yokoo T, Bydder M, et al. Optimization of flip angle to allow tradeoffs in T1 bias and SNR performance for fat quantification [abstr]. In: Proceedings of the Eighteenth Meeting of the International Society for Magnetic Resonance in Medicine. Berkeley, Calif: International Society for Magnetic Resonance in Medicine, 2010; # # [Google Scholar]
- 32.Reeder SB, Robson PM, Yu H, et al. Quantification of hepatic steatosis with MRI: the effects of accurate fat spectral modeling. J Magn Reson Imaging 2009;29(6):1332–1339 [DOI] [PMC free article] [PubMed] [Google Scholar]
- 33.Hines CD, Frydrychowicz A, Hamilton G, et al. T(1) independent, T(2) (*) corrected chemical shift based fat-water separation with multi-peak fat spectral modeling is an accurate and precise measure of hepatic steatosis. J Magn Reson Imaging 2011;33(4):873–881 [DOI] [PMC free article] [PubMed] [Google Scholar]
- 34.Kühn JP, Evert M, Friedrich N, et al. Noninvasive quantification of hepatic fat content using three-echo Dixon magnetic resonance imaging with correction for T2* relaxation effects. Invest Radiol 2011;46(12):783–789 [DOI] [PubMed] [Google Scholar]
- 35.Brunt EM, Janney CG, Di Bisceglie AM, Neuschwander-Tetri BA, Bacon BR. Nonalcoholic steatohepatitis: a proposal for grading and staging the histological lesions. Am J Gastroenterol 1999;94(9):2467–2474 [DOI] [PubMed] [Google Scholar]
- 36.Schwenzer NF, Machann J, Haap MM, et al. T2* relaxometry in liver, pancreas, and spleen in a healthy cohort of one hundred twenty-nine subjects-correlation with age, gender, and serum ferritin. Invest Radiol 2008;43(12):854–860 [DOI] [PubMed] [Google Scholar]
- 37.Gandon Y, Guyader D, Heautot JF, et al. Hemochromatosis: diagnosis and quantification of liver iron with gradient-echo MR imaging. Radiology 1994;193(2):533–538 [DOI] [PubMed] [Google Scholar]
- 38.Gandon Y, Olivié D, Guyader D, et al. Non-invasive assessment of hepatic iron stores by MRI. Lancet 2004;363(9406):357–362 [DOI] [PubMed] [Google Scholar]
- 39.Virtanen JM, Komu ME, Parkkola RK. Quantitative liver iron measurement by magnetic resonance imaging: in vitro and in vivo assessment of the liver to muscle signal intensity and the R2* methods. Magn Reson Imaging 2008;26(8):1175–1182 [DOI] [PubMed] [Google Scholar]
- 40.St Pierre TG, Clark PR, Chua-anusorn W, et al. Noninvasive measurement and imaging of liver iron concentrations using proton magnetic resonance. Blood 2005;105(2):855–861 [DOI] [PubMed] [Google Scholar]
- 41.Guyader D, Gandon Y, Robert JY, et al. Magnetic resonance imaging and assessment of liver iron content in genetic hemochromatosis. J Hepatol 1992;15(3):304–308 [DOI] [PubMed] [Google Scholar]
- 42.Chezmar JL, Nelson RC, Malko JA, Bernardino ME. Hepatic iron overload: diagnosis and quantification by noninvasive imaging. Gastrointest Radiol 1990;15(1):27–31 [DOI] [PubMed] [Google Scholar]
- 43.Hankins JS, McCarville MB, Loeffler RB, et al. R2* magnetic resonance imaging of the liver in patients with iron overload. Blood 2009;113(20):4853–4855 [DOI] [PMC free article] [PubMed] [Google Scholar]
- 44.Thomsen C, Wiggers P, Ring-Larsen H, et al. Identification of patients with hereditary haemochromatosis by magnetic resonance imaging and spectroscopic relaxation time measurements. Magn Reson Imaging 1992;10(6):867–879 [DOI] [PubMed] [Google Scholar]
- 45.Hamilton G, Yokoo T, Bydder M, et al. In vivo characterization of the liver fat ¹H MR spectrum. NMR Biomed 2011;24(7):784–790 [DOI] [PMC free article] [PubMed] [Google Scholar]
- 46.Hernando D, Liang ZP, Kellman P. Chemical shift-based water/fat separation: a comparison of signal models. Magn Reson Med 2010;64(3):811–822 [DOI] [PMC free article] [PubMed] [Google Scholar]
- 47.de Bazelaire CM, Duhamel GD, Rofsky NM, Alsop DC. MR imaging relaxation times of abdominal and pelvic tissues measured in vivo at 3.0 T: preliminary results. Radiology 2004;230(3):652–659 [DOI] [PubMed] [Google Scholar]
Associated Data
This section collects any data citations, data availability statements, or supplementary materials included in this article.