Abstract
The heterogeneity of tumor samples is a major challenge in the analysis of high-throughput profiling of tumor biopsies and cell lines. The measured aggregate signals of multigenerational progenies often represent an average of several tumor subclones with varying genomic aberrations and different gene expression levels. The goal of the present study was to integrate copy number analyses from SNP-arrays and karyotyping, gene expression profiling, and pathway analyses to detect heterogeneity, identify driver mutations, and explore possible mechanisms of tumor evolution. We showed the heterogeneity of the studied samples, characterized the global copy number alteration profiles, and identified genes whose copy number status and expression levels were aberrant. In particular, we identified a recurrent association between two BRAFV600E and BRAFV600K mutations and changes in DKK1 gene expression levels, which might indicate an association between the BRAF and WNT pathways. These findings show that the integrated approaches used in the present study can robustly address the challenging issue of tumor heterogeneity in high-throughput profiling.
Keywords: copy number, SNP arrays, next generation sequencing, melanoma
Introduction
The complexity of tumor biology is reflected in the diversity of genomic profiles of cancer specimens collected from different patients or from the same patient at different time points, metastases, or position within the tumor [1,2]. In contrast to normal cells, tumor cells gain ability to proliferate extensively and invade surrounding tissues. Accumulation of genomic aberrations is among the processes that can confer survival advantages to tumor cells [1]. Copy number alterations (CNA), for instance, have been characterized and associated with several different types of cancers, and, in some cases, they have been shown to be associated with disease recurrence [1,3,4]. Characterization of these alterations, including changes in gene expression patterns and point mutations, are of great relevance in understanding cancer biology, as well as in designing clinically useful tumor biomarkers. Recently, we showed that it is mathematically unfeasible to infer the exact copy number status from high-throughput analysis of aggregates of cells from tumor biopsies [5]. The aggregate signals of multigenerational progeny exhibit a higher degree of complexity due to the extent, variety, and frequency of aberrations, contamination of stromal cells, and the intrinsic heterogeneity of cancer [2]. Heterogeneity reflects the dynamic nature of tumors as aggregates of different subclones, each carrying a continually varying number of genomic aberrations, as well as diverse patterns of gene expression levels and point mutations, as we have shown using Fluorescent in situ Hybridization (FISH) of novel amplicons and RNA-Seq profiling of tumor samples [5].
In order to systematically characterize, catalog, and classify signals associated with tumor heterogeneity, we conducted an integrated study of melanoma samples profiled using different technologies and platforms. In our previous study, we developed a robust CNA measure of allelic imbalance ― the M-measure ― and we have shown how to use it to classify tumor SNP profiling to detect regions of copy number gain or loss [5]. In the present study, we integrated the M-measure in an algorithm for CNA detection and simplified the classification of CNAs into four classes as previously described in order to characterize the genomic aberration map of our melanoma samples [5]. We further extended our analysis to study the statistical association between select aberrant loci to their gene expression or to the tumor genotype. Altogether, this study addresses central challenges arising in the integration of analyses of DNA, CNAs, and RNA levels from heterogeneous tumor samples.
Methods
Cytogenetic Analysis
Chromosome analysis was performed on melanoma cell lines using standardized laboratory procedures at Yale Molecular Cytogenetics Laboratory. Briefly, the in situ cultured cells were treated with colcemid to arrest the metaphase, trypsin to digest chromosomal proteins, and Wright’s stain for G-banding. Clonal abnormality was defined by similar numerical and structural chromosome rearrangements observed in at least three metaphases.
SNP-Array Data Profiling Using Microarrays
Yale School of Medicine (YSM) SNP-Array Cohort
DNA from 45 melanoma tumors, with 30 corresponding melanoma cell cultures derived from fresh tumors (Table 1) and 13 paired germlines from either blood or skin, was hybridized to Illumina Human1M BeadChips (Illumina Inc. San Diego, CA) as previously described [5]. These tumors were cutaneous melanomas, unless otherwise specified.
Table 1. Characterization of YSM samples.
| Sample ID | Normal/Nevus/Melanoma | Stage | BRAF status | NRAS status |
| HFSC | Normal | Normal | NA | NA |
| Nbmel | Normal | Normal | NA | NA |
| YULOVY | Melanoma | I, primary | WT | Q61L |
| YUPLA | Melanoma | II | WT | WT |
| YUGOE | Melanoma | III | WT | WT |
| YUKIM | Melanoma | III | WT | Q61R |
| YUROL | Melanoma | III | WT | WT |
| YUPAO | Melanoma | III, acral | WT | WT |
| YUCAS | Melanoma | IV | WT | WT |
| YUCHER | Melanoma | IV | WT | Q61R |
| YUMAG | Melanoma | IV | WT | Q61R / WT |
| YUROB | Melanoma | IV | WT | WT |
| YUSIV | Melanoma | IV | WT | WT |
| YUTUR | Melanoma | IV | WT | WT |
| YUZOR | Melanoma | IV | WT | WT |
| YUWERA | Melanoma | IV, acral | WT | WT |
| YUHOIN | Melanoma | IV, primary | WT | WT |
| YUDOSO | Melanoma | llb, primary | WT | Q61K / WT |
| YUHEIK | Melanoma | primary | WT | WT |
| YUFULO | Melanoma | primary | WT | Q61L / WT |
| YUSTE | Melanoma | III | V600E | WT |
| YUCAL | Melanoma | IV | V600E | WT |
| YUSAC | Melanoma | IV | V600E | WT |
| YUGEN8 | Melanoma | IV | V600E | WT |
| YUCLIR | Giant nevus | Giant nevus | V600E / WT | WT |
| YUSIK | Melanoma | III+ | V600E / WT | WT |
| YUNIBO | Melanoma | IIb, primary | V600K | WT |
| YUKSI | Melanoma | IV | V600K | WT |
| YULAC | Melanoma | IV | V600K | WT |
| YUMAC | Melanoma | IV | V600K | WT |
| YURIF | Melanoma | IV | V600K | WT |
| YUSIT | Melanoma | IV | V600K / WT | WT |
Queensland Institute of Medical Research (QIMR) SNP-Array Cohort
The independent cohort of 76 SNP-arrays was obtained from a publicly available dataset (GEO dataset GSE9003) and consisted of cell lines derived from primary cutaneous melanomas or melanoma metastases [6].
Data Processing
The cohorts were processed independently. We generated B-allele frequencies and Log-R ratios using standard procedures included in the Illumina BeadStudio package. Data were imported in the BeadStudio software suite and normalized within the program with respect to the population of western European ancestry from the HapMap project that was analyzed on the Illumina Human1M BeadChip.
Design, Probe Annotation, and Data Processing of Arrays for Detection of Genome-Wide Gene Expression
YSM Gene Expression Cohort
Expression experiments were performed in batches. Typically, batch artifact effects are significant even when the batches are measured using a single experimental platform. Here, the three experimental batches were analyzed using two different NimbleGen genome-wide human expression arrays platforms: a) 2005-04-20_Human_60mer_1in2 (batch 1) and b) 2006-08-03_HG18_60mer (batch 2 and batch 3). These two platforms consist of ∼400,000 probes for ∼30,000 transcripts and ∼20,000 known genes, as specified in the NimbleGen annotations. Within (Loess based) and between (Quantile based) normalization methods available in the Limma Bioconductor/R library as standard methods for one- and two-channel microarrays are applied [7]. We define expression level as the base two logarithm of the normalized measured array intensities. The data from different batches was kept separate to circumvent possible cross-platform integration artifacts.
To verify our findings on an independent melanoma gene expression cohort, we collected and processed gene expression data from a previous study [8]. We used standard GC Robust Multi-array Averaging (GCRMA) procedures for background subtraction and normalization of the signals from the expression microarrays [9].
The control samples Nbmel are primary cultures of normal human melanocytes isolated from newborn foreskins and grown in OptiMEM (Invitrogen, Carlsbad, CA) with antibiotics, 5 percent fetal calf serum (regular medium) together with growth supplements, and they were used during their first passage.
Gene Expression Cohort from Independent Studies (IGEC)
To support our findings, we analyzed gene expression profiling from two independent melanoma studies [8,10]. The corresponding datasets are publicly available at http://www.broad.mit.edu/melanoma and at the GEO database (GSE7127). The 158 expression profiles measured on Affymetrix HT-HGU133A were processed using standard GC Robust Multi-array Averaging (GCRMA) procedures for background subtraction and normalization of the signals from the expression microarrays [9]. We define expression level as the base two logarithm of the normalized measured array intensities.
CNA Analysis Pipeline (CAP)
CNA analysis encompasses the tasks of detecting and classifying copy number aberrations. We recently showed that determination of the exact number of copies from SNP-arrays is an ill-posed problem in the presence of heterogeneous samples [5]. On the other hand, detection of deviations from the normal (diploid) state can be achieved by classifying the aberrations as losses or gains inferred from the dominant component in the subclonal mixture.
In the present study, we transformed the copy number variables of the A-allele and B-allele to B-allele frequency (β) and ratio of DNA enrichment (ρ) [11]. These transformed variables were used to compute the robust M-measure of allelic imbalance for each SNP
| (1) |
where W corresponds to a window of appropriate size and j is the SNP index, as previously described [5]. In our CAP, we computed the M-measure for each SNP on the array and applied a threshold to determine the CNA status [5]. Specifically, our CAP classifies SNP CNA profiles into four states: gain, loss, aberration, or neither. We previously showed that this classification is a practical choice in tumor CNA analyses when the number of copies of a given locus differs among subclones. The aberration state represented LOH regions, or mixtures with a large diploid component for which the determination of gain or loss is ambiguous, but the state is clearly different from normal diploid. The value of W was set to 100 for the YSM cohort and to 30 for the QIMR in order to account for the different number of measured SNPs in the two studies. Based on these settings, the average resolution of the CAP is estimated to be 300kbp, and it is locally determined by the genome-wide distribution of the SNPs probed by the array. We ran the pipeline only for the autosomes since our model was not designed for allosomes.
Other Statistical Analyses
All other bioinformatics analyses were performed using custom-designed code for the R statistical software package (http://cran.r-project.org), Bioconductor packages (http://www.bioconductor.org), MATLAB (www.mathworks.com) and Perl (http://www.perl.org/).
Data Availability
Information on how to access the data and the results of the analyses described in the present manuscript is available through the MelaGrid resource (http://melagrid.org).
TaqMan Copy number assay
We validated EZH2 copy number variation employing DNA from several melanoma cell line and normal human melanocytes, using Applied Biosystems® real-time PCR instruments and software. The assay included Target-specific forward and reverse primers (CCAGATGCTGGGATAGTGCCACCC and TTCCCGACAGGTACGGCTGCCA), VIC® dye-labeled TAMRAT, and Genotyping Master Mix, following manufacturer’s instructions (Applied Biosystems, Life Technologies Corporation).
Results
The Map of Melanoma CNAs
To inspect the heterogeneity of melanoma tumors at a course grain scale, we performed cytogenetic analysis of 11 melanoma YSM cell lines where, for each cell line, we examined several cells originating from the mainline clone as well as cells from sideline clones (subclones). We observed complex numerical and structural rearrangements from different melanoma tumors, showing the distinctive and complex clonal abnormalities observed in the melanoma cell lines by cytogenetics analysis. In particular, in Figure 1, we show four representative karyotypes, representing a hypodiploid karyotype from YUFULO, a hyperdiploid karyotype from YUNIBO, a hypertriploid karyotype from YUSIK, and a hypotetraploid karyotype from YUSAC. Composite karyotypes for the mainline clone of the inspected tumors are summarized in Table 2.
Figure 1.
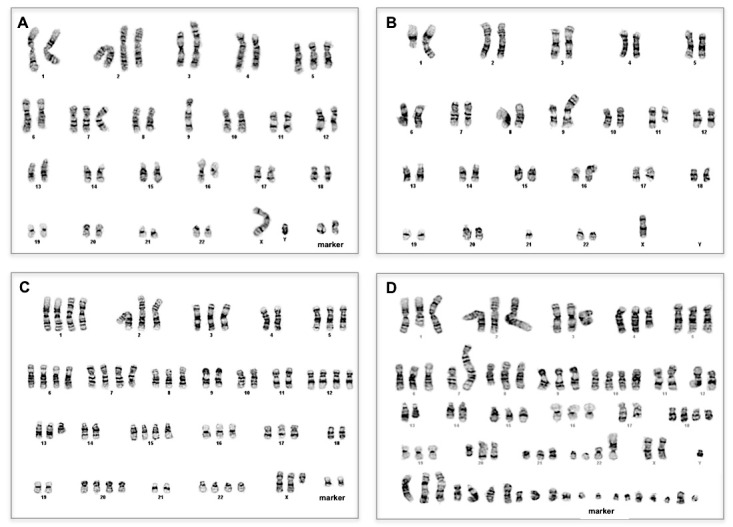
Cytogenetic analysis shows different numerical and structural clonal abnormalities in melanomas. A. Hypodiploid karyotype from YUFULO. B. Hyperdiploid karyotype from YUNIBO. C. Hypertriploid karyotype from YUSIK. D. Hypotetraploid karyotype from YUSAC.
Table 2. Cytogenetics results of analyzed melanoma cell lines.
| Name | Lab No. | Composite Karyotype* (**modal number given inside the < >) |
| YUFULO | 2010-1441 | 44<2n->,X,del(1)(q12),del(4)(q13q21),add(8)(p11.2),der(9)t(1;9)(q21;p21),der(11;21)(p11.2;p13),der(16)add(16)(p13.3)del(16)(q22q24)[cp5] |
| YURIF | 2010-0813 | 44<2n->,XY,del(1)(q12),add(5)(q35),der(6)t(6;8)(q12;q11.2),der(7)del(7)(q11.2q31)dup(7)(q31q36),-8,der(9)t(1;9)(q21;p21),der(10)dup(10)(q21q23)del(10)(q23q26),-13,-16,+17,add(17)(p12),add(17)(q21),-21,+2-4mar[cp5] |
| YUDOSO | 2010-1367 | 45<2n>,XY,-6,add(9)(p22),add(11)(q21),add(14)(q24),-17,+18,-22,+mar[4]/~90,idemx2[1] |
| YUNIBO | 2010-0990 | 48~50<2n+>,der(X)t(X;1)(q26;q21),Y,+2,add(3)(p25),+5,del(5)(q31q35)x2,del(6)(q21q23),+7,-9,add(9)(q34),der(12)del(12)(q13q15)inv(12)(q15q24.3),del(16)(q22q24),+2-3mar[cp5] |
| YUKSI | 2010-0814 | 67~73<3n>,XX,+1,del(1)(p22p32),+2,+3,+4,add(5)(q35),-6,+7,+8,-10,-14,-16,i(17)(q10),-18,-19,+20,-21,+5-7mar[cp5] |
| YUSIV | 2010-0991 | 67~71<3n>,XXX,der(1;3)(q10;q10)x2,-4,-5,-6,-9,-10,add(11)(p11.2),add(12)(p11.2),+13,+16,-17,+20,-21,+2-7mar[cp5] |
| YUSIK | 2010-2079 | 68~70<3n>,XX,del(X)(q11),+1,i(1)(q10),der(1)t(1;14)(p10;q10),-_4,+6,+7,-9,-10,-11,+12,del(13)(q12q22),-14,+15,-18,-19,+20,-21,+22,+2mar[cp5] |
| YULOVY | 2010-1440 | 77~83<3n+>,XX,del(1)(q12)x2,+6,+7,+8,add(8)(p11.2)x2,+9,der(9)t(1;9)(q21;p21)x2,der(11;21)(p11.2;p13),+12,+13,+14,+15,+16,der(16)add(16)(p13.3)del(16)(q22q24)x2,+17,+18,+20,+22,+mar[cp5] |
| YUSIT | 2008-0799 | 80~85<4n->,XXXYY,-1,i(1)(q10),-2,der(2)t(1;2)(p31;q37),-3,del(3)(q21q23),-4x2,-7x2,add(7)(q36),-8x2,der(8)t(8;15)(q24;q21)x2,add(9)(q34),-11x3,add(12)(p13),del(12)(p12),-13x2,add(14)(p13),+16,-17,-18,del(18)(q22)x2,-19,add(20)(q13.3)x2,add(21)(q22),-22x3,der(22)t(1;22)(p10;q10),+10-14mar[cp3] |
| YUSAC | 2008-0800 | 86~87<4n->,XXY,-1,del(1)(q21q25),i(1)(q10),-2,der(2)t(1;2)(p31;q37),-3,del(3)(q21q23),-4,add(4)(q21),-7x2,add(7)(q36),-8,der(8)t(8;15)(q24;q21)x2,-9,add(9)(q34),-11x2,der(11)t(7;11)(p10;q10),-12x2,add(12)(p13),del(12)(p12),-13x2,del(13)(q33),-14x2,add(14)(q32),-15,-16,add(16)(p13.3)x2,-17x2,del(18)(q22)x2,-20,add(20)(q13.3)x2,-21,i(21)(q10),add(22)(p13),der(22)t(1;22)(p10;q10),+20-24mar[cp2] |
| YUROL | 2010-0812 | 81~87<4n->,XXYY,+Y,del(1)(p22p32)x2,-2,inv(3)(p25q29)x4,-4x2,-7,add(7)(p22)x2,-9x2,-11,-13x2,-14,der(14;22)(q10;q10),-15,i(15)(q10),del(16)(q22q24)x2,-17,-18x2,-19x2,der(21;22)(q10;q10),-22,+6-18mar[cp5] |
*Composite karyotype following ISCN (An International System for Human Cytogenetic Nomenclature 2009)
**modal number: 2n-, hypodiploid; 2n+, hyperdiploid; 3n, triploid; 3n+, hypertriploid, 4n-, hypotetraploid.
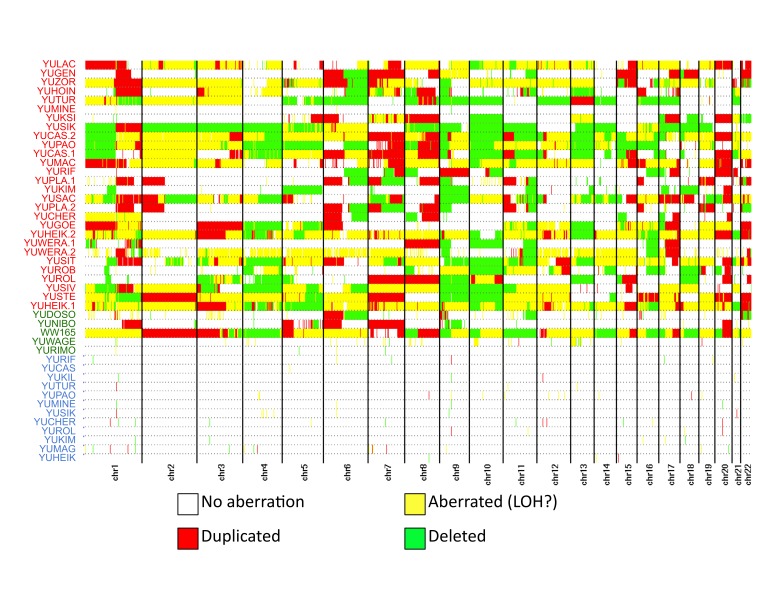
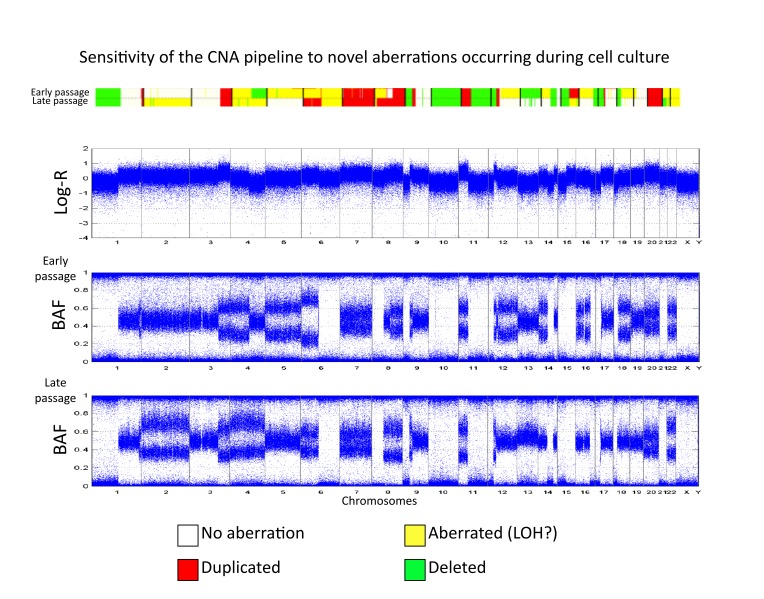
SNP array platforms allow us to detect aberrations at a higher resolution compared with cytogenetic analysis. Measurements using these arrays are performed using numerous cells and hence provide an aggregated picture of these aberrations. We applied our CAP to both the YSM and QIMR cohorts and recovered their genome-wide patterns of genomic alterations (Figure 2). Importantly, the YSM cohort was composed of germline DNA samples as well as primary tumors and metastatic tumor samples. The minimal number of structural variants in the germline samples (Figure 2, blue samples) was indicative of the specificity of our pipeline. In addition, we visually inspected the raw SNP array signals at the chromosomal coordinates of a subset of the germline variants detected by our algorithm and confirmed the presence of these CNV. Interestingly, the YUCAS cell culture from the YSM cohort was profiled twice at two consecutive early passages. Applying our pipeline to these two profiles and comparing their CNA status confirmed the high sensitivity of our approach to detect changes in CNA profiles between closely related cell populations, e.g., in chromosomes 2, 4, 12, 13, and 16 (Figure 3).
Figure 2.
CNA map of the YSM cohort. The colored patient labels refer to metastatic samples (red), primary tumors (green) and normal DNA samples matched to a subset of the tumors (blue). The map shows the status of the corresponding genomic location for each sample. The possible states and their corresponding color are indicated in the legend, with white indicating no detected alteration, red indicating gains, green indicating losses, and yellow indicating possible copy neutral LOHs or not-well characterized aberrations.
Figure 3.
CNA comparison between two passages of the YSM sample YUCAS. The two samples are shown in terms of BAF and CNA maps. The Log-R ratio profile of the early passage is also shown. Several additional aberrations are clearly visible.
Overall, these global CNA maps showed consistent patterns of large aberrations, often affecting whole chromosome arms. In particular, we could identify well-known recurring amplifications in chromosome 7, as well as amplification of 1q and 6p of chromosome 20 and, less frequently, 8q. Similarly, we detected recurring losses of chromosome 9 and 10 in both cohorts, as well as loss of 6q. We also noted cohort-specific aberrations, such as the amplification of chromosome 22 in the QIMR cohort.
We found that the typical number of aberrations varied between the cohorts. Furthermore, we also observed global differences between the profiles of primary and metastatic melanomas. In the YSM cohort, the metastatic melanomas exhibited patterns that we interpreted as superposition of multiple aberrations at the same site, such as changes in chromosomes 8 and 12 in the YUCAS replicates; in contrast, the five primary tumors showed fewer aberrations that tend to be more uniform (Figure 3). Unfortunately, our sample size for primary tumors was too small to conclude that this observation is statistically significant. In addition, we note that the QIMR data had a higher number of aberrations, in general resembling the metastatic YSM profiles.
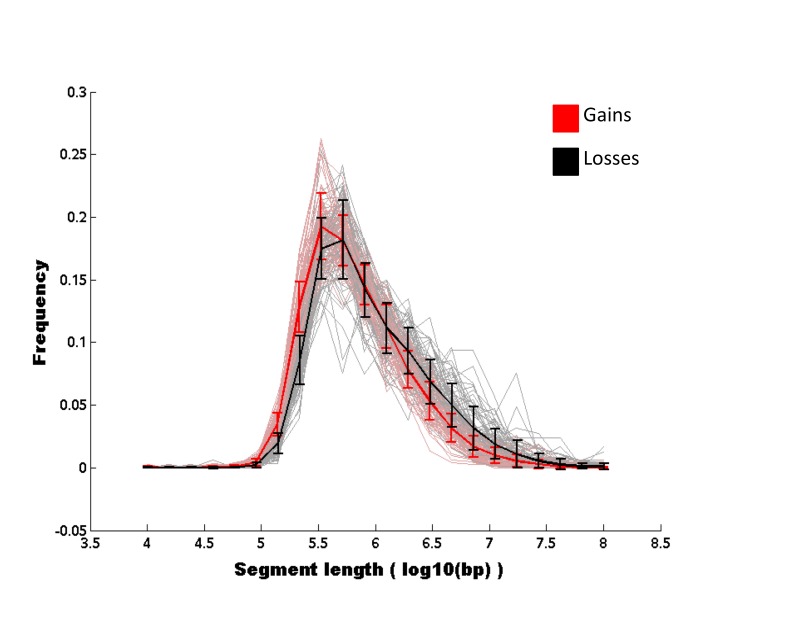
Visual inspection of the global map of aberrations suggested the presence of several short amplifications (~100 kbp). In order to investigate the distribution of genomic sizes of events, we defined an event as the genomic region comprising contiguous SNP-array signals with identical CNA status (gain, loss, aberration, none). For each sample, we computed the length distribution of gain and loss events. We observed a significant over-representation of gain events relative to loss events in length scales around 300kbp. Conversely, in longer length scales (>1 Mbp), gain events were under-represented compared to loss events (Figure 4).
Figure 4.
Empirical distribution of genomic sizes of aberrant regions of gains and losses. For each sample in the cohort, we computed the distribution of genomic sizes of aberrant regions for gains (pink) and losses (gray). The gains mean and corresponding error bars are shown in red, the losses mean and corresponding error bars are shown in black. A gap is seen between the error bars of short copy number events, indicating that gains are more frequent than losses at that length-scale. However, losses are more frequent, although not significantly, at longer length-scales.
Influence of CNAs on Gene Expression Levels
The current understanding is that tumor cells accumulate random aberrations whose net effect is measured in terms of conferring selective advantages to the carrier cell, which ultimately enable the tumor to survive and spread. Many aberrations are regarded as “passengers” that do not significantly alter the tumor phenotype; in contrast, “driver” aberrations can affect growth, or survival, or invasive capabilities of cancer cells, thus leading to more aggressive and resilient tumors. Consequently, in order to select CNAs with the potential of having a relevant association to the oncogenic phenotype, we investigated the relationship between CNAs and gene expression levels of genes positioned within or near to the genomic boundaries of these aberrations.
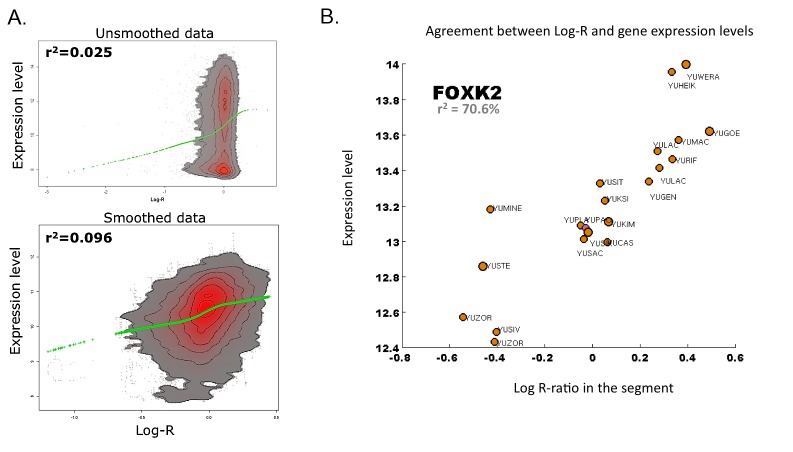
Homozygous deletions are more easily interpreted, as complete loss of a gene causes complete loss of both its mRNA and its protein product. Further, we reasoned that amplified driver genes would have proportionally increased expression. Passenger genes that are not initially expressed would not show expression following amplification or their expression was unaltered due to transcriptional regulatory responses to compensate for the copy number change. We compared the global relationship between gene expression levels, measured using expression microarrays, and the arithmetic mean of Log-R ratios measured along all SNPs within the longest transcript of each gene, which we used as a proxy for the DNA enrichment log-ratio along the transcript. This comparison showed poor correlation between the two quantities, suggesting that the majority of aberrations have either no impact on expression levels or that they affect regions with genes that are not expressed (Figure 5A, top panel). In order to distinguish between these two possibilities, we smoothed the expression profiles as well as the DNA enrichment profiles. For each quantity, we computed a running mean of 30 neighboring genes: The corresponding smoothed profiles between expression levels and DNA enrichment log-ratios showed an increased correlation (Figure 5A, bottom panel).
Figure 5.
Relationship between Log-R ratios and gene expression levels. A. The relationship between Log-R ratios and expression levels improves after smoothing. The density heatmaps show the joint distribution of Log-R ratios and expression levels from the samples in the YSM cohort for which both expression- and SNP-profiling were available. Red corresponds to a high density, while grey corresponds to low density. White is used to indicate areas with too few measurements. A green LOESS estimator has been added as a visual aid. Upper Panel: density heatmap of raw data. Lower Panel: density heatmap after a running mean smoothing along the genomic coordinate of both the expression levels and the Log-R ratios. The Pearson’s correlation coefficient between the two quantities is shown. B. FOXK2 shows strong dependence between Log-R ratios and expression levels. For each tumor sample profiled both in terms of gene expression and CNAs, we compared the expression level and the Log-R ratio. The correlation value shown in the figure corresponds to the Pearson’s correlation coefficient between the average Log-R value along the FOXK2 locus and the expression levels of the FOXK2 gene.
Based on these results, we aimed to identify potential genes localized along driver aberrations. In particular, we computed the correlation between the gene expression levels and the DNA enrichment log ratio across patients in the YSM cohort and determined the significance of the correlation coefficient. Most genes showed a very poor correlation, few passing our Bonferroni-adjusted p-value cutoff of 10-5. The best correlation was found for the Forkhead box protein K2 (FOXK2, r2>0.70), known to participate in gene and viral regulation. Interestingly, we found that a 4-fold change in expression levels across samples was roughly associated with a 2-fold change in Log-R ratio, which we used as a proxy for DNA enrichment (Figure 5B). However, investigation of protein levels as reported in the Human Protein Atlas [12] indicates that high levels of FOXK2 protein are rather typical of cell lines rather than of melanoma tumor samples. Nonetheless, whether the higher levels of FOXK2 in cell lines are directly related to the homogeneous sample of immortalized, metastatic-like cells remains unclear.
Gene Expression Studies Enable Filtering of Relevant CNAs
The negligible number of genes with a significant correlation between DNA enrichment and gene expression levels across all patients was unexpected. Among the many possible explanations for this phenomenon, we reasoned that gene expression patterns are the result of complex regulatory mechanisms and thus direct dependence between expression levels, and CNA might be achieved only for a subset of genes in a non-linear fashion. We therefore selected loci positioned within CNA regions for which the melanoma tumor samples exhibited deviations in terms of gene expression levels. In particular, we identified two sets of 200 genes that were either under- or over-expressed in more than 24 melanoma samples (>80 percent of the 30 samples in the cohort) relative to the extreme expression levels of normal melanocytes for the same gene and showed CNAs affecting the gene locus. For each gene with at least one tumor showing a CNA gain (loss), we required at least 24 tumor samples to have gene expression levels for the selected gene above (below) the maximum (minimum) expression level in any of the normal samples. Next, we selected the 200 over- (under-) expressed genes with the largest number of samples having a CNA gain (loss) affecting the gene locus. In detail, for each gene with at least one tumor showing a CNA gain (loss), we required at least 24 tumor samples have gene expression levels for the selected gene above (below) the maximum (minimum) expression level in any of the normal samples. Next, we selected the 200 over- (under-) expressed genes with the largest number of samples having a CNA gain (loss) affecting the gene locus.
We analyzed these bona fide 400 driver genes with potentially activating aberrations using a standard pathway analysis tool (www.bioinfo.vanderbilt.edu/webgestalt/) and identified the mitotic cell division category to be the leading GO category associated with over-expressed genes. For example, the cell division category included 23 genes with an adjusted p-value < 10-10 and the mitosis category included 19 genes with an adjusted p-value < 10-8. The under-expressed genes exhibited a larger variety of themes, with GO categories associated to Golgi organelle, peptidase activity, and receptor binding, in particular in the class of interferon receptors (Table 3). These results showed that our bona fide candidates were indicative of tumor activity.
Table 3. GO analysis of 200 candidate genes from the integrated pipeline.
| Molecular function | Adjusted p-value | Genes |
| endopeptidase activity | 0.0054 | CARD18, MMP20, ST14, YME1L1, DDI1, BACE1, ADAMTS8, TMPRSS5, ADAMTS15, MMP1, PCSK7, MMP25, TMPRSS4, CASP12 |
| peptidase activity, acting on L-amino acid peptides | 0.0143 | CARD18, MMP20, ST14, YME1L1, BACE1, ADAMTS15, MMP1, PCSK7, USP28, TMPRSS4, DDI1, TMPRSS5, ADAMTS8, MMP25, ZRANB1, CASP12 |
| peptidase activity | 0.0158 | CARD18, MMP20, ST14, YME1L1, BACE1, ADAMTS15, MMP1, PCSK7, USP28, TMPRSS4, DDI1, TMPRSS5, ADAMTS8, MMP25, ZRANB1, CASP12 |
| metalloendopeptidase activity | 0.0209 | MMP1, MMP25, MMP20, YME1L1, ADAMTS8, ADAMTS15 |
| receptor binding | 0.0209 | IFNA8, SORBS1, CD3G, GABARAPL2, ARHGEF12, CRTAM, INSL4, IFNA14, PANX1, IFNA21, MMS19, RLN1, ADAMTS8, APOC3, CER1, MED17, RLN2, APOA5, IFNA13, APOA1 |
|
| ||
| Cellular component | Adjusted p-value | Genes |
|
| ||
| riglyceride-rich lipoprotein particle | 0.0028 | APOC3, APOA5, APOA1, VLDLR |
| very-low-density lipoprotein particle | 0.0028 | APOC3, APOA5, APOA1, VLDLR |
| organelle membrane | 0.0063 | ALG9, SOAT1, ATP5L, TIMM8B, VPS11, SRPR, NLRX1, PCSK7, DPAGT1, GABARAPL2, SPATA19, CHST5, MTMR2, GBF1, SDHD, ST8SIA6, ST3GAL4, SLC37A4, STT3A, UPK2, CYP26C1, ACAT1, CYP17A1, ARCN1, TYRP1 |
| protein-lipid complex | 0.0079 | APOC3, APOA5, APOA1, VLDLR |
| endomembrane system | 0.0079 | ALG9, SOAT1, SRPR, VLDLR, DPAGT1, GABARAPL2, PCSK7, CHST5, GBF1, ST8SIA6, ST3GAL4, SLC37A4, STT3A, VPS26B, UPK2, CYP26C1, CYP17A1, ARCN1, TYRP1 |
| plasma lipoprotein particle | 0.0079 | APOC3, APOA5, APOA1, VLDLR |
| endoplasmic reticulum part | 0.0149 | ALG9, SOAT1, SLC37A4, SRPR, STT3A, UPK2, CYP26C1, HYOU1, DPAGT1, CYP17A1, APOA1 |
| intrinsic to Golgi membrane | 0.0190 | ST8SIA6, PCSK7, ST3GAL4, CHST5 |
| endoplasmic reticulum membrane | 0.0209 | ALG9, SOAT1, SLC37A4, SRPR, STT3A, UPK2, CYP26C1, DPAGT1, CYP17A1 |
| subsynaptic reticulum | 0.0209 | ALG9, SOAT1, SLC37A4, SRPR, STT3A, UPK2, CYP26C1, HYOU1, DPAGT1, CYP17A1, APOA1 |
| nuclear envelope-endoplasmic reticulum network | 0.0261 | ALG9, SOAT1, SLC37A4, SRPR, STT3A, UPK2, CYP26C1, DPAGT1, CYP17A1 |
| Golgi membrane | 0.0261 | ST8SIA6, PCSK7, GABARAPL2, ST3GAL4, CHST5, GBF1, ARCN1 |
| Golgi apparatus part | 0.0263 | ST8SIA6, ST3GAL4, BACE1, TRAPPC4, GABARAPL2, PCSK7, CHST5, ARCN1, GBF1 |
| intrinsic to organelle membrane | 0.0305 | ST8SIA6, ALG9, PCSK7, ST3GAL4, CHST5, UPK2 |
| triglyceride-rich lipoprotein particle | 0.0028 | APOC3, APOA5, APOA1, VLDLR |
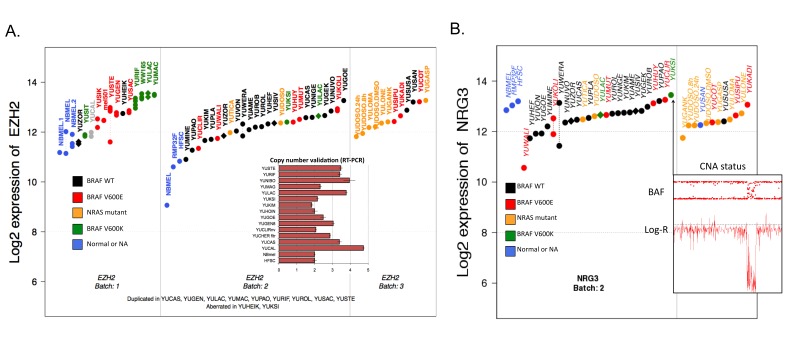
To experimentally verify the utility of this approach, we inspected the copy number status of four selected genes using either RT-PCR or FISH analysis as previously reported [5]. RT-PCR confirmed all amplifications (an example featuring the Histone-lysine N-methyltransferase (EZH2) locus is shown in Figure 6A), and FISH analysis revealed remarkably complex mixtures with varying gains and numbers of subclones. The FISH validation further supported our simplified classification into gain, losses, aberrations, and normal categories as an efficient and transparent approach to handle very complex tumor subclonal mixtures.
Figure 6.
Integrated analysis of CNA and gene-expression. A. Integrated analysis of the EZH2 gene. Combining expression levels and CNA profiling suggests aberrations of the EZH2 gene in a number of samples. The suggested aberrations were validated using RT-PCR techniques as shown in the inset. B. Deletion of the 3’UTR region of the NRG gene occurs in the sample with the highest NRG3 expression level. Samples have been divided into batches based on gene expression profiling. Replicates are shown when available and are connected by a dashed line. Each sample has been characterized in terms of BRAF and NRAS mutations (see the figure legend). Inset: the BAF and Log-R ratio at the NRG3 locus exhibit a clear homozygous deletion in the YUKSI sample.
We investigated focal losses (<1Mbp) and identified one recurring event that was previously reported as a susceptibility locus for schizophrenia [13] and has been linked to breast cancer [14] (Figure 6B). Considering that the focal loss occurs at the 3’ end of the neuregulin 3 (NRG3) gene, we analyzed the expression and CNA status of the NRG3 gene. NRG3 encodes a transmembrane protein whose ectodomain is cleaved and acts as a direct ligand for the transmembrane v-erb-a avian erythroblastic leukemia viral oncogene homolog-like 4 (ERBB4) tyrosine kinase receptor through its BGF-like domain [15]. The binding results in ligand-stimulated tyrosine phosphorylation and activation of the receptor [13,15], which belongs to the ERBBs family, known for being involved in intracellular signaling cascades and the induction of cellular responses including proliferation, migration, differentiation, and survival or apoptosis. We observe the deleted region of the transmembrane gene NRG3 is part of the cytoplasmic region, which is not involved in binding with ERBB4, suggesting that the deleted protein retains functionality.
Association with BRAF Mutations
V-raf murine sarcoma viral oncogene homolog B1 (BRAF) V600 mutations, denoted in the text as BRAFV600E and BRAFV600K, are prevalent in melanomas. Thus, we studied the association of CNA and gene expression levels with BRAF mutation status, and we identified a number of genes whose changes in expression levels were associated to the BRAF status. An important class of genes associated with BRAF status were the Glutathione-S-Transferase genes, in particular, the glutathione S-transferase mu 1 (GSTM1) gene, whose increased level was associated with mutated BRAF. No currently known pathway could explain GSTM1 increased expression as a feedback mechanism of altered BRAF activity. We therefore hypothesized that the increased GSTM1 expression could be obtained via other indirect processes, such as DNA methylation or point mutations. Surprisingly, we found no CNA event associated with BRAF mutation status, suggesting the presence of independent underlying processes leading to large-scale genomic rearrangements and point mutations, the latter exhibiting a stronger association to changes in gene expression patterns.
BRAF mutations and DKK1
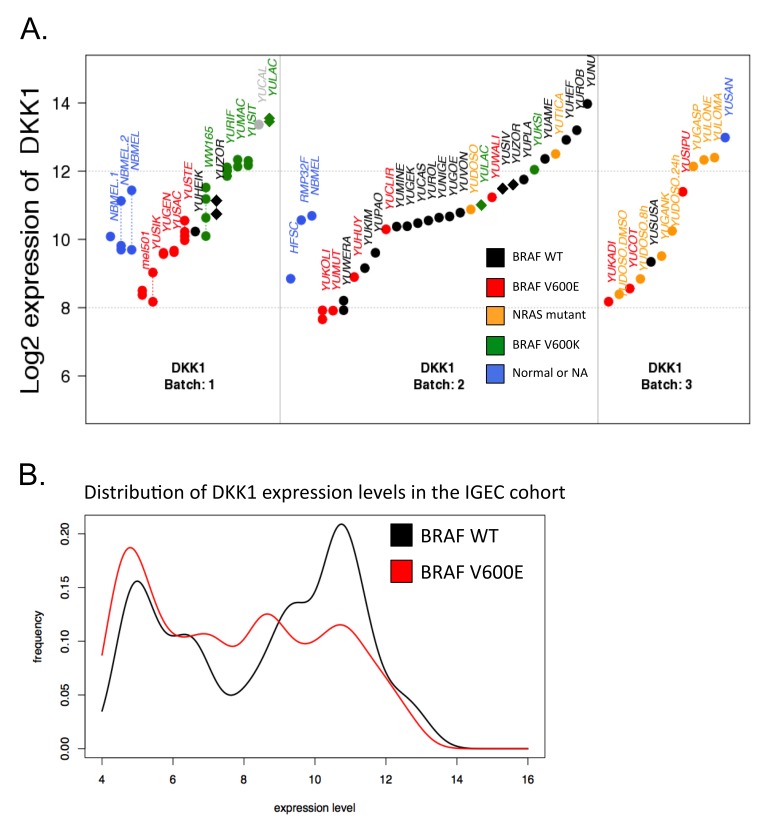
Changes in the expression levels of dickkopf 1 homolog (DKK1) gene were associated with the specific BRAF mutation: DKK1 was expressed at low levels in the BRAFV600E mutants and highly expressed in BRAFV600K mutants. WT BRAF samples showed variability in DKK1 expression levels (Figure 7A). However, our IGEC profiles consist of too few BRAFV600K melanomas to perform direct comparisons between the two groups. Nevertheless, BRAFV600E samples were enriched at low expression levels, while WT BRAF samples exhibited a bi-modal distribution over a broad range of expression levels. In the YSM cohort, we observed two distinct modes for the expression levels of BRAF mutants (low-expression: V600E; high-expression: V600K), while WT BRAF samples exhibited the full range of expression levels; we thus hypothesized that the mode corresponding to high-expression level of WT BRAF in the IGEC cohort might overlap with the mode of the BRAFV600K mutants. Unfortunately, the number of BRAFV600K samples in the IGEC cohort was too small to confirm this hypothesis (Figure 7B).
Figure 7.
DKK1 gene expression levels are associated with BRAFV600 mutation status. A. Expression levels of DKK1 gene in the YSM cohort. Samples have been divided into batches based on gene expression profiling. Replicates are shown when available and are connected by a dashed line. Each sample has been characterized for BRAF and NRAS mutations. With few exceptions, BRAFV600E samples show an expression level below 11 for the DKK1 gene. B. Distribution of DKK1 expression levels in the independent IGEC cohort. The samples in the cohort were divided according to their BRAF mutation status: WT (black) and V600E (red). As expected, WT exhibits clear bi-modality, the lower mode corresponding to the mode of the distribution of DKK1 expression levels in the BRAFV600E group.
Discussion
In the present study, we generated an integrated aberration map of a cohort of melanoma samples collected at our institution. For many of the samples, we had both SNP and expression array profiling. Altogether, the analysis of these data provides a bird’s-eye view of the variety and heterogeneity of melanomas, which we confirmed by comparison with other cohorts. We could also confirm the findings of previous studies concerning typical melanoma aberrations [3,4,8]. For example, the prevalence of amplification of chromosome arms 6p and 8q has been previously demonstrated. Further, we provided additional evidence that consecutive passages of a given short term cell culture exhibit substantial changes in CNA profiles (Figure 3). It is unclear if these successive changes accurately model in vivo tumor evolution or are an artifact of the cell culture environment.
Our findings are consistent with previous studies that employed gene expression profiling analysis to successfully predict whether a locus of interest is positioned within a region of CNA [16]. This approach combines the expression data of genes in the genomic neighborhood of the locus of interest, suggesting that the association between gene expression and CNA at the resolution of single gene is weaker than the association in larger length scales. Notably, gene expression levels are affected by the interplay between weak large-scale regulators, such as copy number and chromatin state, and strong localized regulators, such as transcription factors, DNA methylation, and nucleosomal compaction. Only one gene, FOXK2, a forkhead regulator of chromatin activity, showed a significant correlation between Log-R and expression levels across our cohort. Notwithstanding the weak correlation between CNAs and expression levels, we used the copy number status as a filter to identify relevant examples pointing at the diversity of mechanisms by which a CNA can alter the response of the affected gene. These findings were successfully validated using RT-PCR. In addition, we reported loss of the 3’ end of the NRG3 gene, which did not seem to reduce its expression. This finding could be explained, for instance, by the loss of a miRNA regulatory site, ablated by the deletion.
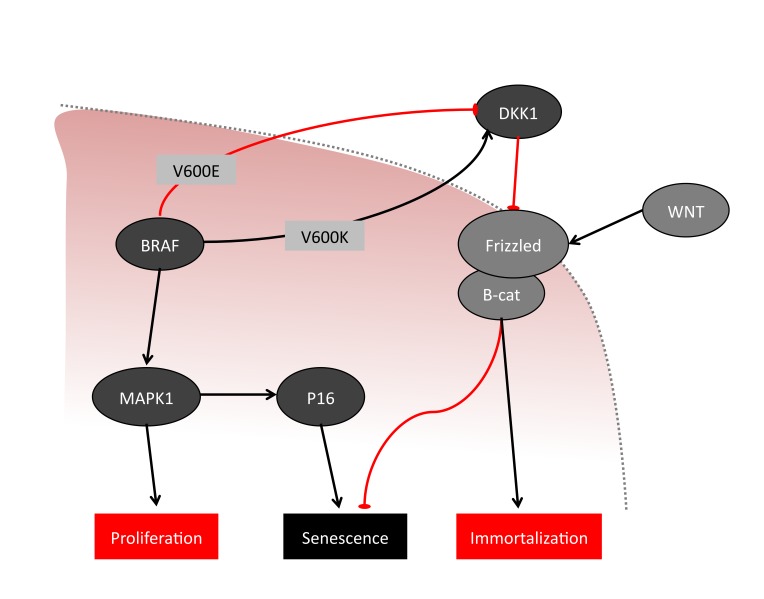
A recurrent goal in the analysis of tumor samples is to identify markers of tumor onset and progression. To address this point, we designed an approach to integrate the diverse information provided by the different types of analyses. We show that in our data the direct influence of CNA on gene expression levels is seen at larger length-scales than at a single gene length-scale. We note, however, that in our data, some aberrations (e.g., the BRAF point mutation) have a strong association with changes in gene expression levels, as shown by the relationship between DKK1 expression and BRAF mutation status. This is consistent with a recent study reporting a highly significant association between BRAFV600E mutations and methylation of the DKK1 promoter site [18]. This methylation would likely result in down regulation of DKK1, hence the observed reduction of gene expression. This leads to the hypothesis of an association between the WNT pathway and the BRAF pathways: BRAFV600E would result in potent activation of proliferation, eventually leading to immortalization; BRAFV600K, a less potent but steadier activation of proliferation, instead would not reach senescence (Figure 8). A recent report using mouse models showed that stabilization of β-catenin signaling was associated to increased Erk activation [19], which is in agreement with our hypothesis, where BRAFV600E, powerfully enhancing Erk, is associated to repression of DKK1. In addition, the study also reported that loss of β-catenin, and thus, inactivation of WNT signaling in BRAF mutant mice corresponded to delayed melanoma formation, together with deep invasions of the dermis [19]. This is in agreement with DKK1 activation associated to BRAFV600K, which, although less effective in enhancing Erk compared to BRAFV600E, would slowly but steadily grow and expand.
Figure 8.
Simplified schematic of a possible association between BRAF and WNT pathways via DKK1. Relevant BRAF pathway components are shown in dark grey. Relevant WNT pathway components are shown in light grey. Red lines indicate that there is a hindering association, whereas black arrows indicate a facilitating association. Two alternative paths are indicated, one hindering, corresponding to the presence of V600E BRAF, and a facilitating one, corresponding to the presence of BRAFV600K. BRAFV600E is associated to decrease in DKK1 levels, while V600K BRAF is associated to increase in DKK1 levels. The cell membrane is shown as a dashed grey line.
Conclusion
Integration of separate genomic approaches has the potential to distinguish driving alterations from passengers in the aggregate signal from multigenerational heterogeneous tumor samples. While the direct relation between copy number, gene expression, and phenotype may require analysis of additional processes, such as epigenetics, and point mutations, the present study provides some insight into the complexity of tumor aberrations.
Abbreviations
- BRAF
V-raf murine sarcoma viral oncogene homolog B1
- CAN
copy number alteration
- CAP
Copy-Number Analysis Pipeline
- DKK1
dickkopf 1 homolog
- ERBB4
erb-a avian erythroblastic leukemia viral oncogene homolog-like 4
- EZH2
Histone-lysine N-methyltransferase
- FISH
Fluorescent in situ Hybridization
- GCRMA
GC Robust Multi-array Averaging
- GSTM1
glutathione S-transferase mu 1
- IGEC
Independent Gene Expression Cohort
- QIMR
Queensland Institute of Medical Research
- YSM
Yale School of Medicine
Author contributions
F.P., H.K., and Y.K. designed the computational and statistical study; S.A. and D.N. collected the samples; A.B., E.C., and R.H. provided the biological data and performed the RT-PCR validations; F.X. and P.L. performed Cytogenetics and FISH analyses; F.P., M.M., F.S., and Y.K. performed the computational and statistical analyses; F.P., H.K., P.L., R.H., and Y.K. wrote the manuscript. This work was supported by the Yale SPORE in Skin Cancer funded by the National Cancer Institute grant number 1 P50 CA121974 (R. Halaban, PI). F.S. is supported by an American-Italian Cancer Foundation Post-Doctoral Research Fellowship.
References
- Mullighan CG, Phillips LA, Su XP, Ma J, Miller CB, Shurtleff SA. et al. Genomic Analysis of the Clonal Origins of Relapsed Acute Lymphoblastic Leukemia. Science. 2008;322:1377–1380. doi: 10.1126/science.1164266. [DOI] [PMC free article] [PubMed] [Google Scholar]
- Navin N, Krasnitz A, Rodgers L, Cook K, Meth J, Kendall J. et al. Inferring tumor progression from genomic heterogeneity. Genome Res. 2010;20:68–80. doi: 10.1101/gr.099622.109. [DOI] [PMC free article] [PubMed] [Google Scholar]
- Hoglund M, Frigyesi A, Sall T, Gisselsson D, Mitelman F. Statistical behavior of complex cancer karyotypes. Genes Chromosomes Cancer. 2005;20:327–341. doi: 10.1002/gcc.20143. [DOI] [PubMed] [Google Scholar]
- Hoglund M, Gisselsson D, Hansen GB, White VA, Sall T, Mitelman F. et al. Dissecting karyotypic patterns in malignant melanomas: temporal clustering of losses and gains in melanoma karyotypic evolution. Int J Cancer. 2004;108:57–65. doi: 10.1002/ijc.11558. [DOI] [PubMed] [Google Scholar]
- Parisi F, Ariyan S, Narayan D, Bacchiocchi A, Hoyt K, Cheng E. et al. Detecting copy number status and uncovering subclonal markers in heterogeneous tumor biopsies. BMC Genomics. 2011;12:230. doi: 10.1186/1471-2164-12-230. [DOI] [PMC free article] [PubMed] [Google Scholar]
- Stark M, Hayward N. Genome-wide loss of heterozygosity and copy number analysis in melanoma using high-density single-nucleotide polymorphism arrays. Cancer Res. 2007;67:2632–2642. doi: 10.1158/0008-5472.CAN-06-4152. [DOI] [PubMed] [Google Scholar]
- Pelizzola M, Koga Y, Urban AE, Krauthammer M, Weissman S, Halaban R. et al. MEDME: an experimental and analytical methodology for the estimation of DNA methylation levels based on microarray derived MeDIP-enrichment. Genome Res. 2008;18:1652–1659. doi: 10.1101/gr.080721.108. [DOI] [PMC free article] [PubMed] [Google Scholar]
- Lin WM, Baker AC, Beroukhim R, Winckler W, Feng W, Marmion JM. et al. Modeling genomic diversity and tumor dependency in malignant melanoma. Cancer Res. 2008;68:664–673. doi: 10.1158/0008-5472.CAN-07-2615. [DOI] [PMC free article] [PubMed] [Google Scholar]
- Wu Z, Rafael RA, Irizarry A, Gentleman R, Martinez-Murillo F, Spencer F. A Model-Based Background Adjustment for Oligonucleotide Expression Arrays. J Amer Stat Assoc. 2004;99:909–917. [Google Scholar]
- Johansson P, Pavey S, Hayward N. Confirmation of a BRAF mutation-associated gene expression signature in melanoma. Pigment Cell Res. 2007;20:216–221. doi: 10.1111/j.1600-0749.2007.00375.x. [DOI] [PubMed] [Google Scholar]
- Peiffer DA, Le JM, Steemers FJ, Chang W, Jenniges T, Garcia F. et al. High-resolution genomic profiling of chromosomal aberrations using Infinium whole-genome genotyping. Genome Res. 2006;16:1136–1148. doi: 10.1101/gr.5402306. [DOI] [PMC free article] [PubMed] [Google Scholar]
- Uhlen M, Oksvold P, Fagerberg L, Lundberg E, Jonasson K, Forsberg M. et al. Towards a knowledge-based Human Protein Atlas. Nat Biotechnol. 2010;28:1248–1250. doi: 10.1038/nbt1210-1248. [DOI] [PubMed] [Google Scholar]
- Kao WT, Wang Y, Kleinman JE, Lipska BK, Hyde TM, Weinberger DR. et al. Common genetic variation in Neuregulin 3 (NRG3) influences risk for schizophrenia and impacts NRG3 expression in human brain. Proc Nat Acad Sci USA. 2010;107:15619–15624. doi: 10.1073/pnas.1005410107. [DOI] [PMC free article] [PubMed] [Google Scholar]
- Dunn M, Sinha P, Campbell R, Blackburn E, Levinson N, Rampaul R. et al. Co-expression of neuregulins 1, 2, 3 and 4 in human breast cancer. J Pathol. 2004;203:672–680. doi: 10.1002/path.1561. [DOI] [PubMed] [Google Scholar]
- Zhang D, Sliwkowski MX, Mark M, Frantz G, Akita R, Sun Y. et al. Neuregulin-3 (NRG3): a novel neural tissue-enriched protein that binds and activates ErbB4. Proc Nat Acad Sci USA. 1997;94:9562–9567. doi: 10.1073/pnas.94.18.9562. [DOI] [PMC free article] [PubMed] [Google Scholar]
- Hu D, Chong RA, Yang Q, Wei Y, Blanco MA, Li F. et al. MTDH activation by 8q22 genomic gain promotes chemoresistance and metastasis of poor-prognosis breast cancer. Cancer Cell. 2009;15:9–20. doi: 10.1016/j.ccr.2008.11.013. [DOI] [PMC free article] [PubMed] [Google Scholar]
- Gardner TS, Cantor CR, Collins JJ. Construction of a genetic toggle switch in Escherichia coli. Nature. 2000;403:339–342. doi: 10.1038/35002131. [DOI] [PubMed] [Google Scholar]
- Rawson JB, Manno M, Mrkonjic M, Daftary D, Dicks E, Buchanan DD. et al. Promoter methylation of Wnt antagonists DKK1 and SFRP1 is associated with opposing tumor subtypes in two large populations of colorectal cancer patients. Carcinogenesis. 2011;32:741–747. doi: 10.1093/carcin/bgr020. [DOI] [PMC free article] [PubMed] [Google Scholar]
- Damsky WE, Curley DP, Santhanakrishnan M, Rosenbaum LE, Platt JT, Gould Rothberg BE. et al. beta-catenin signaling controls metastasis in Braf-activated Pten-deficient melanomas. Cancer Cell. 2011;20:741–754. doi: 10.1016/j.ccr.2011.10.030. [DOI] [PMC free article] [PubMed] [Google Scholar]
Associated Data
This section collects any data citations, data availability statements, or supplementary materials included in this article.
Data Availability Statement
Information on how to access the data and the results of the analyses described in the present manuscript is available through the MelaGrid resource (http://melagrid.org).


