

Abstract
Objective
Determine, using fuzzy set qualitative comparative analysis (fs/QCA), the relationship between patient-centered medical home (PCMH) systems and quality in 21 NCQA recognized medical homes.
Data Sources/Study Setting
Primary data collected in 2009, including measures of optimal diabetes care (ODC), preventive services up-to-date (PSUTD), patient experience (PEX), survey data assessing PCMH capabilities (PPC-RS), and other clinic characteristics.
Study Design
Cross-sectional study identifying associations between PPC-RS domains, demographic, socioeconomic, and co-morbidity measures, and quality outcomes.
Data Collection/Extraction Methods
PPC-RS scores were obtained by surveying clinic leaders. PSUTD and ODC scores were obtained from provider performance data. PEX data were obtained from patient surveys. Demographic, socioeconomic, and co-morbidity data were obtained from EMR and census data.
Principal Findings
fs/QCA identified associations between all three outcomes and PCMH capabilities: ODC and team-based care; PSUTD and preventive services systems; and all three outcomes and provider performance reporting systems. Previous statistical analysis of this data had failed to identify these relationships.
Conclusions
fs/QCA identified important associations that were overlooked using conventional statistics in a small-N health services data set. PCMH capabilities are associated with quality outcomes.
Keywords: Clinical practice systems, patient experience, quality of care, medical home, fuzzy set qualitative comparative analysis
Recent interest in the concept of the “medical home” arises from the hypothesis that this care delivery model will revive primary care practices and help the health care system achieve the “triple aim” of higher quality clinical care, affordability, and improved patient experience (Rittenhouse and Shortell 2009). While there is reasonable empiric evidence related to concepts included in the patient-centered medical home (PCMH), evidence is lacking as to whether medical homes will produce the expected results. Moreover, the definition of PCMH is still controversial.
The National Committee on Quality Assurance (NCQA) has a program for evaluating the capacity of a primary care practice to function as a PCMH, the Physician Practice Connections—Patient-Centered Medical Home (PPC-PCMH) (Road to Recognition: Your Guide to the NCQA Medical Home 2009). This program assesses the degree to which a medical practice has adopted processes that are consistent with the PCMH principles defined by the four primary care specialty groups in 2007 (Joint Principles of the Patient-Centered Medical Home 2007).
Previously we studied the association between scores on the PPC-RS (a research survey based on the 2006 NCQA PPC program, and addressing much of the content of the PP-CPCMH program) and three measures of quality in a set of 21 clinics that are recognized as Level III NCQA Medical Homes using the PPC-PCMH 2008 (Solberg et al. 2011). Using standard statistical analysis, we found no association between PPC-RS scores and clinic quality performance after controlling for other factors like patient demographics. However, the small sample size may have limited our ability to detect associations.
To address this sample size limitation, and to further explore possible connections between “medical home-ness”, patient characteristics, and quality outcomes, we now report an exploratory study using a set-theoretical analytic method, fuzzy set qualitative comparative analysis (fs/QCA). fs/QCA is an accepted analytic method in the social sciences, but it has seen only limited use in health services and organizational research (Ragin 1987, 1999, 2008; Dy et al. 2005; Britt 2006; Britt and Evans 2007; Fiss 2007; Shanahan et al. 2008; Schensul et al. 2010).
There are several reasons why fs/QCA may reveal relationships between clinic characteristics and quality scores that were not evident in the prior analysis. fs/QCA is designed for small-N qualitative case studies. Also, fs/QCA identifies “necessary but not sufficient,” or “sufficient but not necessary,” set relationships, not just “necessary and sufficient” correlations. Finally, fs/QCA is well suited for exploring complex causality, such as when more than one combination of conditions is associated with the same outcome (equifinality). Health services research often involves studying complex social phenomena and interventions using small-N, qualitative data sets—conditions that are challenging for conventional statistical analysis and for which fs/QCA was specifically designed. The purpose of this study is to use fs/QCA to evaluate the connection between medical home system capabilities and quality outcomes.
Methods
Data and Study Group: The data used in this analysis are described in detail in our prior article (Solberg et al. 2011). Data were available from 21 clinics that belong to the same Upper Midwest integrated delivery system and are recognized by NCQA using the PPC-PCMH 2008 as Level III medical homes. PPC-RS scores were obtained by surveying clinic leaders. Patient experience data were obtained from Picker surveys related to recent clinic office visits. Preventive services up-to-date (PSUTD) and optimal diabetes care (ODC) scores, and demographic and co-morbidity measures, were obtained from each clinic's electronic medical record. Geocoding at the patient level (2000 census data) was used to estimate the socioeconomic characteristics of each clinic's patient population.
In prior articles, PPC-RS survey items were grouped into five “domains” derived from the Chronic Care Model: self-management support, decision support, delivery system redesign, health care organization, and clinical information system (Solberg et al. 2008, 2011). Health care organization items address provider performance assessment and reporting capabilities, and thus they could influence any outcome covered by a clinic's quality reporting capabilities. For all the clinics in this study, the provider performance reports include information about all three quality outcomes included in this analysis: two clinical quality measures (PSUTD, ODC) and patient experience.
The original domain grouping method disperses survey items related to PSUTD and ODC across multiple PPSRS domains and therefore may have obscured the relationship between diabetes-specific items and ODC scores, and preventive service specific items and PSUTD scores. To address this issue, we created new domains by regrouping the PPC-RS items into systems categories for the following: tracking items, such as follow-up on test results; supporting preventive services delivery, such as checklists and reminders; supporting care for chronic conditions, like guidelines and reminders; providing team-based care, such as having staff assigned for patient education or care management; indicating a patient-centered practice approach, such as encouraging patient self-management; and measuring and reporting provider performance (the same items included in the original “health care organization” domain). The diabetes-specific items in the teamwork, patient-centered care, and chronic disease systems domains were used to create diabetes-specific domains, and these items were combined to create a total diabetes items score. Details of the scoring method used to create the new domains are available online in the technical appendix. All concepts included in our analysis are listed and described in Table 1.
Table 1.
Definitions of Set Theoretical Concepts
| Concept | Membership Function (Anchor Points)* |
|---|---|
| Quality outcomes | |
| Optimal diabetes care | Calibration (36,26,16) |
| Preventive services up-to-date | Calibration (79,68,54) |
| Picker “would recommend” problem score | Calibration (28,17,6) |
| PPC-RS domains | |
| Provider reporting | Calibration (100,67,33) |
| Information tracking | Calibration (100,74.9,50) |
| Preventive services systems | Calibration (100, 67,33) |
| Chronic care systems | Calibration (96,62,28) |
| Chronic care systems–diabetes items only | Calibration (100,71,42) |
| Teamwork processes | Calibration (77,46,15) |
| Teamwork processes–diabetes items only | Calibration (100,62,25) |
| Patient-centered care processes | Calibration (100,66,32) |
| Patient-centered care processes–diabetes items only | Calibration (100,64,27) |
| Total diabetes score (sum of all diabetes PPC items) | Calibration (95,66,37) |
| Other picker items | |
| Picker “received enough info” problem score | Calibration (28,17,6) |
| Picker “timely test results” problem score | Calibration (28,17,6) |
| Communication problems | = minimum(enough information, timely results) |
| Comorbidity | |
| Clinic average body mass index | Calibration (31,29.8,28.6) |
| Clinic average count drugs ordered per patient per year | Calibration (10,7.5,5.5) |
| Clinic characteristics | |
| Clinic size (number of patients) | Calibration (15,000,10,000,5,000) |
| Percent female patients | Calibration (75,61,55) |
| Percent patients with age ≥65 | Calibration (33,25,10) |
| Combination of female or senior patients | = maximum(female, seniors) |
| Socioeconomic factors | |
| Mean percent of families below poverty | Calibration (12,7,5) |
| Mean percent of patients without high school education | Calibration (19,10,6) |
| Mean percent of patients with English preference | Calibration (95,90,80) |
| Mean percent of patients from urban area | Calibration (95,85,50) |
| Mean percent of nonwhite patients | Calibration (50,25,10) |
| Low socioeconomic status | = minimum(below poverty, no high school, nonwhite) |
Anchor points are given in the following order: fully in, point of maximum ambiguity, fully out.
Fuzzy set qualitative comparative analysis: For this analysis we used fs/QCA software, version 2.2, downloaded from http://www.u.arizona.edu/∼cragin/fsQCA/ on August 24, 2008. Detailed descriptions of the method are available in a number of references (Ragin 2008, 2009). The basic approach involves converting metrics of interest into measures of fuzzy set membership using a process called “calibration”, and then comparing membership in different fuzzy sets to identify subset relationships between the concepts represented by the sets.
In an ordinary “crisp” set, elements are either in the set (membership = 1) or not in the set (membership = 0). In a fuzzy set, items can have partial membership in the set; therefore, set membership can be anywhere in the range [0–1]. Conventionally, a membership of 0.95 or greater indicates an item that is “fully or nearly fully in” the set; a membership of 0.05 or less indicates an item that is “fully out or nearly fully out” of the set; and a membership of 0.5 indicates the point of maximum ambiguity as to membership in the set. Fuzzy set membership is assigned using a “membership function” that maps a metric of interest for all items in the set onto the interval [0–1]. Membership functions serve two purposes: assigning membership in the fuzzy set, and “calibrating” the set-theoretical concept so that it is related to external standards and addresses meaningful variation (Ragin 2008, pp. 71–72).
We used the fs/QCA calibrate function to assign fuzzy set membership. This function requires three values of the variable as anchor points that indicate (1) full membership in the set; (2) full nonmembership in the set; and (3) the point of maximum ambiguity (neither in nor out of the set) (Ragin 2008; pp. 104–105). In general, we used the statistical properties of the data to set the calibration anchor points. Calibration details are available in the technical appendix; and anchor points are listed in Table 1.
Several of our analytical concepts were developed into fuzzy sets using other fuzzy set operations. To combine existing fuzzy sets into new sets, we used the fuzzy set operators AND (set intersection), OR (set union), and NOT (negation). Clinics in the set “low socioeconomic status” are those with large numbers of patients who are nonwhite, have low educational status, and live in poverty. Clinics in the set “women or seniors” are those that specialize in the care of women or people older than 65. We defined the set “communication problems” as the intersection of two fuzzy sets based on related Picker problem scores, “timely follow-up on test results,” and “received enough information”. Table 1 shows the membership functions applied to each concept in the analysis.
Two different fs/QCA methods were used to explore the set theoretical relationships between concepts. First, we evaluated “bivariate” relationships (subset and superset relationships between two sets) using the graph capability. Fuzzy set A is a subset of fuzzy set B if all the elements in set A are in set B and for each element membership in set A is less than membership in set B. In such a case, in a graph of B on the X-axis and A on the Y-axis, all the points are in the lower right corner of the plot. If a causal relationship exists, B is a necessary cause of A (see Figure 1). Alternatively, if membership in set A is greater than membership in set B, A is a superset of B, all the points are in the upper left corner of the plot, and if B is a cause of A, it is a sufficient cause.
Figure 1.
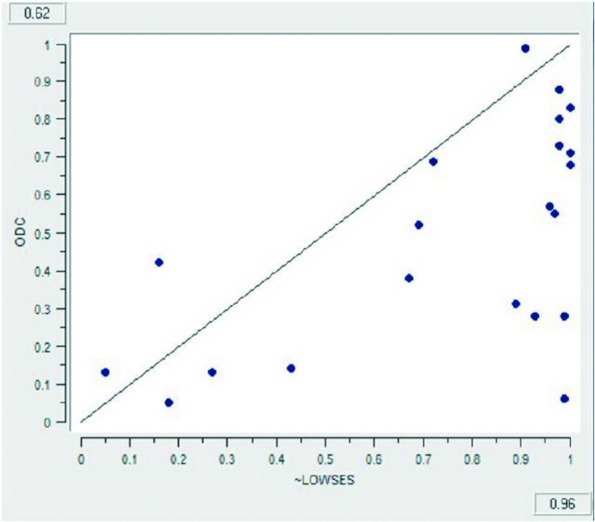
Graphical Representation of Fuzzy Set Relationships. Actual output from fs/QCA graph capability demonstrating that higher socioeconomic status is a necessary but not sufficient condition for achieving better optimal diabetes care. In other words, ODC is a fuzzy subset of ∼LOWSES (not low socioeconomic status). The consistency of the set relationship is 0.96; and the coverage is 0.62
Fuzzy set relationships are quantified using two measures: consistency and coverage. Consistency measures the degree to which cases with the effect also exhibit or have the causal or constitutive characteristic. In other words, it measures the proportion of the members of the subset that are members of the superset. Consistency is to set relationships as p-value is to statistical inference. The higher the consistency, the stronger the set relationship. In general, we look for set-theoretical relationships with consistencies greater than 0.9. Set relationships with consistencies less than 0.8 should generally be ignored. Probabilistic criteria can be applied to fsQCA results to evaluate the likelihood that an observed consistency is different from a benchmark value (Ragin 2000, pp. 110–113). With 21 clinics, the likelihood of observing a set relationship with consistency greater than or equal to 0.85 when the actual consistency is 0.65 (still more in than out of the fuzzy set “consistent”) is less than 0.05.
Coverage measures how much a consistent subset “covers” the superset. In the case of “necessary” causes, coverage can be interpreted as the degree to which the cause “is relevant” to the effect. In the case of “sufficient” causes, coverage indicates the degree to which the cause explains all cases of the effect. When there are multiple sufficient causal paths to the same outcome, partitioning the coverage between the paths provides an estimate of the empirical importance of each path. The higher the unique coverage, the more important the causal configuration, assuming the consistency of the set relationship is high (Ragin 2008, pp. 63–68).
A second fs/QCA approach is to use fuzzy set truth table analysis (FSTTA) to identify “multivariate” configurations that are sufficient conditions for the outcomes of interest. For inclusion in the multivariate models, we selected independent “causal” sets for which the consistency of the bivariate set relationship was greater than or equal to 0.90 or there was a substantive or theoretical reason to think that the set might be associated with the outcome of interest. Table 2 shows the multivariate models we evaluated.
Table 2.
Fuzzy Set Truth Table Analysis Models
| Independent Conditions | |||
|---|---|---|---|
| Model | Dependent Variable | PPC-RS Domains | Other |
| 1 | ODC | Provider reporting | Low socioeconomic status, seniors or women |
| 2 | ODC | Diabetes team work | Low socioeconomic status, seniors or women |
| 3 | ODC | Provider reporting, diabetes teamwork | Low socioeconomic status, seniors or women |
| 4 | PSUTD | Provider reporting | Low socioeconomic status, seniors or women, BMI, not enough information |
| 5 | PSUTD | Preventive care systems | Low socioeconomic status, seniors or women, BMI, not enough information |
| 6 | PSUTD | Provider reporting, preventive care systems | Low socioeconomic status, seniors or women, BMI, not enough information |
| 7 | NOTRECOMMEND | Provider reporting | Low socioeconomic status, seniors or women, communication problems |
ODC, optimal diabetes care; PSUTD, preventive services up-to-date.
Average drug count was not included in the ODC models because of the strong set relationships (i.e., covariance) between drug count, socioeconomic status, and specializing in geriatrics or women's health. We included provider reporting systems in models for all three outcomes because these outcomes are all included in the clinic provider performance reporting system. We included diabetes team care in ODC model 2 because of the PPC-RS domains; it had the strongest bivariate relationship with the ODC outcome. We included preventive care systems in model 5 because it had the strongest bivariate relationship with the PSUTD outcome, and because in theory it should be the PPC-RS domain with the biggest effect on this outcome. BMI was included in models 4-6 because of the known association between high BMI and low utilization of preventive services, especially in women (Østbye et al. 2005; Cohen et al. 2008; Maruther et al. 2009a,b).
We followed FSTTA best practices suggested by Ragin and others (Ragin 2008; Rihoux and Ragin 2008; Wagemann and Schneider 2007). Details regarding the method are available in the technical appendix.
Results
Bivariate analyses: the set-theoretical relationships between individual independent conditions and dependent outcomes are shown in Table 3.
Table 3.
Bivariate Analysis Results
| ODC | PSUTD | NOTRECOMMEND | RECOMMEND | |||||
|---|---|---|---|---|---|---|---|---|
| Conditions | Consistency | Set Relationship | Consistency | Set Relationship | Consistency | Set Relationship | Consistency | Set Relationship |
| Provider reporting | 0.87 | Superset | 0.79 | 0.89 | Superset | |||
| Information tracking | 0.66 | 0.68 | 0.68 | |||||
| Preventive services | 0.89 | Superset | 0.85 | Superset | 0.91 | Superset | ||
| Chronic care | 0.64 | 0.66 | 0.72 | |||||
| Chronic care-diabetes | 0.73 | 0.75 | 0.8 | Superset | ||||
| Team care | 0.74 | 0.66 | 0.68 | |||||
| Team care-diabetes | 0.91 | Superset | 0.84 | Superset | 0.85 | Superset | ||
| Patient centered care | 0.59 | 0.72 | 0.75 | |||||
| Patient centered care-diabetes | 0.62 | 0.71 | 0.75 | |||||
| Diabetes overall | 0.75 | 0.77 | 0.82 | Superset | ||||
| Low poverty | 0.9 | Superset | 0.77 | 0.79 | ||||
| White | 0.81 | Superset | 0.75 | 0.76 | ||||
| English proficiency | 0.87 | Superset | 0.94 | Superset | 0.98 | Superset | ||
| High school education | 0.88 | Superset | 0.84 | Superset | 0.84 | Superset | ||
| High socioeconomic status | 0.96 | Superset | 0.88 | Superset | 0.9 | Superset | ||
| NOT female | 0.93 | Superset | 0.91 | Superset | 0.99 | Superset | ||
| NOT seniors | 0.98 | Superset | 0.97 | Superset | 0.98 | Superset | ||
| NOT female or seniors | 0.91 | Superset | 0.88 | Superset | 0.97 | Superset | ||
| Low BMI | 0.81 | Superset | 0.87 | Superset | 0.85 | Superset | ||
| Low drug count | 0.92 | Superset | 0.83 | Superset | 0.81 | Superset | ||
| Large clinic | 0.8 | Superset | ||||||
| Small clinic | 0.62 | 0.72 | 0.78 | Subset | ||||
| Urban | 0.84 | Superset | 0.89 | Superset | 0.9 | Superset | ||
| Recommend | 0.66 | 0.79 | ||||||
| Enough information | 0.69 | 0.85 | Subset | 0.82 | Subset | |||
| Timely test follow up | 0.64 | 0.66 | 0.74 | Correlation? | ||||
| Enough info and timely follow-up | 0.8 | Superset | 0.83 | Superset | 0.91 | Superset | ||
Consistencies greater than 0.80 are shown in bold font. Set relationships are shown only if consistency >0.80. Superset indicates that membership in condition is greater than or equal to membership in outcome (necessity). Subset indicates that membership in condition is less than or equal to membership in outcome (sufficiency). Note: if A is a necessary condition (superset) of B, then ∼A (not A) is a sufficient condition (subset) of ∼B (not B).
ODC, optimal diabetes care; PSUTD, preventive services up-to-date.
Better than average diabetes care is linked set-theoretically (consistency greater than 0.80) with the following “necessary” conditions: high PPC-RS scores on the provider reporting, preventive services, and diabetes team care domains; having a patient population with good socioeconomic status, low co-morbidity (low average drug count), and not containing a disproportionate number of women or seniors; an urban location; and low communication problems.
PSUTD was associated with the following “necessary” conditions: high PPC-RS scores on the preventive services and diabetes team care domains; having a patient population with good socioeconomic status, low co-morbidity, and not containing a disproportionate number of seniors; an urban location; and providing patients with enough information. Not specializing in women's health is also associated with PSUTD with high consistency; but the clinic in this set with all female patients had very high PSUTD scores.
Low Picker “would recommend” problem scores were associated with the following “necessary” conditions: the PPC-RS domains provider reporting, total PPC-RS score, preventive services, diabetes chronic care, diabetes team care, and total diabetes score; having a patient population with good socioeconomic status, low average drug count, and low average BMI; and good communication with patients. Conversely, high Picker “would recommend” problem scores were associated with being a large, urban, general medical clinic.
The correlation between “would recommend problem scores” and “communication problems” is moderate (r = 0.54); but the set relationship is quite strong—good patient communication is a necessary condition for low “would recommend” problem scores with a consistency of 0.91.
Subset relationships were also observed between some of the independent variables. For instance, low socioeconomic status is a subset (sufficient condition) of high drug count, a proxy for high morbidity (consistency 0.87). Focusing on senior care is also a sufficient condition for high drug count (consistency 0.9). All clinics with low membership (<0.2) in “low socioeconomic status” and “seniors or women” had low average drug counts. Urban location is a superset (necessary condition) of “low socioeconomic status” (consistency 1.0) and poor patient communication (consistency 0.94). Low socioeconomic status is a subset (sufficient condition) of not receiving enough information (consistency 0.85); and “not low” socioeconomic status is a superset (necessary condition) of good (enough and timely) patient communication (consistency 0.86).
Fuzzy set truth table analyses
FSTTA was used to evaluate set-theoretical relationships between the outcomes and different combinations of the “necessary” conditions according to the models enumerated in Table 2. Table 4 shows FSTTA results for the seven models.
Table 4.
Fuzzy Set Truth Table Analysis Results
| Model | Outcome | Conditions | Solution | Consistency | Raw Cover-Age | Unique Cover-Age |
|---|---|---|---|---|---|---|
| 1 | Low ODC | Provider reporting | Weak provider reporting AND Low SES, OR | 0.99 | 0.29 | 0.22 |
| Low SES | Strong provider reporting AND Women or seniors | 0.91 | 0.31 | 0.23 | ||
| Women or seniors | ||||||
| Total recipe | 0.94 | 0.53 | ||||
| 2 | Low ODC | Team care-diabetes | Low SES, OR | 0.92 | 0.44 | 0.13 |
| Low SES | Women or seniors, OR | 0.81 | 0.36 | 0.07 | ||
| Women or seniors | Weak team care-diabetes | 0.85 | 0.48 | 0.11 | ||
| Total recipe: | 0.83 | 0.74 | ||||
| 3 | Low ODC | Provider reporting | Low SES, OR | 0.92 | 0.44 | 0.13 |
| Team care-diabetes | Women or seniors, OR | 0.81 | 0.36 | 0.07 | ||
| Low SES | Weak team care-diabetes | 0.85 | 0.48 | 0.11 | ||
| Women or seniors | ||||||
| Total recipe: | 0.83 | 0.74 | ||||
| 4 | Low PSUTD | Provider reporting | BMI, OR | 0.82 | 0.64 | 0.22 |
| Low SES | Not enough info AND Women or seniors, OR | 0.93 | 0.33 | 0.08 | ||
| Women or seniors | Not enough info AND Low SES, OR | 0.87 | 0.39 | 0.04 | ||
| BMI | Weak provider reporting AND Enough information AND NOT Women or seniors | 0.93 | 0.26 | 0.01 | ||
| Not enough information | ||||||
| Total recipe: | 0.83 | 0.81 | ||||
| 5 | Low PSUTD | Preventive services | BMI, OR | 0.82 | 0.64 | 0.19 |
| Low SES | Not enough information AND Women or seniors, OR | 0.93 | 0.33 | 0.06 | ||
| Women or seniors | Not enough information AND Low SES, OR | 0.87 | 0.39 | 0.06 | ||
| BMI | Weak preventive services AND Enough information AND NOT Women or seniors | 0.95 | 0.29 | 0.02 | ||
| Not enough information | ||||||
| Total recipe: | 0.82 | 0.82 | ||||
| 6 | Low PSUTD | Provider reporting | BMI, OR | 0.82 | 0.64 | 0.19 |
| Preventive services | Not enough information AND Women or seniors, OR | 0.93 | 0.33 | 0.06 | ||
| Low SES | Not enough information AND Low SES, OR | 0.87 | 0.39 | 0.04 | ||
| Women or seniors | Weak provider reporting AND Enough information AND NOT Women or seniors, OR | 0.93 | 0.26 | 0.01 | ||
| BMI | Weak preventive services AND Strong provider reporting | 0.91 | 0.24 | 0.02 | ||
| Not enough information | ||||||
| Total recipe: | 0.81 | 0.83 | ||||
| 7 | NOTRECOMMEND | Provider reporting | Weak provider reporting AND NOT Women or seniors, OR | 0.96 | 0.42 | 0.1 |
| Low SES | Communication problems AND NOT Women or seniors | 0.92 | 0.66 | 0.25 | ||
| Women or seniors | Strong provider reporting AND Women or seniors AND NOT Low SES | 0.89 | 0.26 | 0.04 | ||
| Communication problems | ||||||
| Total recipe: | 0.88 | 0.82 |
The solution (or “causal” recipe) for each model is made up of a series of configurations, each of which is a sufficient condition for the outcome. For example, the solution for model 1 is interpreted as follows: (weak provider reporting AND low socioeconomic status) OR (strong provider reporting AND specializing in geriatrics or women's health) are each SUFFICIENT CONDITIONS for low ODC scores. Each sufficient configuration has a consistency, raw coverage, and unique coverage. The overall solution for each model also has a consistency and a coverage.
SES, socioeconomic status.
Optimal Diabetes Care
Model 1 yielded a recipe suggesting that weak provider performance reporting capabilities contribute to low ODC scores in clinics with low socioeconomic status patients, and that clinics specializing in the care of women or seniors tend to have low ODC scores despite strong provider performance reporting capabilities (consistency 0.94; coverage 0.53). Model 2 substituted diabetes team care for provider reporting and yielded a recipe suggesting that patients with low socioeconomic status, specializing in geriatrics or women's health, or having weak diabetes team care capabilities are each sufficient conditions for low ODC scores (consistency 0.83; coverage 0.74). Model 3 evaluated the effect of the combination of provider reporting and diabetes team care on ODC scores and yielded the same recipe as Model 2. This suggests that diabetes team care dominates provider reporting in the analysis, and that the effect of provider reporting on ODC scores may be mediated by diabetes team care capabilities. Adding communication problems, drug count, or urban location to this model did not change the solution (data not shown).
Preventive Services
Models 4 and 5 evaluated the relationship between PSUTD and provider performance reporting capabilities and preventive services systems, respectively; Picker “enough information” problem scores, low socioeconomic status patients, high average BMI, and specializing in geriatric or women's health. Both models gave similar results. Low PSUTD scores are linked to high BMI, specializing in geriatrics or women's health coupled with patient dissatisfaction with information sharing, or low socioeconomic status coupled with patient dissatisfaction with information sharing. In general medicine clinics with low Picker “enough information” problem scores, weak provider reporting or preventive service systems are also associated with low PSUTD scores. However, the unique coverage of the configurations that include PPC-RS domains is quite low (less than or equal to 0.02), suggesting that the effect of PCMH systems on PSUTD is less important than the effect of patient population characteristics and provider communication.
Model 6 includes both provider reporting and preventive services in the analysis. The resulting recipe includes a new term, weak preventive services AND strong provider reporting, with high consistency (0.91) but low unique coverage (0.02), suggesting that in some cases the effect of provider reporting on PSUTD scores may be moderated by preventive service system capabilities.
Patient Experience
Model 7 explores the relationship between Picker “would recommend” problem scores and provider reporting, low socioeconomic status, focusing on women or seniors, and communication problems. The model yields a recipe with three configurations that are sufficient conditions for high “would recommend” problems scores (consistency 0.88; coverage 0.82): (1) general medicine clinics with either weak provider performance reporting or (2) high patient communication problem scores, and (3) clinics specializing in geriatric or women's health with “not-low” socioeconomic status, despite good provider performance reporting systems. The unique coverage of the last term in the Model 7 solution is low (0.04), indicating that the preponderant effect of focusing on women or seniors is improved patient experience.
We also found that all the clinics specializing in the care of women or seniors have low Picker problem scores with respect to patient communication. Not focusing on women or seniors is a superset of (necessary condition for) high Picker communication problem scores with consistency 0.93 and coverage 0.47. Thus, the association between patient experience and specializing in geriatric or women's health may be mediated by enhanced patient communication.
Discussion
Bivariate fs/QCA analysis revealed modest-to-strong set-theoretical relationships between a number of re-coded PPC-RS domains and ODC, PSUTD, and Picker “would recommend” problem scores. In particular, strong provider performance reporting systems is a necessary but not sufficient condition for high ODC and PSUTD scores, and low Picker “would recommend” problem scores. Provider performance reporting systems and good diabetes team care are necessary but not sufficient conditions for good ODC scores. Strong preventive services systems and provider reporting systems are necessary but not sufficient conditions for good PSUTD scores.
There are also strong set-theoretical relationships between a variety of control factors and the quality outcomes. Good socioeconomic status, low co-morbidity, and low Picker problem scores on the “enough information” and “timely follow-up” items are all necessary conditions for good ODC, PSUTD, and Picker “would recommend” problem scores. Clinics focused on seniors or women tend to have low ODC and Picker “would recommend” problem scores. The one clinic in our sample focused exclusively on women had a very high PSUTD score. However, clinics with more mixed populations enriched with women or seniors had low PSUTD scores. Large, urban clinics tend to have not only good ODC and PSUTD performance but also tend to have high Picker “would recommend” problem scores. Relationships between quality measures and clinic demographic and socioeconomic factors have been observed by others; and these findings have important implications for provider performance reporting (Hong et al. 2010).
Multivariate FSTTA demonstrated that both PCMH-related systems and other clinic characteristics are linked to quality. Strong diabetes team care, low socioeconomic status, and not focusing on women's health or geriatrics are each sufficient conditions for good ODC scores.
High average BMI or high Picker “enough information” problem scores, combined with either specializing in geriatric or women's health, or caring for patients with low socioeconomic status, are sufficient conditions for low PSUTD performance. Relative to these factors, the influence of PCMH-related systems on PSUTD is small. The alternative explanation that the influence of PCMH systems on PSUTD is mediated by the Picker “enough information” problem score is unlikely because there is no subset relationship between any of the PPC-RS domain scores and the Picker “enough information” problem score (data not shown).
The inverse association between BMI and cancer screening has been previously noted. Nonwhite race and low socioeconomic status have also been associated with lower utilization of preventive services (Fiscella et al. 2002; Sambamoorthi and McAlpine 2003). The relationship between high Picker “enough information” problem scores and low PSUTD scores seems plausible, in that adherence to preventive service recommendations likely depends on patients feeling adequately informed about the risks, benefits, and alternatives to preventive services. The ability of fs/QCA to identify these relationships in this small data set supports the validity of the method.
In general medicine clinics, high Picker “would recommend” problem scores are related to the presence of either weak provider performance reporting capabilities or problems with patient communication. The fact that low socioeconomic status does not appear in the more empirically important terms of the Model 7 solution suggests that the set relationship between socioeconomic status and Picker “would recommend” problem scores may be mediated by communication problems.
In a conventional statistical analysis, one would generally avoid including the Picker communication items in the model for “would recommend” problem scores, because of concerns about covariance. Co-occurrence of conditions invalidates the “independence” assumption of “net effects” analysis. In contrast, the configurational fs/QCA approach makes no such assumption and allows us to explore the relationship between these different aspects of patient experience.
This fs/QCA analysis identified set-theoretical relationships between PCMH capabilities and quality outcomes that were not identified as statistically significant in our prior article. In addition, fs/QCA revealed multiple configurations or combinations of conditions associated with each of the outcomes of interest (equifinality). The enhanced awareness of equifinality engendered by the use of fs/QCA fosters a perspective that is aligned with the sociology of health care service delivery. Health care organizations are complex adaptive systems manifesting circular causality, feedback loops, and other nonlinear phenomena. fs/QCA may help us tease apart this complexity in ways that conventional statistical methods based on linear additive models and “net effects thinking” cannot (Ragin 2008, pp. 176–189). fs/QCA may be especially useful for performance evaluation and improvement work, given the complex and social nature of care delivery, and the often small number of cases available for study.
fs/QCA is different from conventional statistical analysis in many respects. fs/QCA is most useful for descriptive, exploratory analysis where causality is complex, theory is weak, and models are not well specified (Ragin 2008, pp. 176–182). Readers used to the norms of statistical inference may be concerned about how the validity of fs/QCA results is established, especially with the use of multiple comparisons and in the absence of p-values. With fs/QCA, the consistency of the set-theoretical relationship is analogous to the p-value. Consistency greater than 0.90 indicates a strong, empirically significant set relationship, much as a p-value less than 0.05 indicates a low probability that the findings in a conventional statistical analysis are a chance observation. Nevertheless, given that there is a small likelihood of observing a high-consistency set relationship when there actually is none, multiple comparisons can be problematic in fs/QCA, too. Ultimately, the validity of our results is best established by reproducing them in other groups of clinics.
Our study has some limitations as an fs/QCA study. In general, the calibration of the measures used in this study was not anchored to explicit external standards. This occurred in part because the available data were generated with a standard quantitative “net-effects” model in mind, rather than a configurational approach. Also, the external standards with which to calibrate concepts like clinic-level average patient socioeconomic status in many cases do not yet exist. In this sense, our study contributes to the “calibration” evidence base. Use of different fuzzy set membership functions or calibration criteria could alter our findings. However, our ability to demonstrate well-established associations (e.g., between BMI and PSUTD) supports the validity of the analysis.
Finally, this study was originally designed not as a case study but rather as a variable-oriented, linear, net-effects analysis; and the PPC-RS was not designed with fs/QCA in mind. Future research on medical homes should include case studies using data collection methods designed to facilitate a substantive or theoretically based approach to membership function selection and calibration.
This work also has implications for the design of future versions of the PPC-RS survey and PPC-PCMH program. In particular, program components and survey items related to provider reporting, team care, and preventive services delivery should be retained and possibly expanded. Given the association between PSUTD and low “enough information” problem scores, additional items addressing systems to assure the adequacy of provider-patient communication are likely to add value. We would note that the 2011 version of the PCMH evaluation tool from NCQA will include a voluntary module (which may be made mandatory in the future) that requires use of a standardized patient survey (the PCMH-CAHPS survey) addressing, in part, the adequacy of provider-patient interaction.
Another limitation of this study is that the 21 clinics included in the analysis are relatively homogenous (all NCQA Level III medical homes from the same care delivery system). Moreover, these clinics have achieved substantial improvement in both ODC and PSUTD outcomes in recent years. Consequently, the range of variation in ODC and PSUTD performance in these clinics is not likely to be representative of other communities; and our study was not able to assess the factors that contributed to this initial improvement. These issues may have reduced our ability to assess the effect of PCMH-related systems. It would be interesting to apply this approach to a more diverse set of clinics.
However, we still observed considerable differences in quality outcomes between the clinics in this study. The PPC-RS may not fully assess all of the organizational, team, or individual provider characteristics that influence these outcomes. For instance, the PPC-RS is not designed or intended to directly evaluate phenomena like team reflexivity that have been shown in health care and other settings to be related to team performance (Gittell et al. 2000; Miller et al. 2001; Stroebel et al. 2005; Gurtner et al. 2007; Suchman 2010). The association of patient communication problems with poor PSUTD and patient experience outcomes in the absence of low PPC-RS domain scores suggests that good performance on the PPC-RS survey is alone not sufficient to produce the desired outcomes, and it underscores the importance of other practice factors not measured by the PPC-RS.
The PCMH capabilities of the clinics studied were assessed by obtaining one survey response per clinic. Inaccurate information may have been provided, which could have affected our assessment of the effect of PPS-RS domains on the quality measures. A prior study has shown considerable variability in respondent accuracy when compared to audited results (Scholle et al. 2008). There has been some divergence between the PPC-RS survey we used and the evolving PPC-PCMH program: but we do not think that was an important limitation in this study. Future studies, however, should use an updated survey to evaluate the fidelity of PCMH implementation. The PPC-RS scoring method we used was based on plausible theory, but it has not been evaluated with methods such as factor analysis and may have influenced our results. Future versions of the PPC-RS survey should be evaluated rigorously to determine the most appropriate method for grouping and scoring items.
Conclusions
In this study of 21 Level III PCMH clinics, fs/QCA identified set-theoretical relationships between PCMH-related systems capabilities and quality outcomes that were not statistically significant using conventional analysis. In general medicine clinics, poorer ODC performance is linked with weak team-based care and provider performance reporting systems; weak provider performance reporting capabilities and preventive services support systems are related to poor preventive service delivery; and weak provider performance reporting is connected with high Picker “would recommend” problem scores.
fs/QCA also showed that clinic demographic characteristics, especially socioeconomic status and specializing in the care of women or seniors, are strongly related to clinic performance on optimal diabetes care, preventive service delivery, and patient experience. Problems with information sharing and timely follow-up with patients are linked to weak preventive service delivery and high Picker “would recommend” problem scores. High average BMI is associated with poor preventive service delivery.
Congruence between these latter findings and the existing health services literature supports the validity of the fs/QCA method, which appears to be a useful analytic method for evaluating small-N, qualitative case study data sets in health services research.
Acknowledgments
Joint Acknowledgment/Disclosure Statement: This work was supported by the Agency for Healthcare Research and Quality, Contract no. HHSA290 2007 10010 TO 4. Marcus Thygeson was supported by a medical fellowship from the Bush Foundation. L. Greg Pawlson was, and Sarah Scholle is, employed by the National Commission on Quality Assurance, which administers and receives compensation for the PPC-PCMH program.
Disclosures: None.
Disclaimers: None.
SUPPORTING INFORMATION
Additional supporting information may be found in the online version of this article:
Appendix SA1: Author Matrix.
Please note: Wiley-Blackwell is not responsible for the content or functionality of any supporting materials supplied by the authors. Any queries (other than missing material) should be directed to the corresponding author for the article.
References
- Britt DW. A Qualitative Comparative Analysis of the Conditions Affecting Early Maternal Transfer Patterns. Journal of Telemedicine and Telecare. 2006;12(8):392–5. doi: 10.1258/135763306779378753. [DOI] [PubMed] [Google Scholar]
- Britt DW, Evans MI. Sometimes Doing the Right Thing Sucks: Frame Combinations and Multi-Fetal Pregnancy Reduction Decision Difficulty. Social Science & Medicine. 2007;65(11):2342–56. doi: 10.1016/j.socscimed.2007.06.026. [DOI] [PubMed] [Google Scholar]
- Cohen SS, Palmieri RT, Nyante SJ, Koralek DO, Kim S, Bradshaw P, Olshan AF. Obesity and Screening for Breast, Cervical, and Colorectal Cancer in Women: A Review. Cancer. 2008;112(9):1892–904. doi: 10.1002/cncr.23408. [DOI] [PubMed] [Google Scholar]
- Dy SM, Garg P, Nyberg D, Dawson PB, Pronovost PJ, Morlock L, Rubin H, Wu AW. Critical Pathway Effectiveness: Assessing the Impact of Patient, Hospital Care, and Pathway Characteristics Using Qualitative Comparative Analysis. Health Services Research. 2005;40(2):499–516. doi: 10.1111/j.1475-6773.2005.00369.x. [DOI] [PMC free article] [PubMed] [Google Scholar]
- Fiscella K, Franks P, Doescher MP, Saver BG. Disparities in Health Care by Race, Ethnicity, and Language among the Insured: Findings from a National Sample. Medical Care. 2002;40(1):52–9. doi: 10.1097/00005650-200201000-00007. [DOI] [PubMed] [Google Scholar]
- Fiss PC. A Set-Theoretic Approach to Organizational Configurations. Academy of Management Review. 2007;32(4):1180–98. [Google Scholar]
- Gittell JH, Fairfield KM, Bierbaum B, Head W, Jackson R, Kelly M, Laskin R, Lipson S, Siliski J, Thornhill T, Zuckerman J. Impact of Relational Coordination on Quality of Care, Postoperative Pain and Functioning, and Length of Stay: A Nine-Hospital Study of Surgical Patients. Medical Care. 2000;38(8):807–19. doi: 10.1097/00005650-200008000-00005. [DOI] [PubMed] [Google Scholar]
- Gurtner A, Tschan F, Semmer NK, Nägele C. Getting Groups to Develop Good Strategies: Effects of Reflexivity Interventions on Team Process, Team Performance, and Shared Mental Models. Organizational Behavior and Human Decision Processes. 2007;102:127–42. [Google Scholar]
- Hong CS, Atlas SJ, Chang Y, Subramanian SV, Ashburner JM, Barry JJ, Grant RW. Relationship between Patient Panel Characteristics and Primary Care Physician Clinical Performance Rankings. Journal of the American Medical Association. 2010;304(10):1107–13. doi: 10.1001/jama.2010.1287. [DOI] [PubMed] [Google Scholar]
- Joint Principles of the Patient-Centered Medical Home. American Academy of Family Physicians (AAFP); American Academy of Pediatrics (AAP); American College of Physicians (ACP); American Osteopathic Association (AOA); 2007. Available at http://www.pcpcc.net/content/joint-principles-patient-centered-medical-home. [Google Scholar]
- Maruther NM, Bolen S, Brancati FL, Clark JM. Obesity and Mammography: A Systematic Review and Meta-Analysis. Journal of General Internal Medicine. 2009a;24(5):665–77. doi: 10.1007/s11606-009-0939-3. [DOI] [PMC free article] [PubMed] [Google Scholar]
- Maruther NM, Bolen SD, Brancati FL, Clark JM. The Association of Obesity and Cervical Cancer Screening: A Systematic Review and Meta-Analysis. Obesity. 2009b;17(2):375–81. doi: 10.1038/oby.2008.480. [DOI] [PMC free article] [PubMed] [Google Scholar]
- Miller WL, McDaniel RR, Jr, Crabtree BF, Stange KC. Practice Jazz: Understanding Variation in Family Practices Using Complexity Science. Journal of Family Practice. 2001;50:872–78. [PubMed] [Google Scholar]
- Østbye T, Taylor DH, Jr, Yancy WS, Jr, Krause KM. Associations between Obesity and Receipt of Screening Mammography, Papanicolaou Tests, and Influenza Vaccination: Results from the Health and Retirement Study (HRS) and the Asset and Health Dynamics among the Oldest Old (AHEAD) Study. American Journal of Public Health. 2005;95(9):1623–30. doi: 10.2105/AJPH.2004.047803. [DOI] [PMC free article] [PubMed] [Google Scholar]
- Ragin C. The Comparative Method: Moving Beyond Qualitative and Quantitative Strategies. Berkeley and Los Angeles, CA: The University of California Press; 1987. [Google Scholar]
- Ragin C. Using Qualitative Comparative Analysis to Study Causal Complexity. Health Services Research. 1999;34(5 Pt. II):1225–39. [PMC free article] [PubMed] [Google Scholar]
- Ragin C. Fuzzy-Set Social Science. Chicago and London: The University of Chicago Press; 2000. [Google Scholar]
- Ragin C. Redesigning Social Inquiry: Fuzzy Sets and Beyond. Chicago and London: The University of Chicago Press; 2008. [Google Scholar]
- Ragin C. Qualitative Comparative Analysis Using Fuzzy Sets (fsQCA) In: Rihoux B, Ragin CC, editors. Configurational Comparative Methods: Qualitative Comparative Analysis and Related Techniques. Thousand Oaks, CA: SAGE Publications, Inc; 2009. pp. 87–121. [Google Scholar]
- Rittenhouse DR, Shortell SM. The Patient-Centered Medical Home: Will It Stand the Test of Health Reform? Journal of the American Medical Association. 2009;301(19):2038–40. doi: 10.1001/jama.2009.691. [DOI] [PubMed] [Google Scholar]
- Road to Recognition: Your Guide to the NCQA Medical Home. Leawood, KS: American Academy of Family Physicians; 2009. [Google Scholar]
- Sambamoorthi U, McAlpine DD. Racial, Ethnic, Socioeconomic, and Access Disparities in the Use of Preventive Services among Women. Preventive Medicine. 2003;37(5):475–84. doi: 10.1016/s0091-7435(03)00172-5. [DOI] [PubMed] [Google Scholar]
- Schensul JJ, Chandran D, Singh SK, Berg M, Singh S, Gupta K. The Use of Qualitative Comparative Analysis for Critical Event Research in Alcohol and HIV in Mumbai, India. AIDS Behavior. 2010;14(Suppl. 1):S113–S125. doi: 10.1007/s10461-010-9736-6. [DOI] [PMC free article] [PubMed] [Google Scholar]
- Scholle SH, Pawlson LG, Solberg LI, Shih SC, Asche SE, Chou AF, Thoele MJ. Measuring Practice Systems for Chronic Illness Care: Accuracy of Self-Reports from Clinical Personnel. The Joint Commission Journal on Quality and Patient Safety. 2008;34(7):407–16. doi: 10.1016/s1553-7250(08)34051-3. [DOI] [PubMed] [Google Scholar]
- Shanahan MJ, Vaisey S, Erickson LD, Smolen A. Environmental Contingencies and Genetic Propensities: Social Capital, Educational Continuation, and Dopamine Receptor Gene DRD2. American Journal of Sociology. 2008;114(Suppl):S260–S286. doi: 10.1086/592204. [DOI] [PubMed] [Google Scholar]
- Solberg LI, Asche SE, Pawlson G, Scholle SH, Shih SC. Practice Systems Are Associated with High-Quality Care for Diabetes. The American Journal of Managed Care. 2008;14(2):85–92. [PubMed] [Google Scholar]
- Solberg LI, Asche SE, Fontaine P, Flottemesch TJ, Pawlson LG, Scholle SH. Relationship of Clinic Medical Home Scores to Quality and Patient Experience. Journal of Ambulatory Care Management. 2011;34(1):57–66. doi: 10.1097/JAC.0b013e3181ff6faf. [DOI] [PubMed] [Google Scholar]
- Stroebel CK, McDaniel RR, Crabtree BF, Miller WL, Nutting PA, Stange KC. How Complexity Science Can Inform a Reflective Process for Improvement in Primary Care Processes. Joint Commission Journal on Quality and Patient Safety. 2005;31(8):438–46. doi: 10.1016/s1553-7250(05)31057-9. [DOI] [PubMed] [Google Scholar]
- Suchman AL. Organizations as Machines, Organizations as Conversations: Two Core Metaphors and Their Consequences. Medical Care. 2010;48(12):1–6. doi: 10.1097/MLR.0b013e3181d55a05. [DOI] [PubMed] [Google Scholar]
- Wagemann C, Schneider CQ. Standards of Good Practice in Qualitative Comparative Analysis (QCA) and Fuzzy-Sets. 2007. Compasss Working Paper, WP2007-51. Available at http://www.compasss.org/files/WPfiles/WagemannSchneider2007.pdf.
Associated Data
This section collects any data citations, data availability statements, or supplementary materials included in this article.