Abstract
A special challenge arises when pursuing multi-wavelength imaging of retinal tissue in vivo, because the eye’s optics must be used as the main focusing elements, and they introduce significant chromatic dispersion. Here we present an image-based method to measure and correct for the eye’s transverse chromatic aberrations rapidly, non-invasively, and with high precision. We validate the technique against hyperacute psychophysical performance and the standard chromatic human eye model. In vivo correction of chromatic dispersion will enable confocal multi-wavelength images of the living retina to be aligned, and allow targeted chromatic stimulation of the photoreceptor mosaic to be performed accurately with sub-cellular resolution.
OCIS codes: (110.1080) Active or adaptive optics; (130.2035) Dispersion compensation devices; (170.5810) Scanning microscopy; (330.5510) Psychophysics; (330.7327) Visual optics, ophthalmic instrumentation
1. Introduction
Every advance in imaging the retina in the living eye has increased our understanding of how vision works and how diseases undermine our ability to see. To progress even further and probe the basis of visual function and dysfunction at the cellular level in vivo, diffraction-limited imaging of the retina is essential. However, the eye’s optics are relatively poor, as they introduce high-order aberrations that interfere with high-resolution imaging [1]. Adaptive optics ophthalmoscopy has been successful in overcoming these limits imposed by ocular aberrations, and presently enables imaging of both rod and cone photoreceptors in the human eye [2,3]. Eye motion is also a persistent problem for retinal imaging, and has been compensated successfully [4]. However, all these methods are essentially based on monochromatic light, and with the chromatic dispersion caused by the ocular media, it still remains difficult to control light delivery of different wavelengths to targeted locations on the retina. Correcting for chromatic dispersion could offer sub-cellular light delivery with different wavelengths, if accomplished with sufficient precision. Such a capability would be also valuable for color vision research [5], for fluorescence ophthalmoscopy (e.g. in animal disease models [6]), and for targeted delivery of therapeutic laser pulses [7].
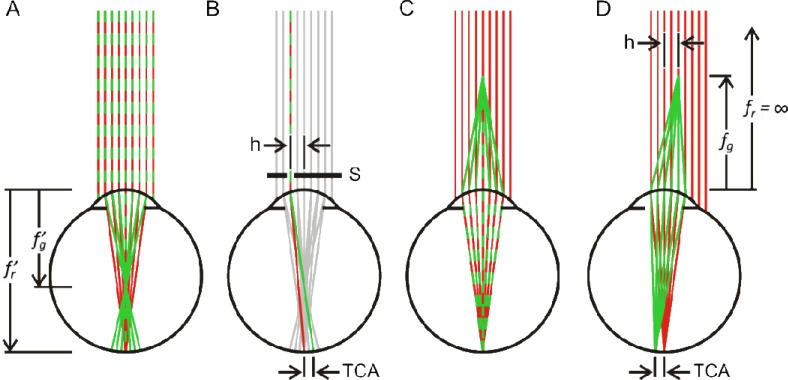
To correct for the chromatic dispersion of the eye, two optical parameters must be taken into account: longitudinal chromatic aberration (LCA) and transverse chromatic aberration (TCA). Multi-wavelength light originating from a single point will strike the retina with poor focus due to LCA, and in different locations because of TCA (Figs. 1(A) , 1(B)). It has been shown that LCA in the human eye is relatively consistent between individuals [8], and thus can be well corrected by suitable positioning of an instrument’s optics for the wavelengths of interest (Fig. 1(C)). TCA correction is much more challenging because it depends on the position of the imaging beam relative to the pupil (Fig. 1(D)) and to the achromatic axis of the eye [9,10]. Because the eye is in constant motion, even when a person attempts to steadily fixate [11,12], TCA is always changing. Hence, controlled multi-wavelength light delivery in the living eye hinges on measuring and correcting TCA rapidly and with high fidelity.
Fig. 1.
Emergence of transverse chromatic aberration (TCA) when longitudinal chromatic aberration (LCA) is corrected. (A) Due to the eye’s chromatic dispersion, its refractive power and hence image focal length, f′, is a function of wavelength. (B) The effects of TCA can be observed if a multi-wavelength object is viewed through an aperture, S, that is laterally offset by h. (C) For light sources with different wavelengths, LCA can be corrected by adjusting the object divergence angle, or object focal length, f, such that objects are in focus for each wavelength. (D) If the eye and thus the entrance pupil are translated laterally relative to the chief ray by the amount h, retinal images will be offset by the same amount as in B, but with opposite sign. We refer to these chromatic parallax offsets as ‘TCA offsets’ within this paper. Colors indicate wavelength relation. Individual parts not drawn to scale.
We designed an adaptive optics scanning laser ophthalmoscope (AOSLO) to employ three different wavelength bands, centered on 543, 711, and 842 nm (hereafter referred to as green, red and infrared, respectively) for multi-wavelength retinal imaging. Because light of each wavelength was optically divided into separate delivery and detection stages, retinal images created by the three wavelengths could be recorded simultaneously, and visual stimuli could be delivered independently. While correction of LCA produced well-focused images of the cone photoreceptor mosaic for all three wavelengths, TCA and instrument misalignments between the wavelengths caused the images to be laterally offset from one another. Here, we describe a method to measure and correct these offsets.
2. Methods
2.1 Multi-wavelength retinal imaging and stabilized light delivery
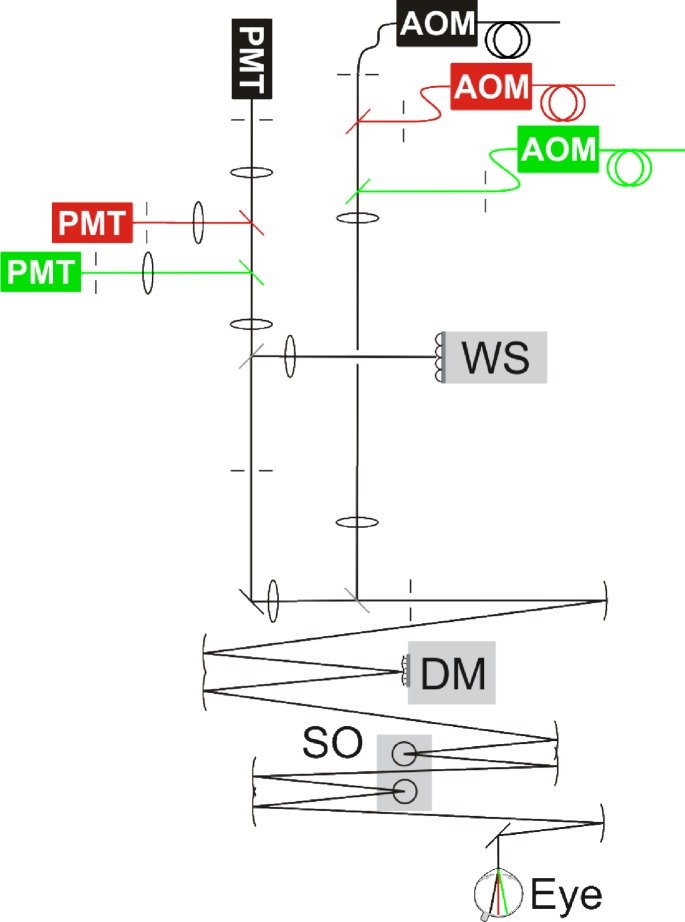
Detailed descriptions of AOSLO imaging and stimulus delivery have been published elsewhere [13,14]. Briefly, en face retinal images were recorded by two-dimensional scanning of a point light source across a small region of the retina while the eye’s optical aberrations are corrected by adaptive deflections of a deformable mirror (Fig. 2 ). Ocular wave aberrations were measured over a 6 mm pupil and corrected in closed-loop with a 5.5-µm stroke MEMS (micro-electro-mechanical system) deformable mirror (Multi-DM, Boston Micromachines Corp, Cambridge, MA). For the infrared imaging wavelength (842 ± 25 nm), the reflected light was collected continuously by a photomultiplier tube (PMT), whose voltage output was used to construct a 30 Hz video stream of 512 × 512 pixel confocal retinal images. Fixational eye movements were cancelled by spatially stabilizing single video frames in real time. In this stabilized display, retinal locations can be selected for visual stimulation [4].
Fig. 2.
Schematic of a 3-channel AOSLO, with separate light delivery and detection for each color channel: infrared (drawn in black), red and green. AOM: acousto-optic modulator, WS: Shack-Hartmann wavefront sensor, DM: deformable mirror, SO: scanning optics, PMT: photo-multiplier tube. Broken lines: apertures and pinholes. Curved lines: spherical front-surface mirrors. Straight lines: flat mirrors or beam splitters.
A super-continuum laser source (SuperK Extreme, NKT Photonics Inc.) provided light for the 842 nm imaging channel as well as the red (711 ± 12 nm) and green (543 ± 11 nm) channels used for stimulation. Separation of these bands was done by serial dichroic and bandpass filtering of the collimated laser beam. To allow for independent modulation and focusing of the colored channels, each wavelength band was passed through its own acousto-optic modulator (Brimrose Corporation, Sparks, MD) and was recombined with the infrared imaging beam via dichroic filters. Visual stimuli could be delivered to targeted locations by temporally registered, 10-bit modulation of the stimulation beams. Reflected light from each stimulation channel was then detected by dedicated PMTs to build images based on red or green light. In this way, retinal images created by all three wavelengths could be recorded simultaneously and visual stimuli could be delivered separately.
2.2 Measurement and correction of chromatic aberrations
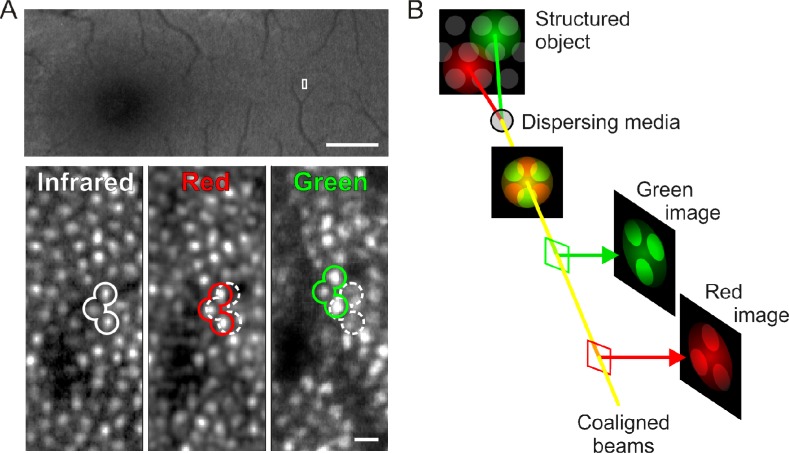
Longitudinal chromatic aberrations (LCA) were corrected by static adjustment of the focus of the infrared and green light source relative to the red source prior to entering the eye, using a theoretical fit to compiled human population data [8, Eq. 5(a)]. By selecting the red channel to be emmetropic in the system, we minimized the relative defocus between channels. For the chosen wavelengths, and expressed in difference of refraction, this correction was −0.69 diopters for the green, and + 0.30 diopters for the infrared channel. LCA correction produced well-focused retinal images across channels in all tested eyes (Fig. 3(A) ), as predicted by empirical and theoretical models of chromatic dispersion in human eyes [8].
Fig. 3.
Chromatic dispersion in AOSLO imaging. (A) When LCA is corrected, retinal images for all wavelengths (infrared, red, green) are in focus but offset laterally due to TCA. The imaged area of the retina is outlined on the fundus photograph (top). TCA offsets between colors are highlighted with example cone outlines. Dark regions in the AOSLO microphotographs are caused by blood capillary shadows. Cone images are constructed by referenced averaging of ~150 individual video frames, and are individually normalized for display purposes. Scale bar: 2 deg (top), 2 arcmin (bottom). (B) Schematic explanation of chromatic offsets in AOSLO imaging. Two aligned input beams (red and green) reach a dispersing lens and land at different locations on the retina. The reflected light, passing back through the lens, is realigned into one beam and is captured by two imaging devices. Although the effects of TCA are cancelled on the second pass through the lens and the outward beams are re-aligned, one can determine how much dispersion occurred between the two beams, because the retina being imaged has spatial structure. This principle holds for our three wavelength AOSLO setup.
The relative image offsets caused by transverse chromatic aberrations (TCA) are primarily due to misalignment of the imaging beam relative to the eye’s achromatic axis, along which TCA is zero by definition (see Fig. 1). However, finding the achromatic axis is quite challenging. It is known that the exact position of the achromatic axis relative to the pupil center is highly idiosyncratic, and therefore has to be found empirically for every eye [15,16]. Another source of chromatic offset is the optical misalignments of the three wavelength channels in the AOSLO itself, offsets that are technically difficult to eliminate completely. Instead of trying to pinpoint the achromatic axis and align all the beams to it, we took a simpler approach and measured the offsets caused by TCA and beam misalignments in the resulting images directly. Image offsets measured in such a way are independent of the actual beam paths and placement of the detectors, because the offsets are generated on the retina and are thus preserved as spatial information in the acquired images (Fig. 3(B)). It also has to be noted that insufficient correction of LCA would lead to a change in the detected lateral image offsets, because the effects of LCA and TCA on image formation are intertwined. Nevertheless, the method is able to pick up the true image offsets as a combination of ocular TCA, lateral offsets due to any residual LCA, and instrument offsets. For clarity, and because the other factors have been minimized, we refer to these image offsets as simply TCA throughout the paper.
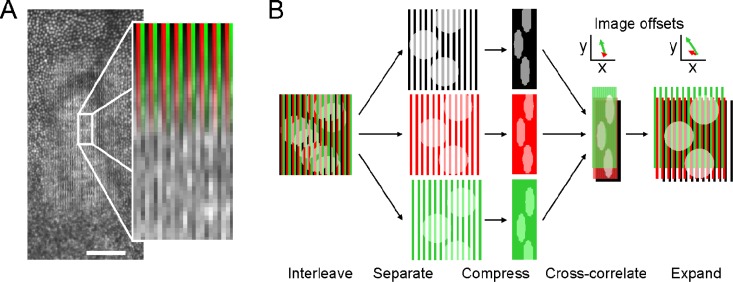
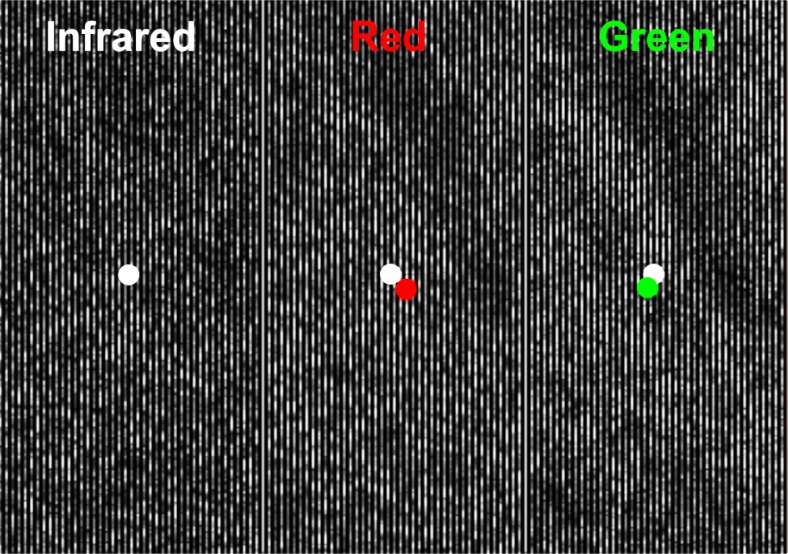
Retinal images were acquired with a spatially interleaved recording technique (Fig. 4(A) and Fig. 5 , Media 1 (3.6MB, AVI) ). A set of three interleaved 42 × 256 (width × height) pixel lines, corresponding to the three wavelengths, was presented over a single 126 × 256 pixel area on the retina (equaling about 18 × 36 arcmin for the 1.2 deg field used). By interleaving the three wavelengths, image content for each wavelength was recorded in a single frame, eliminating the need to synchronize between multiple image streams or to correct for eye movements that occur if the images were acquired for each wavelength in temporal succession. Next, images derived from single wavelengths were assembled by de-interleaving the multi-wavelength image and compressing along the interleave dimension to yield three 42 × 256 images (Fig. 4(B)).
Fig. 4.
TCA measurement and correction. A) Retinal images for each color channel are recorded interleaved as shown. B) The interleaved composite image is separated into each color channel and then spatially compressed along the horizontal axis. These single images are registered by two-dimensional cross-correlation to find their relative offsets. The true horizontal image offsets in the original images are found by expanding along the compression axis (see text). Scale bar: 10 arcmin. Colors are used for clarity only.
Fig. 5.
Multi-wavelength interleaved retinal images. A single frame of interleaved recording is separated into the three color channels (infrared, red and green) as shown in Fig. 4(B). Due to the interleaving, only every third pixel line contains image information. Colored circles represent corresponding retinal locations derived from the image registration procedure detailed in Fig. 4(B). White circles are corresponding locations with respect to the frame. The reader is invited to view the corresponding video, because retinal features and relative locations are easier to appreciate in the presence of coherent motion. Note in the video how the retina is constantly moving due to small fixational eye movements, yet TCA offsets are relatively stable (Media 1 (3.6MB, AVI) ).
To extract the relative image offsets, the compressed images were registered by a discrete Fourier transformation registration algorithm with sub-pixel precision [17]. In order to account for the interleaved presentation of different wavelengths, the true horizontal offsets between the non-compressed images,and , were derived from the measured offsets, and by applying the simple linear expansion transformation, , and . For any one imaging session, the TCA offsets were calculated by averaging the offsets measured frame-by-frame from a few seconds of retinal videos. The mean offset,, was reported by finding the two-dimensional centroid across the frame-by-frame offsets. Centroids were calculated by identifying the offset coordinates corresponding to the lowest slopes in an ordered plot of the scattered offsets for the x and y dimension separately. Then, the two-dimensional median values of a fixed size window (6 pixels width) around that coordinate were computed. This procedure also minimized the influence of outliers that were due to registration artifacts. The two dimensional offsets were rounded to the nearest pixel integer, then inversed and used to displace the red and green stimulus locations relative to the infrared location which was selected in the stabilized retinal display. Because the TCA offsets are computed from overall image cross correlations, the images in each channel need not be nearly identical to compute accurate offsets. This is evident in Fig. 3, where blood vessels shadows are prominent in the green channel, yet the remaining image structure yields a correct offset calculation relative to the infrared channel.
2.3 Subjects and experimental procedures
Retinal imaging and light delivery was performed in three eyes of three male subjects with normal color vision. To ensure cycloplegia and maximum mydriasis, one drop of 1% tropicamide solution was administered to the eye 15 minutes before imaging sessions. A head-worn eye patch occluded the fellow eye. Stable head fixation was achieved by use of a bite-bar, a personalized dental impression mounted on a precision XYZ translation stage. Trial lenses were introduced into the optical path to minimize low-order ocular aberrations. Imaging and psychophysical experiments required steady fixation on a small masked LED light source viewed through a pellicle beam splitter. TCA was measured before and after the psychophysical trials, to assess potential drift. If TCA was found to shift by more than half a cone width, the data were discarded and the experiment was redone. Because the light required to generate retinal images is relatively bright (3-4 log units higher than for psychophysical testing), the subject was allowed 15 min for adaptation before psychophysical trials began. For the hyperacuity experiment, subjects were allowed to adjust the light to a level where they felt most comfortable doing the task.
Prior to use, the power levels in all three wavelengths were calibrated to ensure that exposure levels remained well below the safety thresholds established by the American National Standards Institute (ANSI 2007, Orlando: Laser Institute of America). All experimental procedures employed were approved by local authorities and adhered to the tenets of the Declaration of Helsinki.
3. Results
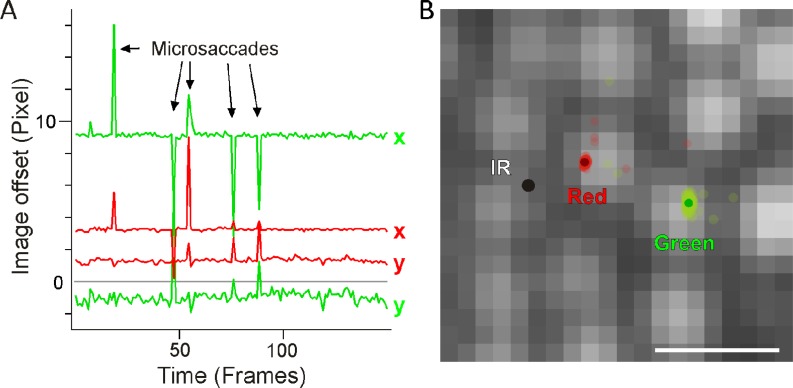
Although valid TCA measurements could be derived from each individual frame at 30 Hz, registration data was recorded over a few seconds, in order to identify registration artifacts introduced by eye blinks and microsaccades (Fig. 6(A) ). We found that image offsets between the color channels can be routinely measured with sub-pixel precision; the standard deviation of repeated measurements averaged 0.3 pixels. For the 1.2 deg field used, this error in the measurement corresponded to 2.55 arcsec of visual angle, or about one-tenth the diameter of the smallest cones in the fovea (1 arcsec equals ~80 nm of retinal space). Some of this measurement error can be attributed to a combination of small fixational drifts and ocular microtremor, with the latter causing within-frame image distortion due to its relatively high frequency [18].
Fig. 6.
Image offset measurement quality and significance. A) Frame-by-frame offsets calculated from a 5 s video. Colors code the red/infrared and green/infrared offsets, for x and y dimensions in the images. Arrows indicate artifacts introduced by microsaccades. B) The frame-by-frame offsets from A plotted to scale on the cone image relative to infrared (black dot). Here, uncorrected light delivery for the different colors would land on different cones. Image offsets were measured at ~1° eccentricity. Scale bar: 1 arcmin.
Larger errors in the registration do occur when image quality degrades. This is an unwanted situation in which image stabilization and thus targeted light delivery is also unlikely to succeed. Measurement errors increased when imaging in the foveola where photoreceptors are harder to resolve, because image cross-correlations are compromised when contrast is reduced. However, enough image structure remains when imaging at the center of gaze such that TCA measurements can be made with single cone precision (see psychophysical validation below). Outside the foveola, TCA measurements reached sub-cone precision with high accuracy because the cone mosaic is well resolved. In 3 subjects, typical TCA offsets with a centered pupil position were about 5 pixels (42 arcsec), but could easily exceed 15 pixels (2 arcmin) during any one imaging session. Thus TCA offsets are normally greater than the distance between cone centers. Without correcting for these offsets, light delivery across color channels would necessarily stimulate different photoreceptors (Fig. 6(B)).
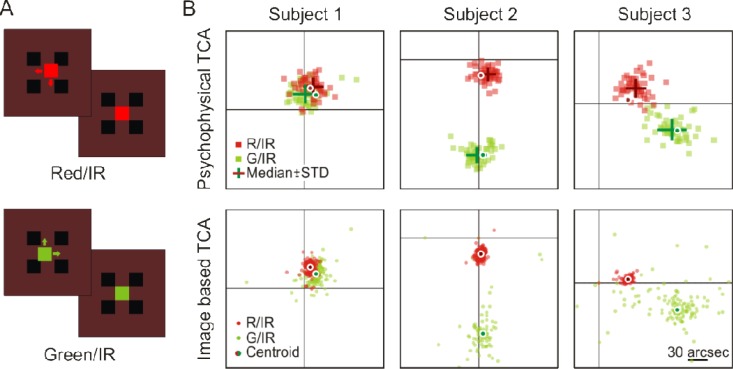
To confirm the validity of the image-based TCA measurements, we compared these data to a subject’s ability to assess the positional offset of differently colored squares at the fovea. We made use of the exquisite sensitivity of the human visual system to detect offsets in the relative position of visual objects, a feat termed hyperacuity, because psychophysical thresholds in such tasks are lower than the sampling capacities of the cone photoreceptor lattice [19]. Subjects were asked to center a 7 arcmin square (either red or green, tested separately) with respect to four equally sized and spaced stationary squares displayed in the infrared channel (Fig. 7(A) ). To allow for the most accurate alignments, stimuli were presented foveally and the task was self-paced. In theory, subjective alignments between channels and our objective TCA measurements should be identical. For all three subjects, the differences between objective and subjective TCA measurements were small (Fig. 7(B)). On average the difference was 0.95 pixels (8 arcsec). These differences are most likely due to residual system alignment offsets that exist between the light delivery and collection arms of the AOSLO; such system offsets are technically difficult to eliminate. The standard deviation of the objective measurement was consistent across subjects, and always lower than that of the psychophysical results (average SD in pixels, 1.03 objectively, 1.76 subjectively, equaling 8.8 and 15 arcsec, respectively). This demonstrates that the image-based TCA measurements presented here are functionally identical to that of conventional subjective TCA measurements [9,10,20].
Fig. 7.
Validation by hyperacute psychophysics. A) The psychophysical task required subjects to align a small colored square (red or green) within four flankers presented against the IR background (dark red). Each of 50 trials began with the colored square randomly displaced. Colors in this schematic were chosen to resemble actual appearance. B) Subjective, psychophysical measurements (top row) are compared to the objective, image-based TCA measurements (bottom row) in three subjects. Single alignment trials are plotted as colored squares; the medians ± 1 SD are plotted in darker color as crosses. Small dots represent 150 frame-by-frame measurements of red/IR and green/IR TCA offsets measured at the site of preferred fixation in the foveola. Large dots represent the data centroids. Black crosshair is IR zero reference point. Note the idiosyncratic differences in foveal TCA between subjects. The image-based centroid is copied onto the psychophysical data for comparison. Scale bar: 30 arcsec.
The wide variation in TCA offsets present between subjects (Fig. 7(B)) is mostly due to misalignment of the instrument beam relative to the achromatic axis of each subject’s eye. In subject S1, for instance, the imaging beam appeared to be very close to the achromatic axis, because the TCA offsets were relatively small. One could eliminate these offsets by adjusting the pupil position using the method described below, if measurements were taken both vertically and horizontally. However, given the large pupil requirement for AO, it is possible that no pupil position adjustments could eliminate the resulting chromatic offsets, especially if the measurements are being done in the periphery. It is worth reiterating that this image-based method measures the combined offsets caused by dispersion as well as beam misalignment, and both need to be compensated.
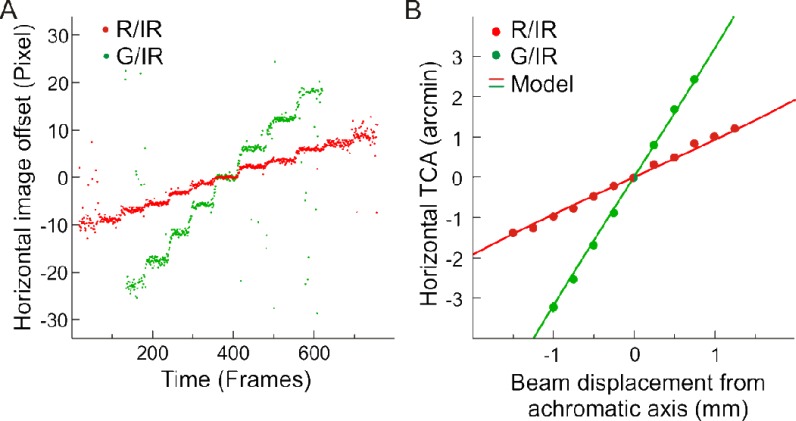
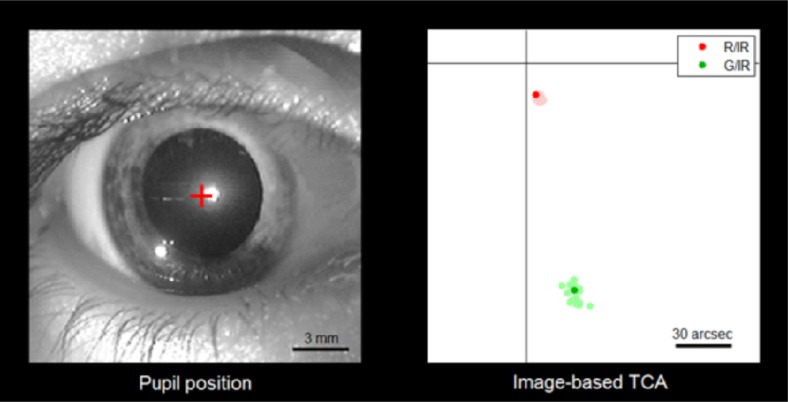
Inferred from geometrical optics, the predominant factor contributing to TCA offsets in an LCA corrected imaging system are positional shifts of the pupil relative to the imaging beam (Fig. 1). We therefore used systematic pupil shifts to independently validate the image-based TCA measurements. To do this, we manipulated the beam position relative to the entrance pupil by moving the subject’s head horizontally in 0.25 mm steps and recorded the red and green channel TCA continuously (Fig. 8(A) ). For each horizontal step we averaged the TCA values for 20 consecutive video frames. The results of these measurements agree with theoretical TCA values in the standard chromatic model eye [21] (Fig. 8(B)). Notably, lateral pupil displacements as small as 0.25 mm produce changes in TCA for the green channel that are about twice as large as the smallest cones in the fovea. These results emphasize how small pupil displacements, as they occur during gaze shifts or head movements, are a major cause of sizable dynamic changes in TCA offsets (Fig. 9 , Media 2 (2.9MB, AVI) ). As a practical note, as long as the bite bar position and fixation point were not changed, TCA measurements with practiced subjects going in and out of position did not shift by more than 1 or 2 pixels (measured over a time span of 1-1.5 hours).
Fig. 8.
Validation by geometrical optics. A) Frame-by-frame TCA measurement while the pupil was shifted horizontally in 0.25 mm steps relative to beam center. B) The mean horizontal offset per step (dots) is plotted over theoretical calculation of TCA (lines) derived from the standard chromatic model eye [21]. All SDs were smaller than dot size.
Fig. 9.
TCA changes due to gaze shifts. Left: The subject’s pupil during image-based TCA measurements. The subject performs voluntary gaze shifts while fixating the four corners of the imaging field, corresponding to 1.2 deg of visual angle between each shift. The center of the pupil (red cross) moves about 0.25 mm for each shift. Corneal reflexes originate from the AOSLO’s imaging beam (center) and a red LED (bottom left), serving as additional light source for pupil videography only. Right: Synchronous recording of imaged-based TCA. Colored dots represent the frame-by-frame two-dimensional image offsets between the infrared/red and infrared/green channels, respectively. Offsets for the current frame are plotted in darker color. The scale bar roughly equals the diameter of a foveal cone (30 arcsec) (Media 2 (2.9MB, AVI) ).
4. Discussion
Microscopic imaging of the living retina is challenging, primarily because the retina has to be viewed through the imperfect optics of the eye itself. The use of adaptive optics has proven to correct these imperfections, to the point where the individual photoreceptors become accessible to further study [22]. In the AOSLO, techniques have been developed that allow simultaneous imaging and targeted light delivery with high spatial resolution, offering unprecedented stimulus control in physiological and psychophysical studies of vision [23,24].
Despite this level of capability, the use of monochromatic light as implemented in previous instruments has a number of disadvantages, especially for psychophysical studies. The primary drawback is that the stimulation wavelength must be the same as the near-infrared imaging wavelength, which is quite far from the peak sensitivities of both rod and cone photoreceptors [25–27]. For the 840 nm light used here, visual stimuli will thus lead to responses that are heavily weighted towards L cones over M and S cones. Because the L/M cone ratio varies so widely in normal subjects [5], L cone weighted stimuli could easily lead to disparate psychophysical results depending on the task. In addition, 840 nm stimulation generally has to employ luminance decrements, that is, dark stimuli on a reddish background. Such stimuli are not very suitable for tests of visual sensitivity like those used clinically, where spot increments are preferred [28,29]. One further disadvantage arises from the fact that in the stimulated area where the light is turned off, no cone image is available at the time of stimulus delivery. One therefore cannot determine where stimuli actually landed, and during retinally stabilized stimulus delivery the stabilization performance degrades without a complete field of image content [4]. Using monochromatic light in the more visible region of the spectrum alleviates some of these disadvantages, but introduces new problems. Here, the main difficulty is that light intensities must be quite bright in order to acquire retinal images. For instance, the beam power needed to image with 545 nm light in the current AOSLO instrument is about 15 µW. This is equivalent to a stimulus luminance of ~50,000 cd/m2, far too bright for most psychophysical testing. Moreover, at such intensities, retinal adaptation is likely to fluctuate greatly because of fixational eye movements.
Based on these considerations, it is desirable to have two or more wavelength bands that separate the imaging from the stimulation channels. Stimulus intensity levels can be set in a more typically useful range, luminance increments and decrements can be applied, very high stimulus contrasts can be achieved, and stimulus locations can always be ascertained. A multi-wavelength instrument answers this purpose but does not come without a cost, because it introduces chromatic aberrations that are significant for aligned imaging and targeted light delivery [30]. We have shown that by measuring the relative offsets between the images formed by three wavelengths acquired simultaneously, the effects of transverse chromatic aberration can be corrected with sub-cone resolution. This technique can also be extended to more than three channels. Our image-based measurement has the additional advantage over subjective methods in that it can be applied independent of viewing eccentricity. With standard subjective methods in humans, TCA correction at peripheral retinal locations cannot be performed, because foveal inspection of an alignment target is required [9,20]. Our method performs well at the fovea (Fig. 7(B)), and is even more precise at extra-foveal retinal locations (Fig. 6).
The image-based approach does not require a subject’s response, an especially useful feature for multi-wavelength retinal imaging in animals. Incorporating TCA correction for the eye’s chromatic aberrations will be particularly important in mouse eyes (the most common animal model used in biomedical research) where the chromatic dispersion is about 10 times greater than in humans [31], and where it is desirable to have excellent image alignment when multiple fluorescent labels are present in the retina [32,33]. Moreover, the image-based approach obviates the need to determine the achromatic axis for each eye to achieve alignment, an especially onerous task for animal eye research. The chromatic correction demonstrated here opens the door to a host of applications that could use multi-wavelength light to target and probe retinal function with sub-cellular resolution [24,34].
Acknowledgments
We acknowledge Scott B. Stevenson for initially suggesting the interleaved approach for measuring TCA. W.M.H. is supported by a DFG Fellowship (Ha 5323/2-1), W.M.H. and A.R. are supported by a NIH grant (EY021642), L.C.S. is supported by a NIH grant (EY019566), UCSF REAC award, and Eyesight Foundation of Alabama, A.R. is supported by a NIH grant (EY014375).
References and links
- 1.Liang J., Williams D. R., “Aberrations and retinal image quality of the normal human eye,” J. Opt. Soc. Am. A 14(11), 2873–2883 (1997). 10.1364/JOSAA.14.002873 [DOI] [PubMed] [Google Scholar]
- 2.Liang J., Williams D. R., Miller D. T., “Supernormal vision and high-resolution retinal imaging through adaptive optics,” J. Opt. Soc. Am. A 14(11), 2884–2892 (1997). 10.1364/JOSAA.14.002884 [DOI] [PubMed] [Google Scholar]
- 3.Dubra A., Sulai Y., Norris J. L., Cooper R. F., Dubis A. M., Williams D. R., Carroll J., “Noninvasive imaging of the human rod photoreceptor mosaic using a confocal adaptive optics scanning ophthalmoscope,” Biomed. Opt. Express 2(7), 1864–1876 (2011). 10.1364/BOE.2.001864 [DOI] [PMC free article] [PubMed] [Google Scholar]
- 4.Arathorn D. W., Yang Q., Vogel C. R., Zhang Y., Tiruveedhula P., Roorda A., “Retinally stabilized cone-targeted stimulus delivery,” Opt. Express 15(21), 13731–13744 (2007). 10.1364/OE.15.013731 [DOI] [PubMed] [Google Scholar]
- 5.Hofer H., Carroll J., Neitz J., Neitz M., Williams D. R., “Organization of the human trichromatic cone mosaic,” J. Neurosci. 25(42), 9669–9679 (2005). 10.1523/JNEUROSCI.2414-05.2005 [DOI] [PMC free article] [PubMed] [Google Scholar]
- 6.Palczewska G., Maeda T., Imanishi Y., Sun W., Chen Y., Williams D. R., Piston D. W., Maeda A., Palczewski K., “Noninvasive multiphoton fluorescence microscopy resolves retinol and retinal condensation products in mouse eyes,” Nat. Med. 16(12), 1444–1449 (2010). 10.1038/nm.2260 [DOI] [PMC free article] [PubMed] [Google Scholar]
- 7.Koss M. J., Beger I., Koch F. H., “Subthreshold diode laser micropulse photocoagulation versus intravitreal injections of bevacizumab in the treatment of central serous chorioretinopathy,” Eye (Lond.) 26(2), 307–314 (2012). 10.1038/eye.2011.282 [DOI] [PMC free article] [PubMed] [Google Scholar]
- 8.Atchison D. A., Smith G., “Chromatic dispersions of the ocular media of human eyes,” J. Opt. Soc. Am. A 22(1), 29–37 (2005). 10.1364/JOSAA.22.000029 [DOI] [PubMed] [Google Scholar]
- 9.Thibos L. N., Bradley A., Still D. L., Zhang X., Howarth P. A., “Theory and measurement of ocular chromatic aberration,” Vision Res. 30(1), 33–49 (1990). 10.1016/0042-6989(90)90126-6 [DOI] [PubMed] [Google Scholar]
- 10.Simonet P., Campbell M. C., “The optical transverse chromatic aberration on the fovea of the human eye,” Vision Res. 30(2), 187–206 (1990). 10.1016/0042-6989(90)90035-J [DOI] [PubMed] [Google Scholar]
- 11.Steinman R. M., Haddad G. M., Skavenski A. A., Wyman D., “Miniature eye movement,” Science 181(4102), 810–819 (1973). 10.1126/science.181.4102.810 [DOI] [PubMed] [Google Scholar]
- 12.Rucci M., Iovin R., Poletti M., Santini F., “Miniature eye movements enhance fine spatial detail,” Nature 447(7146), 852–854 (2007). 10.1038/nature05866 [DOI] [PubMed] [Google Scholar]
- 13.Zhang Y., Poonja S., Roorda A., “MEMS-based adaptive optics scanning laser ophthalmoscopy,” Opt. Lett. 31(9), 1268–1270 (2006). 10.1364/OL.31.001268 [DOI] [PubMed] [Google Scholar]
- 14.Yang Q., Arathorn D. W., Tiruveedhula P., Vogel C. R., Roorda A., “Design of an integrated hardware interface for AOSLO image capture and cone-targeted stimulus delivery,” Opt. Express 18(17), 17841–17858 (2010). 10.1364/OE.18.017841 [DOI] [PMC free article] [PubMed] [Google Scholar]
- 15.Marcos S., Burns S. A., Prieto P. M., Navarro R., Baraibar B., “Investigating sources of variability of monochromatic and transverse chromatic aberrations across eyes,” Vision Res. 41(28), 3861–3871 (2001). 10.1016/S0042-6989(01)00133-X [DOI] [PubMed] [Google Scholar]
- 16.Rynders M., Lidkea B., Chisholm W., Thibos L. N., “Statistical distribution of foveal transverse chromatic aberration, pupil centration, and angle psi in a population of young adult eyes,” J. Opt. Soc. Am. A 12(10), 2348–2357 (1995). 10.1364/JOSAA.12.002348 [DOI] [PubMed] [Google Scholar]
- 17.Guizar-Sicairos M., Thurman S. T., Fienup J. R., “Efficient subpixel image registration algorithms,” Opt. Lett. 33(2), 156–158 (2008). 10.1364/OL.33.000156 [DOI] [PubMed] [Google Scholar]
- 18.Bolger C., Bojanic S., Sheahan N. F., Coakley D., Malone J. F., “Dominant frequency content of ocular microtremor from normal subjects,” Vision Res. 39(11), 1911–1915 (1999). 10.1016/S0042-6989(98)00322-8 [DOI] [PubMed] [Google Scholar]
- 19.Westheimer G., McKee S. P., “Spatial configurations for visual hyperacuity,” Vision Res. 17(8), 941–947 (1977). 10.1016/0042-6989(77)90069-4 [DOI] [PubMed] [Google Scholar]
- 20.Marcos S., Burns S. A., Moreno-Barriusop E., Navarro R., “A new approach to the study of ocular chromatic aberrations,” Vision Res. 39(26), 4309–4323 (1999). 10.1016/S0042-6989(99)00145-5 [DOI] [PubMed] [Google Scholar]
- 21.Thibos L. N., Ye M., Zhang X., Bradley A., “The chromatic eye: a new reduced-eye model of ocular chromatic aberration in humans,” Appl. Opt. 31(19), 3594–3600 (1992). 10.1364/AO.31.003594 [DOI] [PubMed] [Google Scholar]
- 22.Williams D. R., “Imaging single cells in the living retina,” Vision Res. 51(13), 1379–1396 (2011). 10.1016/j.visres.2011.05.002 [DOI] [PMC free article] [PubMed] [Google Scholar]
- 23.Rossi E. A., Roorda A., “The relationship between visual resolution and cone spacing in the human fovea,” Nat. Neurosci. 13(2), 156–157 (2010). 10.1038/nn.2465 [DOI] [PMC free article] [PubMed] [Google Scholar]
- 24.Sincich L. C., Zhang Y., Tiruveedhula P., Horton J. C., Roorda A., “Resolving single cone inputs to visual receptive fields,” Nat. Neurosci. 12(8), 967–969 (2009). 10.1038/nn.2352 [DOI] [PMC free article] [PubMed] [Google Scholar]
- 25.Stockman A., Sharpe L. T., Fach C., “The spectral sensitivity of the human short-wavelength sensitive cones derived from thresholds and color matches,” Vision Res. 39(17), 2901–2927 (1999). 10.1016/S0042-6989(98)00225-9 [DOI] [PubMed] [Google Scholar]
- 26.Stockman A., Sharpe L. T., “The spectral sensitivities of the middle- and long-wavelength-sensitive cones derived from measurements in observers of known genotype,” Vision Res. 40(13), 1711–1737 (2000). 10.1016/S0042-6989(00)00021-3 [DOI] [PubMed] [Google Scholar]
- 27.Wald G., “Human vision and the spectrum,” Science 101(2635), 653–658 (1945). 10.1126/science.101.2635.653 [DOI] [PubMed] [Google Scholar]
- 28.Tuten W. S., Tiruveedhula P., Roorda A., “Adaptive optics scanning laser ophthalmoscope-based microperimetry,” Optom. Vis. Sci. 89(5), 563–574 (2012). 10.1097/OPX.0b013e3182512b98 [DOI] [PMC free article] [PubMed] [Google Scholar]
- 29.Johnson C. A., Adams A. J., Casson E. J., Brandt J. D., “Blue-on-yellow perimetry can predict the development of glaucomatous visual field loss,” Arch. Ophthalmol. 111(5), 645–650 (1993). 10.1001/archopht.1993.01090050079034 [DOI] [PubMed] [Google Scholar]
- 30.Grieve K., Tiruveedhula P., Zhang Y., Roorda A., “Multi-wavelength imaging with the adaptive optics scanning laser Ophthalmoscope,” Opt. Express 14(25), 12230–12242 (2006). 10.1364/OE.14.012230 [DOI] [PubMed] [Google Scholar]
- 31.Geng Y., Schery L. A., Sharma R., Dubra A., Ahmad K., Libby R. T., Williams D. R., “Optical properties of the mouse eye,” Biomed. Opt. Express 2(4), 717–738 (2011). 10.1364/BOE.2.000717 [DOI] [PMC free article] [PubMed] [Google Scholar]
- 32.Feng G., Mellor R. H., Bernstein M., Keller-Peck C., Nguyen Q. T., Wallace M., Nerbonne J. M., Lichtman J. W., Sanes J. R., “Imaging neuronal subsets in transgenic mice expressing multiple spectral variants of GFP,” Neuron 28(1), 41–51 (2000). 10.1016/S0896-6273(00)00084-2 [DOI] [PubMed] [Google Scholar]
- 33.Kim I.-J., Zhang Y., Meister M., Sanes J. R., “Laminar restriction of retinal ganglion cell dendrites and axons: subtype-specific developmental patterns revealed with transgenic markers,” J. Neurosci. 30(4), 1452–1462 (2010). 10.1523/JNEUROSCI.4779-09.2010 [DOI] [PMC free article] [PubMed] [Google Scholar]
- 34.Carroll J., Neitz M., Hofer H., Neitz J., Williams D. R., “Functional photoreceptor loss revealed with adaptive optics: an alternate cause of color blindness,” Proc. Natl. Acad. Sci. U.S.A. 101(22), 8461–8466 (2004). 10.1073/pnas.0401440101 [DOI] [PMC free article] [PubMed] [Google Scholar]


