Abstract
Peripheral arterial disease (PAD) is the narrowing of arteries due to plaque accumulation in the vascular walls. This leads to insufficient blood supply to the extremities and can ultimately cause cell death. Currently available methods are ineffective in diagnosing PAD in patients with calcified arteries, such as those with diabetes. In this paper we investigate the potential of dynamic diffuse optical tomography (DDOT) as an alternative way to assess PAD in the lower extremities. DDOT is a non-invasive, non-ionizing imaging modality that uses near-infrared light to create spatio-temporal maps of oxy- and deoxy-hemoglobin in tissue. We present three case studies in which we used DDOT to visualize vascular perfusion of a healthy volunteer, a PAD patient and a diabetic PAD patient with calcified arteries. These preliminary results show significant differences in DDOT time-traces and images between all three cases, underscoring the potential of DDOT as a new diagnostic tool.
OCIS codes: (170.3880) Medical and biological imaging, (170.6960) Tomography
1. Introduction
Peripheral Arterial Disease (PAD) is the narrowing of arteries due to plaque accumulation and in the vascular walls. PAD typical manifests itself as claudication, which is cramping leg pain with ambulation to a set distance. As the disease progresses, this distance becomes progressively shorter, and in later stages the pain becomes severe and present even at rest. Untreated, the disease eventually leads to formation of foot wounds or ulcerations, which can subsequently lead to infection of the wound and tissue loss (gangrene), and amputation.
PAD affects approximately 12 million individuals in the United States and is associated with significant morbidity and mortality [1]. Every year, PAD is responsible for over 2,750,000 office visits, 10% of which result in hospital admissions. Approximately 45,000 PAD patients die from this disease annually [2]. Furthermore, patients with PAD have an increased risk of stroke and myocardial infarction, and show a two-fold increase in the risk of death from cardiovascular disease [3]. Lower extremity percutaneous transluminal angioplasty or bypass surgery is performed when advanced stages are reached and limb-threatening ischemia occurs. Once gangrene develops, amputation is necessary to prevent infected and dying tissues from causing septicemia. Therefore, accurate and timely diagnosis of PAD is crucial in the prevention of further health consequences.
The first-line diagnostic test for determination of PAD is the ankle brachial index (ABI) [3]. The ABI is calculated by measuring the maximum systolic blood pressure at the ankle and dividing it by the systolic blood pressure in the brachial artery in the upper arm. In healthy individuals ABI values range between 0.9 and 1. Values less than 0.9 identify patients with some form of vascular occlusions or stenoses in a major leg artery. Most patients with symptoms of claudication will have an ABI between 0.5 and 0.8 and those with more severe symptoms such as rest pain will generally have values less than 0.5.
Although the ABI is often useful in the diagnosis and determination of the severity of PAD, it has major shortcomings [3]. The presence of distal emboli, micro-emboli and atherosclerotic plaques in the foot can lead to tissue breakdown, ulceration and amputation, even if the ABI is close to 1. Furthermore, falsely elevated ABI readings occur in patients with medial wall calcification, a condition commonly seen in patients with diabeties and renal insufficiency. In these cases, the ABI reflects the ability of the vessel wall to resist compression rather than being a true indicator of the blood flow and pressure within the vessel. Consequently a recent study [3] involving diabetic patients with neuropathy showed that ABI’s inability to detect arterial disease resulted in false-negative results in one third of the limbs. Consequently, physicians often do not employ this test in diabetic patients.
Imaging methods are usually used as second line diagnostic tests, to confirm initial diagnostic results and to assess for a potential surgical intervention [4]. Typically, lower limb duplex-ultrasound (DUS) examinations are initially performed first to determine the location of stenosis or occlusions in the legs. If this examination is inconclusive (e.g. DUS fails to visualize up to 15% of arterial segments in the calf), computed tomography angiography (CTA) is employed to provide further details of the location and extent of arterial stenoses or occlusion in the leg. However, CTA uses a potentially nephrotoxic contrast agent which thus imposes the risk of renal failure and is contraindicated in patients with renal insufficiency, a common concern in the diabetic population [5]. In addition, the use of ionizing radiation prevents CTA from being used as screening or monitoring modality.
The use of ionizing radiation can be avoided by performing magnetic resonance angiography (MRA). However, since in this case another nephrotoxic contrast agent is used (gadolinium), concerns in diabetic patients as well as those with renal insufficiency remain. MRA of small vessels in particular is often not adequate for diagnosis and treatment planning. While MRA provides details of the blood circulation in the upper and lower limb, direct information about perfusion in the foot is not provided.
Intravascular imaging techniques such as intravascular ultrasound (IVUS) and optical coherence tomography (OCT) are useful in identifying hardened plaque formations that could rupture and can cause pulmonary embolisms, strokes, and myocardial infarctions [6]. However, the application of these techniques is limited to large arteries, and neither IVUS nor OCT inform about the distal foot perfusion. Furthermore, unlike DOT, these methods are invasive.
Optical imaging techniques can non-invasively measure blood in tissue without the need for contrast agents or ionizing radiation. To date, promising initial results have been shown using near-infrared spectroscopy (NIRS) to detect PAD [7,8]. However, in NIRS measurements are performed in a reflection-based geometry at isolated points on the surface of the tissue, which makes the technique heavily dependent on the location of the probe. In addition unlike optical tomographic imaging, NIRS does not provide the physician with an image of the blood flow, but simply a time trace of the hemoglobin concentrations.
In diffuse optical tomography (DOT) red and near-infrared light (650 nm < λ < 900 nm) is used to probe biological tissues. This low energy electromagnetic radiation (~1 to 2.5 eV) is delivered to one or more locations on the surface of the body part under investigation and transmitted and/or back-reflected light intensities are measured at distances up to 10 cm. As the near-infrared light passes through tissue it is both scattered and absorbed by a multitude of chromophores inside the tissue. Of special interest are the blood constituents oxy-hemoglobin (HbO2) and deoxy-hemoglobin (Hb), which have distinctly different absorption spectra in the visible and near-infrared wavelengths. By performing measurements at multiple wavelengths, concentration of these chromophores as well as derived parameters such as total hemoglobin [HbT] = [HbO2] + [Hb] can be obtained [9]. By gathering data at different wavelengths and using multi-wavelength image reconstruction codes, 2 and 3-dimensional maps of these and other parameters, such as blood volume, can be generated. With instrumentation [10–13] geared specifically to the fast data acquisition rates required for dynamic imaging, this technique has increasingly been applied to other clinically relevant areas, such as breast imaging [12,13], arthritis detection [14] and cancer research in small animals .
Even when the existing modalities (ABI, DUT, CTA, MRA) are used in combination, there are considerable gaps in the diagnosis of PAD, largely due to the fact that all of these modalities are surrogate measurements of distal perfusion. Since it is the lack of distal perfusion that leads to ulcers and amputations, a direct measure of this perfusion is necessary. Dynamic diffuse optical tomography (DDOT) promises to overcome the limitations of current diagnostic techniques and could become a platform for assessing various vascular diseases. DDOT has the capability to image the temporal response of the vasculature to an external provocation and use this response as a diagnostic marker. In addition, optical imaging systems use less expensive parts than most other imaging instrumentation and can be scaled down to portable systems. Therefore, optical imaging systems could be used at point of care as readily available screening devices and has the potential to be a safe and accurate method to diagnose PAD and allow for monitoring of treatment response.
2. Methods
2.1. Instrumentation
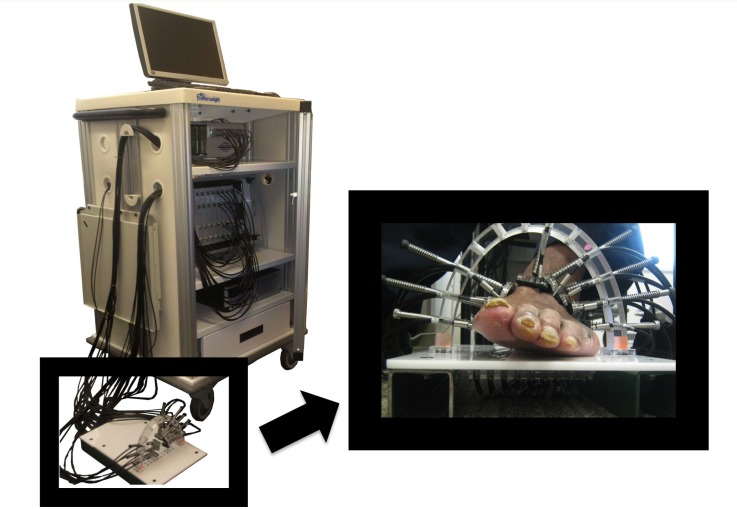
Optical transmission measurements on the foot were performed with a digital, dynamic near-infrared optical tomography imager [11]. The system illuminates the tissue with an optical beam consisting of two laser diodes (wavelengths λ = 765 nm and 830 nm). The diodes are sequentially coupled into different 1 mm multimode fiber bundles that distribute light to multiple areas along the foot (Fig. 1 ). The current of each laser diode is modulated to a distinct amplitude and frequency (5-7 kHz). In this way, multiple wavelengths may be illuminated simultaneously, thereby increasing the imaging speed and their respective contribution to the attenuated detected signal can be extracted using synchronous detection techniques [15]. The light is attenuated and scattered as it propagates through the foot, and is collected by the various detector fiber bundles positioned around the foot.
Fig. 1.
Dynamic diffuse optical tomography system and the measurement probe.
The measuring probe was designed to accommodate the various shapes and sizes of feet seen in a clinical setting. Utilizing a sandal-shaped design, optical fibers are guided towards the foot via spring-loaded shoulder screws. The probe contains 14 sources and 20 detectors placed in a two-ring arrangement. This design gives each fiber the ability to translate different lengths to make contact with the non-uniform curvature of the foot. To obtain the mesh for the image reconstruction a photograph is taken of the patient’s foot such as shown in Fig. 1, using two references a coordinate system can be made to identify the locations the sources and detectors and segment the foot boundary.
2.2. Image reconstruction
The detector readings were filtered by using the discrete cosine transform for noise suppression and elimination of artifacts due to movement or respiration. A discrete cosine transform (DCT) expresses a sequence of finite data points in terms of a sum of cosine functions oscillating at different frequencies. It relates to the Fourier transform but uses only real valued coefficients [16]. The coefficients that yielded a high correlation with the original signal were used to represent the image, which enabled the feature-preserving noise reduction without the loss of curvature within the original shape. This preprocessed data was then inputted to the image reconstruction code.
To generate the two-dimensional reconstructions of the optical properties in the foot, a diffusion-theory-based PDE-constrained multispectral image reconstruction scheme was employed [13]. This method solves the forward problem (boundary radiance at each wavelength) and the inverse problem (spatial distribution of chromophores concentrations) simultaneously using a reduced Hessian sequential quadratic programming (rSQP) method [13,17]. This scheme directly reconstructs the spatial distributions of the oxy and deoxy-hemoglobin concentrations in the foot. Note that the differences in [HbO2] and [Hb] obtained through reconstruction is relative to baseline which is assumed to be given by [HbO2] = 23.43 μM and [Hb] = 14.69 μM, throughout the foot. A radial basis function (RBF)-type regularization scheme is employed to obtain quality images by reducing image noise such as artifacts near the foot surface. More details about this code can be found in reference [17]. Given source-detector configuration, and the geometry and optical properties of feet in the wavelength region considered, we expect spatial resolution of approximately ~0.5cm in the center of the feet, and ~0.2cm towards the surface regions [18,19].
2.3. Measurement protocol
The case studies presented were performed at the New York-Presbyterian Hospital–Columbia (NYP). The institutional review board (IRB) of the NYP approved the human subject protocol and written consents were obtained from all patients. During the imaging protocol the subjects were asked to place their foot on the patient interface (Fig. 1) while sitting upright in a chair. A total of 34 fibers (14 source and 20 detection fibers) encompassed the foot, forming a coronal cross-section at the mid-metatarsal level. This location was chosen because it contains the major arteries of the foot the dorsalis pedis and the major branches of the posterior tibial artery. Physicians can probe these arteries when measuring a patient’s ABI. Furthermore, it is a common location for diabetic foot ulcers to occur and the vasculature in that region is too small to diagnose even with the high resolution anatomical imaging modalities such as CTA and MRA.
After positioning the probe around the patient’s foot, the instrument automatically determined and stored the ideal gain settings for each channel at every source position. To illicit a controlled vascular response a pressure cuff was applied to the upper thigh. Patients are familiar with leg cuffs from ABI measurements, making this dynamic protocol a natural extension of the existing diagnostic procedures. The protocol consists of five stages as outlined in Fig. 2 . First a baseline measurement was taken while the patient is seated at rest for approximately one minute. Second, the pressure cuff is inflated to 60 mmHg around the thigh. This induces venous occlusion, allowing arteries to supply blood the foot but preventing the veins from returning it to the heart, causing the blood to pool in the foot. The pressure was maintained for one minute after which it was rapidly released. During the third stage of the sequence, the foot was left to recover for one minute. In the fourth portion of this protocol a 120 mmHg was applied to the thigh inducing greater venous occlusion for one minute. Then the pressure was released enabling the foot was left to recover. This five stage protocol was applied three times for each subject to show repeatability.
Fig. 2.
Five stage measurement protocol used for dynamic diffuse optical tomography.
3. Results and discussion
3.1. Light intensity time traces
We present three select cases, one patient with PAD (ABI = 0.66), one patient with diabetes and PAD (ABI = 1.07) and one healthy subject (ABI = 1.00). Using the traditional ABI measurement it is possible to discern between the healthy control and the PAD patient, however the diabetic PAD patient is not distinguishable. Diabetic patients often have incompressible arteries due to calcifications which result in elevated ABI readings and leads to false negative diagnoses.
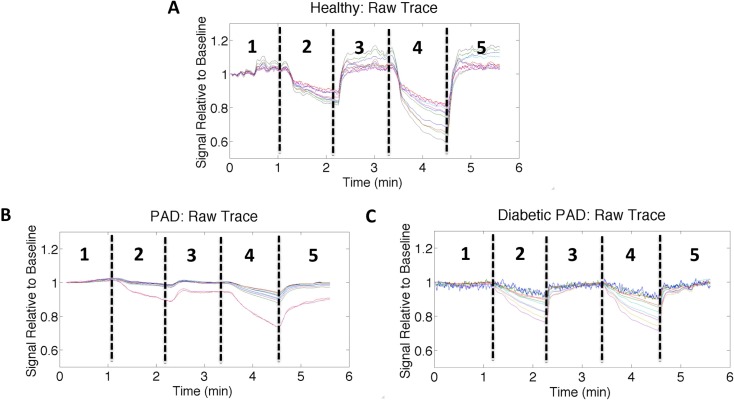
Figures 3(A) -3(C) shows the representative time traces for the healthy, PAD, and diabetic PAD subjects respectively. The detector readings shown are normalized to the first 30 seconds of the initial rest period. The time traces have five distinct phases that correlate with the measurement protocol shown in Fig. 2. Initially, we see a flat segment in concordance with the rest period. Subsequently upon applying the 60 mmHg thigh cuff (inducing venous occlusion), we see a drop in intensity. During venous occlusion, blood is pumping from the arteries into the foot but not returning to the heart, it pools in the foot. The greater blood volume in the foot increases the light attenuation resulting in the drop of signal observed during the venous occlusion stages of the measurement protocol. After one minute of occlusion the thigh cuff is released enabling the blood to flow back to the heart and the signal to return to baseline. A 120 mmHg is applied again to the thigh inducing greater blood pooling and a greater drop in detector intensity for about one minute before release allowing the signal to return once again to rest.
Fig. 3.
Normalized detector readings (different detector positions shown as colored lines) for a single source illumination over time for (A) a healthy volunteer, (B) a PAD patient, and (C) a diabetic PAD patient. The individual traces were filtered with a 50-point moving average filter. A dip in intensity is observed at approximately 1 minute when the 60 mmHg cuff is applied to thigh. This impedes blood from returning to the heart and causes it to pool in the leg increasing light absorption. Upon release of the cuff the signal returns to baseline the same behavior can be seen with the 120 mmHg cuff. There are clear differences in the magnitude drop during thigh occlusions as well as the recovery rates from release of the thigh cuff.
During both the 60 mmHg and 120 mmHg occlusions the healthy volunteer had a significantly greater percent drop in detector intensity (20% and 45%) than the PAD Patient (10% and 15%) and the diabetic PAD Patient (20% and 20%). These amplitude drops were calculated by observing the largest magnitude change among the different detectors for the same source position before the release of the 60 mmHg and 120 mmHg pressure occlusions respectively. The detector readings reflect the amount of light that passes through the tissue. The more blood present in the tissue, the less light is transmitted. As a result, the signal attenuation is directly proportional to the total hemoglobin concentration this implies that more blood collects in the foot during occlusion in the healthy subject than in the patients with affected vasculature. Furthermore, the decay and recovery rates of the detector intensities differ between the three subjects. The healthy volunteer exhibits a fast decay in the detector intensity and the occlusion rate has a distinct plateau phase while the PAD patients exhibit a more linear trend. It is suspected that the PAD patients exhibit a more linear trend because the diseased arteries provide greater flow resistance due to plaque buildup and a lack of arterial wall capacitance due to arterial wall calcifications. Despite the similarity in the ABI measurements of the diabetic PAD patient and the healthy volunteer, DDOT detector readings provide contrast between the two subjects providing useful information that is missing within the current diagnostic methods.
3.2. Image reconstructions
The detector readings from multiple source positions were used to reconstruct two-dimensional cross-sectional image of the change in total hemoglobin concentration [HbT] within the foot. These reconstructions appear to coincide spatially with the expected foot vasculature. Figure 4 shows a side-by-side comparison between an anatomical cross-section adapted from an anatomy textbook and a healthy foot reconstruction image. The changes in hemoglobin concentration occur in the periphery of the foot as expected anatomically, which could enable physicians to evaluate spatial foot perfusion.
Fig. 4.
The locations of hemoglobin change within the 2D reconstructions correlate with the expected anatomy of the cross section of the foot.
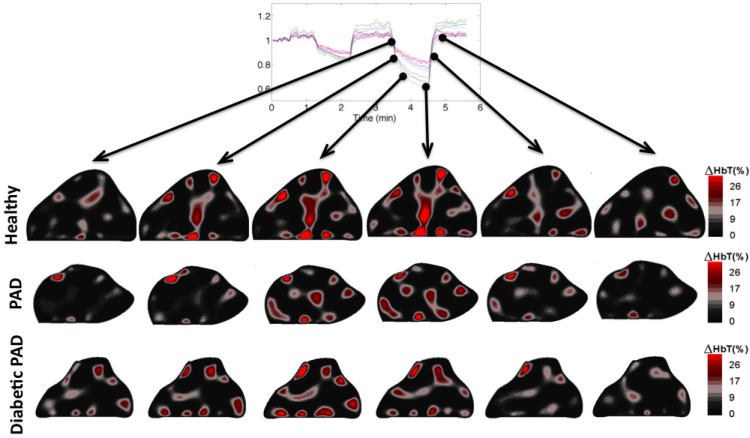
Figure 5 shows the image reconstructions at six time points during the 120 mmHg thigh cuff occlusion. In these images we can see the hemoglobin concentration gradually increasing within the foot during the occlusion portion of the imaging sequence and then decreasing back to baseline upon removal of the pressure cuff. The healthy subject, PAD patient and the diabetic PAD patient exhibit different time courses with respect to both intensity and rate of change of the hemoglobin concentration. The healthy subject has the largest magnitude transition from the beginning of the occlusion to right before the cuff removal at the fourth time point. Furthermore, the amount of blood in the foot made a full recovery back to resting state. The PAD patient exhibits a slower rate and magnitude of blood pooling before the release of the thigh cuff than the healthy patient. This is expected due to the effects of plaque accumulation in the arteries impeding the blood flow. The diabetic PAD patient had a slower rate and the dynamics were not nearly as apparent. The initial change in concentration of hemoglobin within the foot was relatively high before the 120 mmHg occlusion; this is most likely due to an incomplete recovery from the previous 60 mmHg occlusion. Physiologically the incomplete recovery can be caused by obstructions of the capillary bed of the foot. We suspect that these microvasculature occlusions maybe cause the blood to remain in the foot and not flow to the veins during the 60 mmHg occlusion leading to a higher starting concentration for the subsequent occlusion.
Fig. 5.
Dynamic changes occurring during the 120 mmHg occlusion within the cross section of the foot along the course of the imaging sequence. There appears to be a faster reaction to the thigh cuff within the healthy foot than the feet with the affected vasculature as well as a greater change in the total hemoglobin concentration.
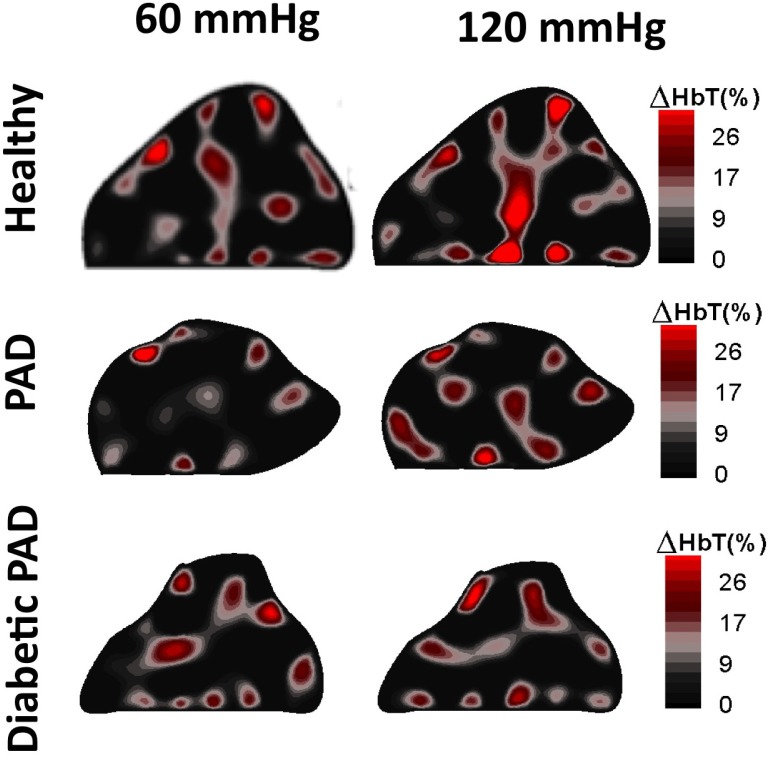
Looking at the blood volume dynamics within the foot, we see that the two time points prior to release of the thigh cuffs show the most significant differences between the three cases. Figure 6 shows reconstruction results before the release of the 60 mmHg pressure, and before the release of the 120 mmHg pressure. These images show clear differences between the healthy patient and the two PAD patients. We observe that the changes in [HbT] are much less pronounced in the feet of the PAD patients than the healthy volunteer. This suggests that there is significantly less blood pooling in PAD patients’ feet during a minute of venous occlusion. Physiologically we suspect that the differential is due to the blood flow impedance caused by plaque in the affected vasculature as well as arterial stiffening due to calcifications within the arterial wall lowering the vascular compliance.
Fig. 6.
2D Reconstructions of the total hemoglobin concentration [HbT] for a healthy volunteer, a PAD patient and a diabetic PAD patient. There is more hemoglobin present within the healthy volunteer than the two patient cross sections shown below it.
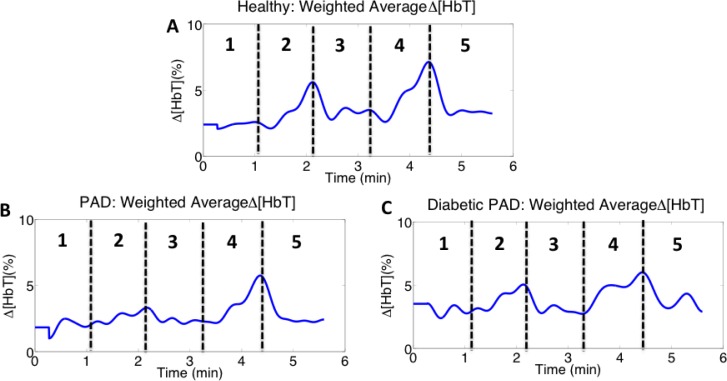
To further quantify the hemodynamic change within the feet we calculated the sum of the [HbT] in each frame of the dynamic imaging sequence and obtained an area weighted average signal (Fig. 7 ). These time traces show that the amount of blood within the foot increased when the thigh cuff was applied to the foot (phases 2 and 4 in all images in Fig. 7). The concentration of hemoglobin in the foot during thigh occlusions is greatest within the healthy volunteer (Fig. 7(A)), in concordance with the time-dependent detector readings. Furthermore, the patients with diseased vasculature (Figs. 7(B), 7(C)) show slower occlusion and recovery rates than the healthy volunteer.
Fig. 7.
Area weighted average total hemoglobin signal healthy for (A) a healthy volunteer, (B) a PAD patient, and (C) a diabetic PAD patient. We recover the five phases seen in the raw detector time traces and observe more blood pooling within the healthy volunteer than the patients with affected vasculature.
3.3. Regions of hemodynamic consistency
To better quantify which regions in the foot contribute most to the area weighted average changes, we calculated the cross-correlation coefficients between the area weighted average change in [HbT] over the whole cross section (see Fig. 7) and the change in [HbT] for each pixel within the cross section over time using the equation
| (1) |
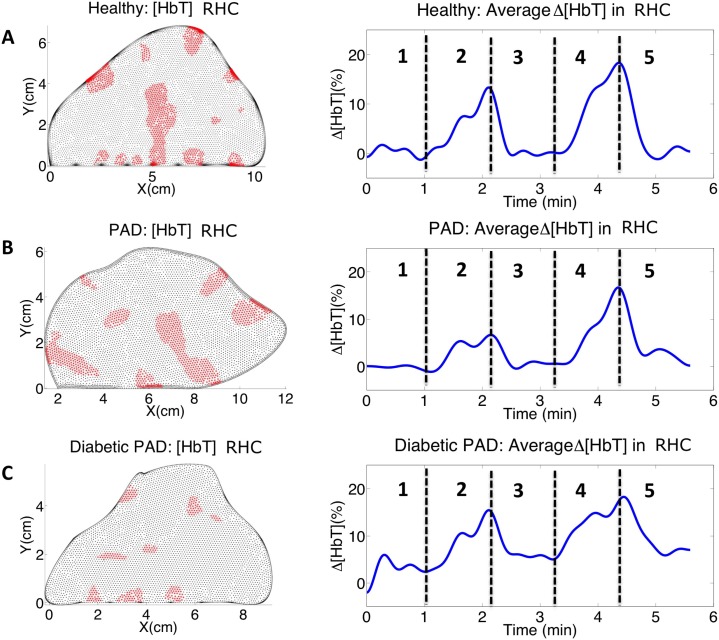
where h(t) is an individual pixel time trace from within the foot and W(t) is the weighted average signal from the entire foot (both time series are of length N). The pixels that contribute the most to the area weighted average change (here defined as ρ > 0.7) are plotted in red in Fig. 8 . These regions of hemodynamic consistency (RHC) show the spatial locations that correspond to the vascular response, eliminating potential artifacts and background noise. By counting all pixels with ρ > 0.7, we find that in a healthy subject and the PAD patient both have 22.5% of their pixels correlating to the weighted average signal, while the diabetic PAD has only 6.18% of its pixels correlating with the weighted average signal. This suggests there is a severe difference in the hemodynamics of diabetic patient’s vasculature.
Fig. 8.
Pixels that correlate with weighted average total hemoglobin signal and their corresponding time traces for (A) a healthy volunteer, (B) a PAD patient, and (C) a diabetic PAD patient. By using RHC we see much cleaner signals than the weighted average signals and the differences in the vascular dynamics become much more apparent.
Taking the weighted average signal within the RHC (shown in red in Fig. 8) we obtain the adjacent time traces. The signals from within the RHC show cleaner signals for the three different cases, these signals coincide more with the vasculature of the foot and are less adulterated by noise and artifacts. The healthy volunteer shows the highest concentration of blood pooling during the occlusions and has a significantly faster occlusion and decay rate. Within the RHC the PAD patient exhibits a lower concentration of hemoglobin during the occlusions but has a slower occlusion and decay rate than seen in the weighted average total hemoglobin signal within the whole foot. The diabetic PAD patient has the lowest concentration of hemoglobin change and the concentration of hemoglobin does not return fully to rest within the one-minute recovery time of the imaging sequence.
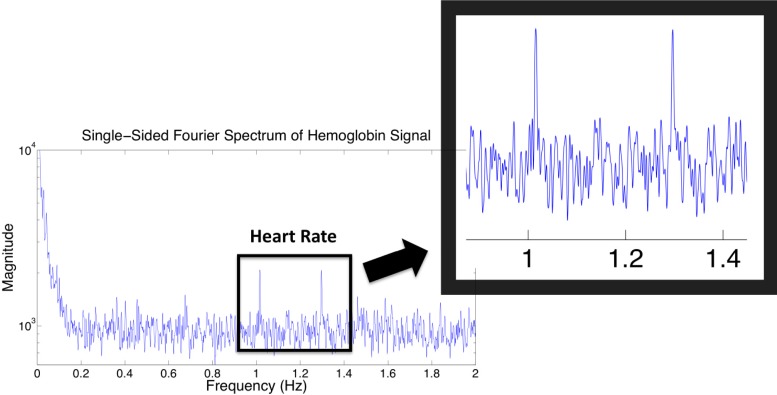
To further validate that these images do correlate with the vasculature of the foot we calculated the Fourier transform of each pixel’s intensity over time and summed the resulting spectrums together. The resulting net frequency spectrum for the healthy subject can be seen in Fig. 9 . The figure contains two well-defined peaks within proximity to 1 Hz. This provides a direct connection between the RHC and the foot vasculature, as 1 Hz is the average resting human heart rate. There are two peaks that occur within the typical human heart rate zone, which may indicate that the subjects’ heart rate increased as the pressure cuff was applied or possibly that they were anxious at the beginning of the imaging protocol and became more relaxed at the end of the imaging sequence.
Fig. 9.
frequency spectrum analysis of hemoglobin time trace.
5. Conclusion
We reported on dynamic diffuse optical imaging (DDOT) results obtained for one healthy volunteer, one PAD patient and a patient with both PAD and diabetes. DDOT was used to show the hemodynamic responses observed within the foot while providing cross-sectional images and regions of hemodynamic consistency that correspond to the foot vasculature. We found differences between all three cases exists in the magnitude of the detector intensity drop during thigh cuff occlusion, the weighted average change in [HbT] signal obtained from the image reconstructions, and the average change in [HbT] signal from the RHC. In addition, DDOT was capable of discerning between the diabetic patient’s vasculature, despite their arterial calcifications, which render the traditional diagnostic methods inapt.
These preliminary results show that DDOT has the potential to aid in the diagnosis and monitoring of PAD. Furthermore it has the potential to fill the diagnostic gap that currently exists within the diabetic patient population.
Acknowledgments
This work was funded in part by the Wallace H. Coulter Foundation, the National Science Foundation National Graduate Research Fellowship, the National Science Foundation IGERT for Optical Techniques for Actuation, Sensing, and Imaging of Biological Systems, and the Society of Vascular Surgery.
References and links
- 1.Hirsch A. T., Criqui M. H., Treat-Jacobson D., Regensteiner J. G., Creager M. A., Olin J. W., Krook S. H., Hunninghake D. B., Comerota A. J., Walsh M. E., McDermott M. M., Hiatt W. R., “Peripheral arterial disease detection, awareness, and treatment in primary care,” JAMA 286(11), 1317–1324 (2001). 10.1001/jama.286.11.1317 [DOI] [PubMed] [Google Scholar]
- 2.Hiatt W. R., “Medical treatment of peripheral arterial disease and claudication,” N. Engl. J. Med. 344(21), 1608–1621 (2001). 10.1056/NEJM200105243442108 [DOI] [PubMed] [Google Scholar]
- 3.Norgren L., Hiatt W. R., Dormandy J. A., Nehler M. R., Harris K. A., Fowkes F. G. R., TASC II Working Group , “Inter-society consensus for the management of peripheral arterial disease (TASC II),” Eur. J. Vasc. Endovasc. Surg. 33(Suppl 1), S1–S75 (2007). 10.1016/j.ejvs.2006.09.024 [DOI] [PubMed] [Google Scholar]
- 4.Al-Qaisi D. M. N. M., King D. H., Kaddoura S., Hamady M., “Imaging of peripheral vascular disease,” Rep. Med. Imaging 2, 25–34 (2009). [Google Scholar]
- 5.Sanada H., Higashi Y., Goto C., Chayama K., Yoshizumi M., Sueda T., “Vascular function in patients with lower extremity peripheral arterial disease: a comparison of functions in upper and lower extremities,” Atherosclerosis 178(1), 179–185 (2005). 10.1016/j.atherosclerosis.2004.08.013 [DOI] [PubMed] [Google Scholar]
- 6.Finn A. V., Chandrashekhar Y., Narula J., “IVUS and OCT: either or survivor,” JACC Cardiovasc. Imaging 4(9), 1047–1049 (2011). 10.1016/j.jcmg.2011.08.002 [DOI] [PubMed] [Google Scholar]
- 7.Wolf U., Wolf M., Choi J. H., Levi M., Choudhury D., Hull S., Coussirat D., Paunescu L. A., Safonova L. P., Michalos A., Mantulin W. W., Gratton E., “Localized irregularities in hemoglobin flow and oxygenation in calf muscle in patients with peripheral vascular disease detected with near-infrared spectrophotometry,” J. Vasc. Surg. 37(5), 1017–1026 (2003). 10.1067/mva.2003.214 [DOI] [PubMed] [Google Scholar]
- 8.Casavola C., Paunescu L. A., Fantini S., Gratton E., “Blood flow and oxygen consumption with near-infrared spectroscopy and venous occlusion: spatial maps and the effect of time and pressure of inflation,” J. Biomed. Opt. 5(3), 269–276 (2000). 10.1117/1.429995 [DOI] [PubMed] [Google Scholar]
- 9.Mourant J. R., Freyer J. P., Hielscher A. H., Eick A. A., Shen D., Johnson T. M., “Mechanisms of light scattering from biological cells relevant to noninvasive optical-tissue diagnostics,” Appl. Opt. 37(16), 3586–3593 (1998). 10.1364/AO.37.003586 [DOI] [PubMed] [Google Scholar]
- 10.Schmitz C. H., Graber H. L., Luo H., Arif I., Hira J., Pei Y., Bluestone A., Zhong S., Andronica R., Soller I., Ramirez N., Barbour S. L., Barbour R. L., “Instrumentation and calibration protocol for imaging dynamic features in dense-scattering media by optical tomography,” Appl. Opt. 39(34), 6466–6486 (2000). 10.1364/AO.39.006466 [DOI] [PubMed] [Google Scholar]
- 11.Lasker J. M., Masciotti J. M., Schoenecker M., Schmitz C. H., Hielscher A. H., “Digital-signal-processor-based dynamic imaging system for optical tomography,” Rev. Sci. Instrum. 78(8), 083706 (2007). 10.1063/1.2769577 [DOI] [PubMed] [Google Scholar]
- 12.Carpenter C. M., Rakow-Penner R., Jiang S., Pogue B. W., Glover G. H., Paulsen K. D., “Monitoring of hemodynamic changes induced in the healthy breast through inspired gas stimuli with MR-guided diffuse optical imaging,” Med. Phys. 37(4), 1638–1646 (2010). 10.1118/1.3358123 [DOI] [PMC free article] [PubMed] [Google Scholar]
- 13.Flexman M. L., Khalil M. A., Al Abdi R., Kim H. K., Fong C. J., Desperito E., Hershman D. L., Barbour R. L., Hielscher A. H., “Digital optical tomography system for dynamic breast imaging,” J. Biomed. Opt. 16(7), 076014 (2011). 10.1117/1.3599955 [DOI] [PMC free article] [PubMed] [Google Scholar]
- 14.Lasker J. M., Fong C. J., Ginat D. T., Dwyer E., Hielscher A. H., “Dynamic optical imaging of vascular and metabolic reactivity in rheumatoid joints,” J. Biomed. Opt. 12(5), 052001 (2007). 10.1117/1.2798757 [DOI] [PubMed] [Google Scholar]
- 15.J. M. Masciotti, J. M. Lasker, and A. H. Hielscher, “Digital lock-in algorithm for biomedical spectroscopy and imaging instruments with multiple modulated sources,” in 28th Annual International Conference of the IEEE Engineering in Medicine and Biology Society, 2006. EMBS '06 (IEEE, 2006), Vol. 1, pp. 3198–3201. [DOI] [PubMed] [Google Scholar]
- 16.Ahmed N., Natarajan T., Rao K. R., “Discrete cosine transform,” IEEE Trans. Comput. C-23(1), 90–93 (1974). 10.1109/T-C.1974.223784 [DOI] [Google Scholar]
- 17.Kim H. K., Flexman M., Yamashiro D. J., Kandel J. J., Hielscher A. H., “PDE-constrained multispectral imaging of tissue chromophores with the equation of radiative transfer,” Biomed. Opt. Express 1(3), 812–824 (2010). 10.1364/BOE.1.000812 [DOI] [PMC free article] [PubMed] [Google Scholar]
- 18.Dehghani H., Pogue B. W., Shudong J., Brooksby B., Paulsen K. D., “Three-dimensional optical tomography: resolution in small-object imaging,” Appl. Opt. 42(16), 3117–3128 (2003). 10.1364/AO.42.003117 [DOI] [PubMed] [Google Scholar]
- 19.Pogue B. W., Davis S. C., Song X., Brooksby B. A., Dehghani H., Paulsen K. D., “Image analysis methods for diffuse optical tomography,” J. Biomed. Opt. 11(3), 033001 (2006). 10.1117/1.2209908 [DOI] [PubMed] [Google Scholar]


