Abstract
Lipodystrophies are characterized by a loss of white adipose tissue, which causes ectopic lipid deposition, peripheral insulin resistance, reduced adipokine levels, and increased food intake (hyperphagia). The growth factor myostatin (MSTN) negatively regulates skeletal muscle growth, and mice with MSTN inhibition have reduced adiposity and improved insulin sensitivity. MSTN inhibition may therefore be efficacious in ameliorating diabetes. To test this hypothesis, we inhibited MSTN signaling in a diabetic model of generalized lipodystrophy to analyze its effects on glucose metabolism separate from effects on adipose mass. A-ZIP/F1 lipodystrophic mice were crossed to mice expressing a dominant-negative MSTN receptor (activin receptor type IIB) in muscle. MSTN inhibition in A-ZIP/F1 mice reduced blood glucose, serum insulin, triglyceride levels, and the rate of triglyceride synthesis, and improved insulin sensitivity. Unexpectedly, hyperphagia was normalized by MSTN inhibition in muscle. Blood glucose and hyperphagia were reduced in double mutants independent of the adipokine leptin. These results show that the effect of MSTN inhibition on insulin sensitivity is not secondary to an effect on adipose mass and that MSTN inhibition may be an effective treatment for diabetes. These results further suggest that muscle may play a heretofore unappreciated role in regulating food intake.
The lipodystrophies are a heterogeneous group of inherited or acquired disorders caused by adipose tissue loss and the consequent reduction in lipid storage and adipokine levels (1,2). The lipodystrophic patients seen most frequently in the clinic today are HIV-infected patients taking highly active antiretroviral therapies (HAART) that include protease inhibitors (1,2). An estimated 40% of patients taking HAART for at least 1 year develop altered body fat distribution (3). Whether acquired or genetic, lipodystrophies are often associated with complications similar to those in obesity, such as insulin resistance (1,2). In both diseases, excess energy cannot be adequately stored in adipose tissue because adipocyte storage is filled to near capacity (obesity) or is absent (lipodystrophy) (4). As a consequence, excess lipid accumulates in skeletal muscle and liver and causes insulin resistance (5). Muscle is the primary site of insulin-stimulated glucose disposal (6), and as in obesity, an increase in the concentration of lipid in skeletal muscle is known to precede diabetes in a model of lipodystrophy, the A-ZIP/F1 mouse (hereafter called A-ZIP) (4,7).
Hyperphagia is another consequence of lipodystrophy due to the reduction in levels of the adipokine leptin (8). Leptin regulates energy balance and glucose metabolism (9), and leptin replacement therapy ameliorates the diabetic and hyperphagic phenotypes in lipodystrophic mice and patients (2,10,11). Children with Berardinelli-Seip congenital lipodystrophy, however, have been reported to develop resistance to leptin replacement therapy, likely due to an antileptin immune response (12). This result highlights a need for alternative therapies.
Myostatin (MSTN) is a member of the transforming growth factor-β (TGF-β) superfamily predominantly expressed in skeletal muscle that negatively regulates muscle mass during development and in adults (13–15). Of the receptors for TGF-β family members, MSTN has highest affinity for the activin receptor type IIB (ACVR2B, also known as ACTRIIB) (13). Mstn−/− mice and mice expressing a dominant-negative (DN) receptor transgene (DN-Acvr2b) specifically in skeletal muscle both have increased muscle mass, reduced adiposity, and increased insulin sensitivity compared with wild-type (WT) mice (16–18). There is some evidence, however, that MSTN signaling may affect insulin sensitivity by a mechanism other than directly regulating muscle mass or indirectly modulating adipose tissue mass. An increase in MSTN gene expression in muscle has been demonstrated in morbidly obese or insulin-resistant humans and in obese rodents, and these expression levels appear to be uncorrelated with muscle mass (19–23). Furthermore, MSTN worsens insulin tolerance without altering body composition (18,24). Taken together, these data suggest that the improved whole-body insulin sensitivity in Mstn−/− mice is not solely due to the effect of MSTN on the mass of muscle or adipose tissue.
Recent clinical trials indicate that resistance training improves insulin sensitivity in diabetic patients, suggesting a resistance exercise mimetic could be a useful therapy for diabetes (25). We therefore hypothesized that MSTN inhibition, a resistance exercise mimetic, could improve glucose control in diabetic animals. To analyze the effects of MSTN effects on hyperglycemia without the confounding effects of changes in white adipose tissue (WAT) mass or WAT cross talk with muscle, we chose to inhibit MSTN signaling in a diabetic lipodystrophy model.
RESEARCH DESIGN AND METHODS
Animals.
Animal experiments were approved by the National Institute of Diabetes and Digestive and Kidney Diseases (NIDDK) Animal Care and Use Committee, the National Institutes of Health (NIH). Mice were fed the NIH-07 chow diet (3.78 kcal/g, 12 kcal% fat) ad libitum, unless otherwise noted, and kept under a 12-h light/dark cycle. Muscle-DN transgenic mice expressing a DN Acvr2b transgene (containing coding sequences corresponding to the ACVR2B extracellular ligand-binding and transmembrane domains, but not the kinase domain) (26) on a C57BL/6 genetic background and A-ZIP (originally A-ZIP/F1) transgenic mice (27) on an FVB/N genetic background have been previously described. Lepob/ob mice on a C57BL/6 genetic background were purchased from The Jackson Laboratory. A-ZIP males were used to cross other mutant lines. For double transgenic mice (A-ZIP, Muscle-DN), F1 hybrid pups (50% FVB/N) were used for analysis. Lepob/+ mice were mated separately to A-ZIP mice and to Muscle-DN mice, and A-ZIP, Lepob/+ male offspring were mated to Lepob/+, Muscle-DN female offspring to generate triple A-ZIP, Muscle-DN, Lepob/ob mice for analysis (25% FVB/N).
Histology.
Tissues were fixed in 10% formalin, dehydrated, embedded in paraffin, sectioned, and stained with hematoxylin and eosin.
Insulin tolerance tests.
The insulin tolerance test was performed on fed mice as described (28). Blood glucose was measured in samples of tail blood at indicated intervals using an Elite Glucometer (Bayer Diagnostics).
Western blotting.
Insulin-stimulated phosphorylated (p)-Akt in vivo was detected as described (16). Quadriceps protein (30 μg) was incubated with anti-growth factor receptor-bound protein 14 (GRB14) and anti-glyceraldehyde-3-phosphate dehydrogenase (GAPDH) antibodies (Millipore).
Serum measurements.
Serum was collected by cardiac puncture under pentobarbital anesthesia (80 mg/kg body weight). Concentrations of serum insulin, leptin, peptide YY (PYY), glucagon-like peptide 1 (GLP-1), ghrelin, glucagon, and adiponectin (Millipore) were determined using a radioimmunoassay kit according to the manufacturer’s instructions. Serum triglycerides (Infinity triglycerides kit, Thermo) and free fatty acids (Half Micro Test kit, Roche) were determined by colorimetric methods according to the manufacturer’s instructions.
Tissue triglyceride measurements.
Concentrations of triglycerides from liver and gastrocnemius muscle were determined as described (16).
RNA isolation and quantitative (q)RT-PCR.
Total RNA was isolated using Trizol Reagent (Invitrogen) or RNAeasy kit (Qiagen) according to the manufacturer’s instructions. For real-time qRT-PCR, samples were digested with DNase, followed by reverse transcription of 200 ng total RNA using Superscript II (Invitrogen). cDNA was quantified on an ABI Prism 7000 Sequence Detection System using SYBR green master mix (Applied Biosystems) and indicated primers (Supplementary Table 1) and normalized to 18S rRNA expression.
Metabolic analyses.
Indirect calorimetry and activity measurements were performed as described (29). Lipid oxidation was assessed in conscious animals as described (30). In vivo triglyceride secretion was studied in conscious mice by measuring the increase in circulating triglycerides after lipase inhibition by WR1339 (Sigma), as described (31). Urine samples were collected during 24 h when mice were individually caged in mouse metabolic chambers (Harvard Apparatus) after 2 days of acclimation. Urine glucose was measured with a glucose assay kit (BioVision). Hyperinsulinemic-euglycemic clamps were performed as described (16).
Food intake measurement.
Mice were acclimated to individual cages for 1 week, and then food intake and body weight was measured daily or weekly.
Statistical analysis.
Results are expressed as mean ± SEM. Blood glucose, insulin tolerance, and in vivo triglyceride synthesis assays were analyzed by repeated measures ANOVA (SPSS 16.0 software). Mstn and leptin expression and muscle triglycerides were analyzed by the two-tailed Student t test. All other data were analyzed by one-way ANOVA. Nonhomogeneous data, as determined by a Levene test, were log-transformed to restore equal variance before ANOVA analysis. A Tukey post hoc test was used to determine the source of differences. P < 0.05 was considered significant.
RESULTS
Muscle-specific MSTN inhibition rescues lipodystrophic diabetes.
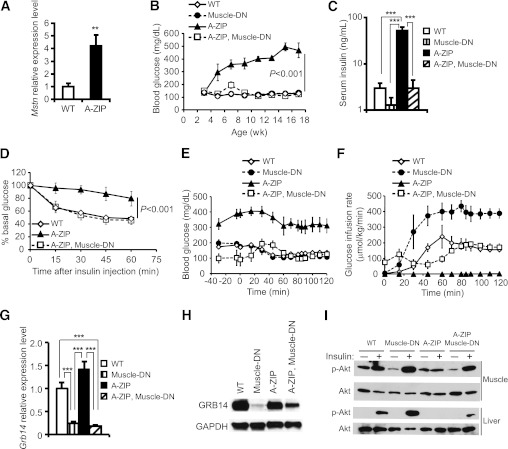
A-ZIP mice overexpress a transgene encoding a DN leucine zipper transcription factor that blocks white fat adipogenesis, and these mice have all the hallmarks of lipodystrophic diabetes (8,32). We found that the expression of Mstn mRNA in gastrocnemius muscle from A-ZIP mice is fourfold higher than in muscle from nontransgenic mice (Fig. 1A). To determine whether inhibition of MSTN signaling in muscle could improve diabetes in mice lacking WAT, we crossed mice overexpressing a muscle-specific DN-Acvr2b transgene (Muscle-DN) to A-ZIP mice. A-ZIP, Muscle-DN double transgenic mice had greatly increased skeletal muscle mass without rescue of WAT, an increase in brown adipose tissue (BAT), or a change in body weight compared with A-ZIP mice (Supplementary Table 2 and Supplementary Fig. 1). To analyze the effect of MSTN inhibition on diabetes, we measured fed blood glucose for 14 weeks starting from weaning. We found that hyperglycemia in male and female A-ZIP mice was completely rescued by the Muscle-DN transgene (Fig. 1B and Supplementary Fig. 2). In addition, the elevated urine glucose in diabetic A-ZIP mice was also normalized in A-ZIP, Muscle-DN transgenic mice (data not shown). These results show that MSTN inhibition in skeletal muscle prevented the development of diabetes in this lipodystrophic model.
FIG. 1.
Amelioration of diabetes by muscle-specific inhibition of MSTN signaling in A-ZIP mice. A: Mstn mRNA levels in gastrocnemius muscles of A-ZIP (n = 7) vs. WT mice (n = 6). B: Blood glucose levels in male WT mice, Muscle-DN mice, A-ZIP mice, and A-ZIP, Muscle-DN mice taken biweekly (n = 6 for each genotype). C: Serum insulin concentrations of male mice measured at age 5 months (n = 4–6 for each genotype). D: Insulin tolerance tests performed on fed male WT mice, A-ZIP mice, and A-ZIP, Muscle-DN mice at age 12 weeks (n = 5–6 for each genotype). E: Plasma glucose concentration before and during hyperinsulinemic-euglycemic clamp starting at time 0 (n = 5–7 for each genotype). F: Glucose infusion rate during clamp (n = 5–7 for each genotype). G: Grb14 mRNA levels in gastrocnemius muscles (n = 5–6 for each genotype). H: Representative Western blots of GRB14 protein levels in quadriceps muscle relative to GAPDH. I: Representative Western blots of p-Akt (Ser473) in gastrocnemius muscle and liver samples in response to intraperitoneal insulin injection (n = 3 for each genotype). Results are presented as mean ± SEM. B and D: Significance of repeated-measures ANOVA is marked. **P < 0.01, ***P < 0.001.
Insulin sensitivity and signaling.
A-ZIP, Muscle-DN mice had significantly reduced serum insulin levels compared with A-ZIP mice, suggesting that hyperglycemia was rescued by increased insulin sensitivity rather than increased insulin production (Fig. 1C and Supplementary Fig. 2). To examine whole-body insulin sensitivity, we performed insulin tolerance tests. Insulin treatment reduced blood glucose in A-ZIP, Muscle-DN mice similarly to WT mice, whereas A-ZIP mice were largely unresponsive to insulin (Fig. 1D and Supplementary Fig. 2). We also performed hyperinsulinemic-euglycemic clamp studies to further examine insulin sensitivity. A-ZIP mice were so insulin resistant and hyperglycemic that no glucose was needed to maintain blood glucose levels during the clamp (Fig. 1E and F and Supplementary Fig. 3). In contrast, the glucose infusion rate in Muscle-DN mice was almost twice that of WT mice, demonstrating greater than normal insulin sensitivity. The glucose infusion rate during the clamp in A-ZIP, Muscle-DN mice, however, was most similar to that of WT mice (Fig. 1E and F). Taken together, these data demonstrate that MSTN inhibition in muscle improved insulin sensitivity in A-ZIP mice.
Treatment with MSTN inhibitors increases muscle expression of the insulin-sensitizing adipokine adiponectin in obese mice (33). Serum adiponectin concentrations, however, were not restored in A-ZIP, Muscle-DN mice (Supplementary Fig. 4).
Reduced MSTN gene expression in muscle after weight loss by bariatric surgery is correlated with reduced expression of GRB14, an inhibitor of the insulin receptor (23). Grb14−/− mice are more insulin sensitive than WT mice and have increased activation of the serine/threonine kinase Akt in muscle in response to insulin (34). Grb14 expression in muscle from A-ZIP, Muscle-DN and Muscle-DN mice was significantly decreased compared with both WT and A-ZIP mice (Fig. 1G). Protein levels were also reduced (Fig. 1H). Consistent with improved insulin signaling, A-ZIP, Muscle-DN mice had a greater increase in phosphorylation of Akt in muscle after insulin treatment compared with A-ZIP mice (Fig. 1I).
To determine whether liver insulin resistance was also improved by MSTN inhibition in muscle, we analyzed the level of insulin-stimulated p-Akt in liver. Consistent with their insulin resistant phenotype, p-Akt in liver from A-ZIP mice was not detectable after insulin injection (Fig. 1I). A-ZIP, Muscle-DN mice, however, had an easily detectable level of insulin-stimulated p-Akt in liver, demonstrating enhanced insulin signaling (Fig. 1I).
Improved dyslipidemia in A-ZIP, Muscle-DN mice.
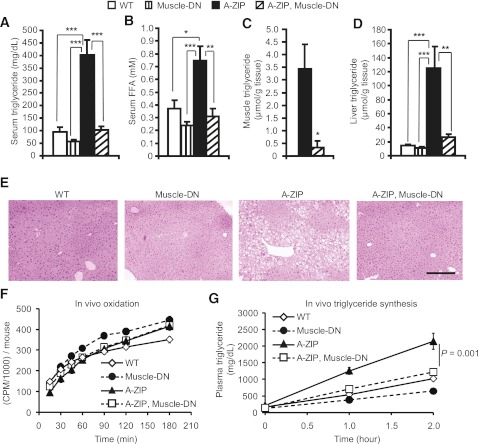
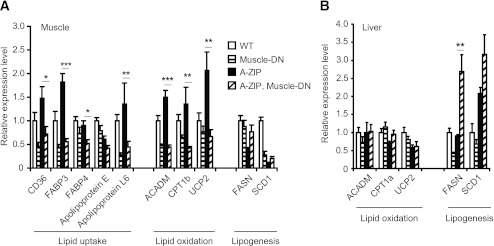
Because elevated lipids can cause insulin resistance and A-ZIP mice have greatly increased triglyceride levels, we examined A-ZIP, Muscle-DN mice for evidence of improved lipid metabolism. The severe hypertriglyceridemia and elevated circulating free fatty acids found in A-ZIP mice were normalized in A-ZIP, Muscle-DN mice (Fig. 2A and B). In muscle, triglyceride levels were greatly reduced in A-ZIP, Muscle-DN mice compared with A-ZIP mice (Fig. 2C), and expression of genes for lipid uptake was reduced (Fig. 3A). The hepatic triglyceride levels found in A-ZIP mice were dramatically decreased to nearly normal levels by MSTN inhibition in A-ZIP skeletal muscle, leading to normalized liver weights and appearance (Fig. 2D and E, and Supplementary Table 2).
FIG. 2.
Dyslipidemia is improved by muscle-specific inhibition of MSTN signaling in A-ZIP mice. Serum triglycerides (A) and free fatty acids (FFA) (B) in male WT mice, Muscle-DN mice, A-ZIP mice, and A-ZIP, Muscle-DN mice at age 5 months (n = 7–9 for each genotype). Triglyceride concentration in gastrocnemius muscle (C) and liver (D) at age 5 months (n = 6). E: Representative liver histology by hematoxylin and eosin staining. Scale bar = 100 μm. F: Rate of oleic acid oxidation per mouse (n = 6–8 for each genotype). G: Rate of in vivo triglyceride synthesis obtained by measuring the accumulation of circulating triglycerides after inhibition of lipolysis by WR1339 (n = 5–9 for each genotype). Results are presented as mean ± SEM. Significance of repeated measures ANOVA is marked. *P < 0.05, **P < 0.01, ***P < 0.001. (A high-quality digital representation of this figure is available in the online issue.)
FIG. 3.
Gene expression patterns in tissues from WT mice, Muscle-DN mice, A-ZIP mice, and A-ZIP, Muscle-DN mice. Relative mRNA levels of lipid metabolism genes measured by qRT-PCR in muscle (A) and liver (B) samples of WT, Muscle-DN, A-ZIP and A-ZIP, Muscle-DN mice (n = 5–6 for all genotypes). Results are presented as mean ± SEM. Significant differences between A-ZIP and A-ZIP, Muscle-DN mice are marked. *P < 0.05, **P < 0.01, ***P < 0.001. CD36, cluster of differentiation 36; FABP, fatty acid binding protein; ACADM, acyl-coA dehydrogenase, medium chain; CPT1b, carnitine palmitoyltransferase 1b; UCP2, uncoupling protein 2.
We next tried to determine whether an increase in lipid oxidation caused the decrease in triglyceride levels in A-ZIP, Muscle-DN mice. A-ZIP, Muscle-DN muscle had reduced expression of genes involved in fatty acid binding, transport, and oxidation compared with A-ZIP muscle (Fig. 3A). The rate of lipid oxidation in vivo or in isolated soleus muscle from A-ZIP, Muscle-DN mice, however, was not significantly different from A-ZIP mice, although both lipodystrophic genotypes had higher muscle lipid oxidation rates than Muscle-DN mice (Fig. 2F and Supplementary Fig. 5). In liver, there was no increase in expression of genes for lipid oxidation in A-ZIP, Muscle-DN mice compared with A-ZIP mice (Fig. 3B).
The rate of hepatic lipogenesis is elevated in patients with type 2 diabetes (5), so altered lipogenesis could potentially contribute to the amelioration of lipidemia in A-ZIP, Muscle-DN mice. The expression of genes for lipogenesis, fatty acid synthase (Fasn), and stearoyl-CoA desaturase 1 (Scd1), were reduced in A-ZIP muscle compared with nontransgenic control muscle (Fig. 3A). They were not, however, expressed at significantly different levels in A-ZIP, Muscle-DN muscle than in A-ZIP muscle (Fig. 3A). Fasn expression was significantly higher in A-ZIP, Muscle-DN liver compared with A-ZIP liver (Fig. 3B) even though hepatic triglyceride levels were reduced. Despite this increased Fasn expression, the in vivo triglyceride synthesis rate in A-ZIP, Muscle-DN mice, which mainly reflects hepatic triglyceride output, was significantly lower than in A-ZIP mice (Fig. 2G), demonstrating that reduced lipogenesis rather than increased oxidation is likely the cause of the improved triglyceridemia.
Energy balance.
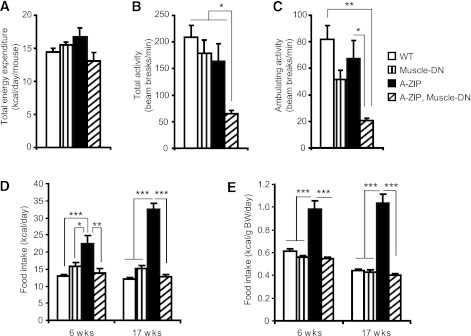
To determine whether altered energy balance contributed to the improvement in dyslipidemia and glucose metabolism, we analyzed energy expenditure, activity, and food intake. No significant differences were detected in total energy expenditure between genotypes as measured by indirect calorimetry (Fig. 4A and Supplementary Table 3). Locomotor activity levels in A-ZIP, Muscle-DN mice, however, were significantly lower than those of all other genotypes (Fig. 4B and C). These data suggest that an increase in energy expenditure does not explain the reduction in dyslipidemia and hyperglycemia.
FIG. 4.
Decreased activity and improved hyperphagia caused by muscle-specific inhibition of MSTN signaling in A-ZIP mice. Total energy expenditure (A), total activity (B), and ambulating activity (C) of male WT mice, Muscle-DN mice, A-ZIP mice, and A-ZIP, Muscle-DN mice measured at age 5 months (n = 5–7 for each genotype). Daily food intake per mouse (D) and normalized to body weight of WT, Muscle-DN, A-ZIP, and A-ZIP, Muscle-DN mice (E) measured at age 6 and 17 weeks (n = 5–8). BW, body weight. Results are presented as mean ± SEM. *P < 0.05, **P < 0.01, ***P < 0.001.
A-ZIP mice have greatly increased energy intake (27). Surprisingly, inhibition of skeletal muscle MSTN signaling in A-ZIP mice reduced food intake to levels comparable to those of WT and Muscle-DN mice (Fig. 4D and E). We therefore examined the expression levels of several known regulators of food intake in the hypothalamus, including the orexigenic peptides agouti-related protein (AgRP) and neuropeptide Y (Npy) and the anorexigenic pro-opiomelanocortin precursor (Pomc). Expression of Npy, AgRP, and Pomc were not significantly different between A-ZIP and A-ZIP, Muscle-DN mice (Supplementary Fig. 6).
Signaling by the melanocortin 4 receptor (MC4R), which is antagonized by AgRP, inhibits food intake (35), and melanotan II (MTII), a synthetic agonist of MC3R and MC4R, causes an inhibition of food intake when injected into rodents (36). To determine whether the melanocortin-signaling pathway downstream of MC3R or MC4R is blocked in A-ZIP mice or enhanced in A-ZIP, Muscle-DN mice, we injected MTII and measured food intake during a 24-h period relative to prior intake. There were no statistically significant differences in the suppression of food intake caused by MTII treatment between genotypes, indicating that signaling downstream of MC3R and MC4R is intact in all genotypes (Supplementary Fig. 6).
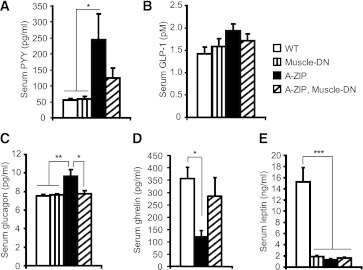
Finally, we measured the levels of anorectic factors, the gastrointestinal hormones PYY and GLP-1, the pancreatic hormone glucagon, and the orexigenic gastrointestinal hormone ghrelin (37,38). Serum total PYY levels were significantly increased in A-ZIP mice but were not as elevated in A-ZIP, Muscle-DN mice (Fig. 5A). Serum GLP-1 was not different among the four genotypes (Fig. 5B). Serum glucagon was elevated in A-ZIP mice but was not different between nontransgenic, Muscle-DN, and A-ZIP, Muscle-DN mice (Fig. 5C). Thus, an increase in satiety hormones does not seem to explain the reduced hyperphagia in A-ZIP, Muscle-DN mice. Despite the increased food intake in A-ZIP mice, ghrelin was reduced in serum compared with nontransgenic mice (Fig. 5D). A-ZIP, Muscle-DN mice had normal levels of ghrelin, indicating that lower levels of this orexigenic hormone are not responsible for their reduced food intake (Fig. 5D).
FIG. 5.
Serum concentration of regulators of food intake in A-ZIP mice with or without muscle-specific inhibition of MSTN signaling. Serum concentrations of total PYY (A), GLP-1 (pM, pmol/L) (B), glucagon (C), ghrelin (D), and leptin (E) were measured in serum from fed mice (n = 6–9 for each genotype, except ghrelin WT (n = 3). Results are presented as mean ± SEM. *P < 0.05, **P < 0.01, ***P < 0.001.
Improvement in diabetes and hyperphagia is leptin independent.
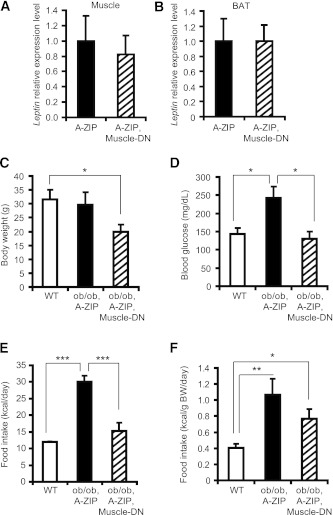
Diabetes and hyperphagia in lipodystrophic mice and patients can be ameliorated by leptin treatment (10). Leptin gene expression has been reported in other tissues besides WAT, including skeletal muscle and BAT (39), so we examined leptin expression in different tissues from A-ZIP and double-transgenic mice. We did not find an increase in leptin expression in these tissues in A-ZIP, Muscle-DN mice compared with A-ZIP mice (Fig. 6A and B), and leptin expression was also undetectable in whole brain or hypothalamus from A-ZIP or A-ZIP, Muscle-DN mice (data not shown). In addition, circulating leptin levels in A-ZIP, Muscle-DN mice were not restored (Fig. 5E).
FIG. 6.
Reduced glycemia and hyperphagia caused by muscle-specific inhibition of MSTN signaling in A-ZIP mice is leptin independent. Leptin mRNA levels were determined by qRT-PCR in gastrocnemius muscle (A) or BAT (B) of WT mice, Muscle-DN mice, A-ZIP mice, and A-ZIP, Muscle-DN mice (n = 4–6). Body weight (C), blood glucose (D), and food intake (E) per mouse and normalized to body weight (BW) (F) of WT (n = 7), ob/ob, A-ZIP (n = 3), and ob/ob, A-ZIP, Muscle-DN (n = 3) mice measured at age 12 weeks. Results are presented as mean ± SEM. *P < 0.05, **P < 0.01, ***P < 0.001.
To definitively rule out the possibility that the metabolic changes were leptin dependent, we examined the A-ZIP, Muscle-DN phenotype in a Lepob/ob leptin-deficient background. Triple-mutant mice were smaller than A-ZIP, Lepob/ob double-mutant mice (Fig. 6C), and two of five died in early adulthood of unexplained causes. The three survivors had normal blood glucose levels, whereas three A-ZIP, Lepob/ob double-mutant mice were hyperglycemic (Fig. 6D). Total food intake in triple mutants was significantly reduced to approximately half that of A-ZIP, Lepob/ob mice, although when normalized to body weight, food intake was nonsignificantly reduced by ∼30% (Fig. 6E and F). The decrease in hyperglycemia and food intake in A-ZIP, Muscle-DN compared with A-ZIP mice in the complete absence of leptin indicates that these improvements are leptin independent.
Improvement in diabetes and hyperphagia is due to MSTN inhibition in muscle.
We do not believe that misexpression of the Muscle-DN transgene in a nonmuscle tissue might be causing the improved glycemia or energy intake for the following reasons:
1) We could not detect an increase in expression of the Acvr2b ligand-binding domain by qRT-PCR in whole brain or hypothalamus from A-ZIP, Muscle-DN mice (data not shown), suggesting that misexpression of the transgene centrally is not the mechanism for the improved metabolism.
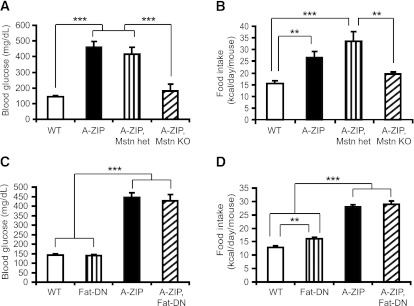
2) A-ZIP, Mstn−/− mice have reduced hyperglycemia and hyperphagia compared with A-ZIP, Mstn+/− mice, suggesting that aberrant expression of the Muscle-DN transgene does not ameliorate the diabetic phenotype in A-ZIP, Muscle-DN mice (Fig. 7A and B). This also demonstrates that the DN ACVR2B protein in A-ZIP, Muscle-DN mice is predominantly inhibiting MSTN rather than other ACVR2B ligands.
FIG. 7.
Global but not BAT-specific loss of MSTN signaling reduces blood glucose and food intake in A-ZIP mice. A: Blood glucose of WT mice, A-ZIP mice, double-mutant Mstn heterozygous (het) A-ZIP mice, and double-mutant A-ZIP, Mstn null (KO) mice. B: Daily food intake of Mstn heterozygous mice, A-ZIP mice, double-mutant Mstn heterozygous, A-ZIP mice, and double-mutant A-ZIP, Mstn null mice (n = 4–7 for each genotype at age 12 weeks). Blood glucose (C) and daily food intake (D) in WT mice, mice expressing a fat-specific DN Acvr2b receptor transgene (Fat-DN), A-ZIP mice, and double-transgenic A-ZIP, Fat-DN mice measured at age 12 weeks (n = 5–8 for each genotype). Results are presented as mean ± SEM. **P < 0.01, ***P < 0.001.
3) Although low levels of expression of the Muscle-DN transgene are found in BAT (16), expression of a WAT- and BAT-specific DN-Acvr2b transgene in A-ZIP mice does not normalize the hyperglycemia or hyperphagia (Fig. 7C and D). Thus, inhibition of MSTN signaling in skeletal muscle is most likely the primary cause of rescue of the lipodystrophic phenotype in A-ZIP, Muscle-DN mice.
DISCUSSION
We show here that blocking ACVR2B signaling in muscle prevented the development of diabetes and hyperphagia in lipodystrophic mice independent of leptin or WAT restoration. In addition, transgenic overexpression of the DN-Acvr2b in muscle in A-ZIP mice also reduced insulin, circulating free fatty acids and triglycerides, and muscle and hepatic triglycerides. Although these are favorable metabolic effects, A-ZIP, Muscle-DN mice also had reduced activity levels compared with other genotypes and reduced body weight compared with Muscle-DN mice, despite increased muscle mass. These effects may be consequences of reduced energy intake coupled with a lack of energy storage in the form of WAT and hepatic triglycerides.
Increased lipid in skeletal muscle and liver in these tissues before the development of diabetes is thought to impair insulin signaling in the A-ZIP mice (7). Consistent with this explanation, triglyceride levels and insulin signaling are both improved in A-ZIP, Muscle-DN muscle and liver. Thus, the decreased lipidemia is likely to be the main explanation for the improved insulin sensitivity. In addition to the reduction in triglyceride levels, our results also show that insulin signaling may be further enhanced by a reduction in the level of GRB14 in muscle in both Muscle-DN and A-ZIP, Muscle-DN mice compared with WT mice. Our results, taken together with the decrease in GRB14 and MSTN expression in morbidly obese patients after bariatric surgery (23), suggest that GRB14 may be downstream of MSTN signaling to inhibit insulin signaling.
Our results are consistent with a growing body of evidence that altering metabolism in skeletal muscle can have profound effects on the metabolism of other tissues. Increased glucose uptake in muscle, reduced adiposity, and increased hepatic insulin sensitivity are found in mice that become muscular by MSTN inhibition before or simultaneous with a high-fat diet challenge (14). We previously showed that these effects are mediated by blocking MSTN in skeletal muscle rather than in adipose tissue because inhibiting MSTN signaling in adipocytes does not affect body composition or insulin sensitivity (16). Similarly, muscle hypertrophy caused by activation of an inducible constitutively active Akt1 transgene expressed specifically in muscle results in a loss of WAT mass in obese mice (40). The increased whole-body insulin sensitivity in Muscle-DN mice could be a result of muscle hypertrophy, the secondary decrease in adiposity, the direct inhibition of the MSTN signaling cascade in muscle, or some combination of these factors. Our study using a diabetic model with no WAT suggests that the improvement in glucose and lipid metabolism in other mouse models with muscle hypertrophy (14) is not merely a secondary effect of decreased WAT mass. This is consistent with the improved glucose metabolism in the absence of weight loss found in Lepob/ob mice receiving anti-MSTN antibody therapy (33).
The reduced hyperphagia in A-ZIP, Muscle-DN mice was the most unexpected finding. Given the varying energy demands of muscle undergoing different types and levels of activity, it seems plausible that a feedback loop emanating from skeletal muscle to the brain to regulate energy intake could exist. A role for MSTN in food intake has not been described previously, however, and one might expect that increasing muscle mass would increase food intake. The reduced energy intake alone would not seem to fully explain the improved glycemia in A-ZIP mice caused by MSTN inhibition. Restricting food intake in lipodystrophic mouse models, including A-ZIP mice, does not rescue hyperglycemia (41,42). Conversely, our results cannot definitively rule out the possibility that reduced blood glucose itself caused the reduction in food intake, although we think it unlikely. Intraperitoneal glucose injection inhibits food intake in rats (43), and type 2 diabetic patients consume fewer calories during a hyperglycemic clamp compared with a euglycemic clamp (44). These studies suggest that reducing hyperglycemia might stimulate, rather than suppress, appetite. Moreover, energy intake is unchanged in ob/ob mice treated with anti-MSTN antibodies even though fed and fasting blood glucose is reduced compared with untreated mice (33).
Energy intake is regulated by a complex web of multiple mechanisms acting on the central nervous system (CNS) in the hypothalamus and brainstem. Secreted protein hormones from the peripheral tissues, such as insulin and leptin, act on neurons in the hypothalamus to inhibit food intake (35,45,46). In addition, nutrients, such as glucose, lipids, and amino acids, are detected in the CNS by direct and indirect mechanisms and may regulate energy intake (47,48). For example, central infusion of palmitic acid can inhibit the signaling of leptin and insulin in the hypothalamus (49). The gut itself is able to sense nutrient levels from ingested food and communicate with the brain via a neuronal network to regulate whole-body energy and glucose metabolism (47). In particular, glucose sensing in the gut stimulates skeletal muscle glucose utilization, an effect abolished by the intracerebroventricular administration of a GLP-1 receptor antagonist (50). In theory, increased skeletal muscle mass or decreased MSTN signaling in muscle could alter nutrient availability or levels of a hormone that then acts directly on the CNS or indirectly by regulating an anorexigenic or orexigenic signal from another tissue under specific conditions present in A-ZIP mice. Although we measured the levels of several known regulators of energy intake, we have not yet identified the mechanism by which MSTN inhibition reduces energy intake in A-ZIP mice. Leptin restoration does not explain our results, and levels of the anorectic hormone GLP-1 are not elevated in A-ZIP, Muscle-DN mice. A-ZIP mice paradoxically had higher-than-normal levels of anorectic hormones PYY and glucagon and lower-than-normal levels of the orexigenic hormone ghrelin, suggesting these hormones are compensating for, rather than causing, the increased energy intake.
Our results here show for the first time that MSTN inhibition is effective in a diabetic model. They suggest that anti-MSTN therapy may be useful for reducing blood glucose and hyperphagia in lipodystrophic diabetic patients, particularly those who do not respond to leptin treatment. Future studies will be required to determine whether MSTN inhibition might be clinically useful to treat lipodystrophy in conjunction with leptin therapy or in models of HAART-induced lipodystrophy. This work also raises the possibility of a muscle–brain axis that regulates food intake. It seems unlikely that MSTN itself is a hormone that directly regulates energy intake in the brain because A-ZIP, Muscle-DN and A-ZIP, Mstn−/− mice both have reduced energy intake. The identification of this muscle-feedback signal remains to be determined.
ACKNOWLEDGMENTS
This work is supported by the Intramural Research Program of the NIH, NIDDK.
Under a licensing agreement between Pfizer and the Johns Hopkins University, A.C.M. is entitled to a share of the royalty received by the Johns Hopkins University on sales of the factor described in this article. The terms of these arrangements are being managed by Johns Hopkins University in accordance with its conflict of interest policies. No other potential conflicts of interest relevant to this article were reported.
T.G. conceived the study, designed the experiments, analyzed and interpreted data, and wrote the manuscript. N.D.B. performed insulin-signaling analysis, analyzed and interpreted data, and contributed to writing the manuscript. W.J. performed the lipid oxidation experiments, clamps, and urine glucose measurements. O.G. conducted experiments and the lipogenesis assay, analyzed and interpreted data, and contributed to writing the manuscript. J.P. performed mouse matings and genotyping. A.C.M. contributed to experiment design, analyzed and interpreted data, and wrote the manuscript. A.C.M. is the guarantor of this work and, as such, had full access to all of the data in the study and takes responsibility for the integrity of the data and the accuracy of the data analysis.
The authors thank Kathleen Savage, Min Chen, Mark St. Claire, Se-Jin Lee, Suchismita Chandran, and Yizhou Ye of NIDDK and Mannix Auger-Messier of Cincinnati Children's Hospital Medical Center for technical advice, and Tatyana Chanturiya of NIDDK for performing indirect calorimetry.
Footnotes
This article contains Supplementary Data online at http://diabetes.diabetesjournals.org/lookup/suppl/doi:10.2337/db11-0915/-/DC1.
T.G. is currently affiliated with the Department of Neuroscience, Karolinska Institutet, Stockholm, Sweden.
REFERENCES
- 1.Garg A. Acquired and inherited lipodystrophies. N Engl J Med 2004;350:1220–1234 [DOI] [PubMed] [Google Scholar]
- 2.Fiorenza CG, Chou SH, Mantzoros CS. Lipodystrophy: pathophysiology and advances in treatment. Nat Rev Endocrinol 2011;7:137–150 [DOI] [PMC free article] [PubMed] [Google Scholar]
- 3.Chen D, Misra A, Garg A. Clinical review 153: Lipodystrophy in human immunodeficiency virus-infected patients. J Clin Endocrinol Metab 2002;87:4845–4856 [DOI] [PubMed] [Google Scholar]
- 4.Savage DB, Petersen KF, Shulman GI. Disordered lipid metabolism and the pathogenesis of insulin resistance. Physiol ev 2007;87:507–520 [DOI] [PMC free article] [PubMed] [Google Scholar]
- 5.Samuel VT, Petersen KF, Shulman GI. Lipid-induced insulin resistance: unravelling the mechanism. Lancet 2010;375:2267–2277 [DOI] [PMC free article] [PubMed] [Google Scholar]
- 6.DeFronzo RA, Tripathy D. Skeletal muscle insulin resistance is the primary defect in type 2 diabetes. Diabetes Care 2009;32(Suppl. 2):S157–S163 [DOI] [PMC free article] [PubMed] [Google Scholar]
- 7.Kim JK, Gavrilova O, Chen Y, Reitman ML, Shulman GI. Mechanism of insulin resistance in A-ZIP/F-1 fatless mice. J Biol Chem 2000;275:8456–8460 [DOI] [PubMed] [Google Scholar]
- 8.Savage DB. Mouse models of inherited lipodystrophy. Dis Model Mech 2009;2:554–562 [DOI] [PubMed] [Google Scholar]
- 9.Farooqi IS, O’Rahilly S. Leptin: a pivotal regulator of human energy homeostasis. Am J Clin Nutr 2009;89:980S–984S [DOI] [PubMed] [Google Scholar]
- 10.Park JY, Gavrilova O, Gorden P. The clinical utility of leptin therapy in metabolic dysfunction. Minerva Endocrinol 2006;31:125–131 [PubMed] [Google Scholar]
- 11.Simha V, Garg A. Inherited lipodystrophies and hypertriglyceridemia. Curr Opin Lipidol 2009;20:300–308 [DOI] [PubMed] [Google Scholar]
- 12.Beltrand J, Lahlou N, Le Charpentier T, et al. Resistance to leptin-replacement therapy in Berardinelli-Seip congenital lipodystrophy: an immunological origin. Eur J Endocrinol 2010;162:1083–1091 [DOI] [PubMed] [Google Scholar]
- 13.Lee SJ. Extracellular regulation of myostatin: a molecular rheostat for muscle mass. Immunol Endocr Metab Agents Med Chem 2010;10:183–194 [DOI] [PMC free article] [PubMed] [Google Scholar]
- 14.McPherron AC. Metabolic functions of myostatin and GDF11. Immunol Endocr Metab Agents Med Chem 2010;10:217–231 [DOI] [PMC free article] [PubMed] [Google Scholar]
- 15.Otto A, Matsakas A, Patel K. Developmental role for myostatin in regulating myogenesis. Immunol Endocr Metab Agents Med Chem 2010;10:195–203 [Google Scholar]
- 16.Guo T, Jou W, Chanturiya T, Portas J, Gavrilova O, McPherron AC. Myostatin inhibition in muscle, but not adipose tissue, decreases fat mass and improves insulin sensitivity. PLoS One 2009;4:e4937. [DOI] [PMC free article] [PubMed] [Google Scholar]
- 17.Hamrick MW, Pennington C, Webb CN, Isales CM. Resistance to body fat gain in ‘double-muscled’ mice fed a high-fat diet. Int J Obes (Lond) 2006;30:868–870 [DOI] [PubMed] [Google Scholar]
- 18.Wilkes JJ, Lloyd DJ, Gekakis N. Loss-of-function mutation in myostatin reduces tumor necrosis factor alpha production and protects liver against obesity-induced insulin resistance. Diabetes 2009;58:1133–1143 [DOI] [PMC free article] [PubMed] [Google Scholar]
- 19.Allen DL, Cleary AS, Speaker KJ, et al. Myostatin, activin receptor IIb, and follistatin-like-3 gene expression are altered in adipose tissue and skeletal muscle of obese mice. Am J Physiol Endocrinol Metab 2008;294:E918–E927 [DOI] [PubMed] [Google Scholar]
- 20.Hittel DS, Berggren JR, Shearer J, Boyle K, Houmard JA. Increased secretion and expression of myostatin in skeletal muscle from extremely obese women. Diabetes 2009;58:30–38 [DOI] [PMC free article] [PubMed] [Google Scholar]
- 21.Milan G, Dalla Nora E, Pilon C, et al. Changes in muscle myostatin expression in obese subjects after weight loss. J Clin Endocrinol Metab 2004;89:2724–2727 [DOI] [PubMed] [Google Scholar]
- 22.Palsgaard J, Brøns C, Friedrichsen M, et al. Gene expression in skeletal muscle biopsies from people with type 2 diabetes and relatives: differential regulation of insulin signaling pathways. PLoS One 2009;4:e6575. [DOI] [PMC free article] [PubMed] [Google Scholar]
- 23.Park JJ, Berggren JR, Hulver MW, Houmard JA, Hoffman EP. GRB14, GPD1, and GDF8 as potential network collaborators in weight loss-induced improvements in insulin action in human skeletal muscle. Physiol Genomics 2006;27:114–121 [DOI] [PubMed] [Google Scholar]
- 24.Hittel DS, Axelson M, Sarna N, Shearer J, Huffman KM, Kraus WE. Myostatin decreases with aerobic exercise and associates with insulin resistance. Med Sci Sports Exerc 2010;42:2023–2029 [DOI] [PMC free article] [PubMed] [Google Scholar]
- 25.Tresierras MA, Balady GJ. Resistance training in the treatment of diabetes and obesity: mechanisms and outcomes. J Cardiopulm Rehabil Prev 2009;29:67–75 [DOI] [PubMed] [Google Scholar]
- 26.Lee S-J, McPherron AC. Regulation of myostatin activity and muscle growth. Proc Natl Acad Sci USA 2001;98:9306–9311 [DOI] [PMC free article] [PubMed] [Google Scholar]
- 27.Moitra J, Mason MM, Olive M, et al. Life without white fat: a transgenic mouse. Genes Dev 1998;12:3168–3181 [DOI] [PMC free article] [PubMed] [Google Scholar]
- 28.Zhao B, Wall RJ, Yang J. Transgenic expression of myostatin propeptide prevents diet-induced obesity and insulin resistance. Biochem Biophys Res Commun 2005;337:248–255 [DOI] [PubMed] [Google Scholar]
- 29.Yu S, Gavrilova O, Chen H, et al. Paternal versus maternal transmission of a stimulatory G-protein alpha subunit knockout produces opposite effects on energy metabolism. J Clin Invest 2000;105:615–623 [DOI] [PMC free article] [PubMed] [Google Scholar]
- 30.Gautam D, Gavrilova O, Jeon J, et al. Beneficial metabolic effects of M3 muscarinic acetylcholine receptor deficiency. Cell Metab 2006;4:363–375 [DOI] [PubMed] [Google Scholar]
- 31.Colombo C, Haluzik M, Cutson JJ, et al. Opposite effects of background genotype on muscle and liver insulin sensitivity of lipoatrophic mice. Role of triglyceride clearance. J Biol Chem 2003;278:3992–3999 [DOI] [PubMed] [Google Scholar]
- 32.Asterholm IW, Halberg N, Scherer PE. Mouse models of lipodystrophy key reagents for the understanding of the metabolic syndrome. Drug Discov Today Dis Models 2007;4:17–24 [DOI] [PMC free article] [PubMed] [Google Scholar]
- 33.Bernardo BL, Wachtmann TS, Cosgrove PG, et al. Postnatal PPARdelta activation and myostatin inhibition exert distinct yet complimentary effects on the metabolic profile of obese insulin-resistant mice. PLoS One 2010;5:e11307. [DOI] [PMC free article] [PubMed] [Google Scholar]
- 34.Cooney GJ, Lyons RJ, Crew AJ, et al. Improved glucose homeostasis and enhanced insulin signalling in Grb14-deficient mice. EMBO J 2004;23:582–593 [DOI] [PMC free article] [PubMed] [Google Scholar]
- 35.Könner AC, Klöckener T, Brüning JC. Control of energy homeostasis by insulin and leptin: targeting the arcuate nucleus and beyond. Physiol Behav 2009;97:632–638 [DOI] [PubMed] [Google Scholar]
- 36.Fan W, Boston BA, Kesterson RA, Hruby VJ, Cone RD. Role of melanocortinergic neurons in feeding and the agouti obesity syndrome. Nature 1997;385:165–168 [DOI] [PubMed] [Google Scholar]
- 37.Heppner KM, Habegger KM, Day J, et al. Glucagon regulation of energy metabolism. Physiol Behav 2010;100:545–548 [DOI] [PubMed] [Google Scholar]
- 38.Neary MT, Batterham RL. Gut hormones: implications for the treatment of obesity. Pharmacol Ther 2009;124:44–56 [DOI] [PubMed] [Google Scholar]
- 39.Margetic S, Gazzola C, Pegg GG, Hill RA. Leptin: a review of its peripheral actions and interactions. Int J Obes Relat Metab Disord 2002;26:1407–1433 [DOI] [PubMed] [Google Scholar]
- 40.Izumiya Y, Hopkins T, Morris C, et al. Fast/glycolytic muscle fiber growth reduces fat mass and improves metabolic parameters in obese mice. Cell Metab 2008;7:159–172 [DOI] [PMC free article] [PubMed] [Google Scholar]
- 41.Ebihara K, Ogawa Y, Masuzaki H, et al. Transgenic overexpression of leptin rescues insulin resistance and diabetes in a mouse model of lipoatrophic diabetes. Diabetes 2001;50:1440–1448 [DOI] [PubMed] [Google Scholar]
- 42.Shimomura I, Hammer RE, Ikemoto S, Brown MS, Goldstein JL. Leptin reverses insulin resistance and diabetes mellitus in mice with congenital lipodystrophy. Nature 1999;401:73–76 [DOI] [PubMed] [Google Scholar]
- 43.Wolfgang MJ, Cha SH, Sidhaye A, et al. Regulation of hypothalamic malonyl-CoA by central glucose and leptin. Proc Natl Acad Sci USA 2007;104:19285–19290 [DOI] [PMC free article] [PubMed] [Google Scholar]
- 44.Schultes B, Peters A, Hallschmid M, et al. Modulation of food intake by glucose in patients with type 2 diabetes. Diabetes Care 2005;28:2884–2889 [DOI] [PubMed] [Google Scholar]
- 45.Henry BA, Clarke IJ. Adipose tissue hormones and the regulation of food intake. J Neuroendocrinol 2008;20:842–849 [DOI] [PubMed] [Google Scholar]
- 46.Suzuki K, Simpson KA, Minnion JS, Shillito JC, Bloom SR. The role of gut hormones and the hypothalamus in appetite regulation. Endocr J 2010;57:359–372 [DOI] [PubMed] [Google Scholar]
- 47.Lam TK. Neuronal regulation of homeostasis by nutrient sensing. Nat Med 2010;16:392–395 [DOI] [PubMed] [Google Scholar]
- 48.Moran TH. Hypothalamic nutrient sensing and energy balance. Forum Nutr 2010;63:94–101 [DOI] [PubMed] [Google Scholar]
- 49.Benoit SC, Kemp CJ, Elias CF, et al. Palmitic acid mediates hypothalamic insulin resistance by altering PKC-theta subcellular localization in rodents. J Clin Invest 2009;119:2577–2589 [DOI] [PMC free article] [PubMed] [Google Scholar]
- 50.Knauf C, Cani PD, Kim DH, et al. Role of central nervous system glucagon-like peptide-1 receptors in enteric glucose sensing. Diabetes 2008;57:2603–2612 [DOI] [PMC free article] [PubMed] [Google Scholar]


