

Abstract
We have shown previously and confirmed in the present study that the phospholipase A2 (PLA2) activity of peroxiredoxin 6 (Prdx6) is markedly increased by phosphorylation. This report evaluated the conformation and thermodynamic stability of Prdx6 protein after phosphorylation to understand the physical basis for increased activity. Phosphorylation resulted in decreased negative far-UV CD, increased ANS binding, and lack of rigid tertiary structure, compatible with a change in conformation to that of a molten globule. The was 3.3 ± 0.3 kcal mol-1 for Prdx6 and 1.7 ± 0.7 kcal mol-1 for pPrdx6 suggesting that phosphorylation destabilizes the protein. Phosphorylation of Prdx6 changed the conformation of the N-terminal domain exposing Trp 33, as determined by tryptophan fluorescence and NaI fluorescence quenching. The kinetics of interaction of proteins with unilamellar liposomes (DPPC/egg PC/cholesterol/PG; 50:25:15:10, mol/mol) was evaluated with tryptophan fluorescence. pPrdx6 bound to liposomes with higher affinity (Kd, 5.6 ± 1.2 μM) in comparison to Prdx6 (Kd, 24.9 ± 4.5 μM). By isothermal titration calorimetry, pPrdx6 bound to liposomes with a large exothermic heat loss (ΔH = -31.49 ± 0.22 kcal mol-1). Correlating our conformation studies with the published crystal structure of oxidized Prdx6 suggests that phosphorylation results in exposure of hydrophobic residues, thereby providing accessibility to the sites for liposome binding. Because binding of the enzyme to the phospholipid substrate interface is a requirement for PLA2 activity, these results indicate that a change in the conformation of Prdx6 upon its phosphorylation is the basis for enhancement of PLA2 enzymatic activity.
Peroxiredoxin 6 (Prdx6) is a unique 1-cys mammalian peroxiredoxin that has both phospholipase A2 (PLA2) and glutathione peroxidase activities (1-3). These activities of the native protein are expressed at different pH optima with PLA2 activity maximal at pH 4 while the peroxidase activity is maximal at pH 7-8 where PLA2 activity is significantly reduced (1). The physiological roles of Prdx6 reflect the pH optima for each activity as the protein is present in both neutral pH (cytosol, peroxidase activity) and acidic pH (lysosomes and lysosomal-like organelles, PLA2 activity) cellular compartments (4, 5). Site-directed mutagenesis studies have demonstrated a catalytic triad (S32-H26-D140) that is responsible for PLA2 activity while S32 and H26 also are components of a lipid binding motif that is required for interactions of Prdx6 with phospholipid substrate to optimize the protein-substrate complex for hydrolysis (6). Binding of Prdx6 to phospholipid substrate occurs at pH 4 but is markedly reduced at pH 7 (6).
Protein phosphorylation is a common form of reversible protein posttranslational modification that can play a major role in enzymatic regulation (7). Phosphorylation of Prdx6 mediated by a mitogen activated protein kinase (MAPK) enhances the PLA2 activity of the protein and broadens its spectrum of activity as a function of pH (8). In a previous study, phosphorylated Prdx6 (pPrdx6), unlike the non-phosphorylated protein, bound to phospholipid substrate at pH 7 as well as pH 4 (9), resulting in a marked increase in PLA2 activity in both acidic and neutral pH assays (8). In the present study, we utilized tryptophan fluorescence and isothermal calorimetry (ITC) to compare the interaction of Prdx6 and pPrdx6 with unilamellar liposomes in order to understand the biophysical basis for the increase in lipid binding affinity with phosphorylation. We also investigated the change in the conformation and thermodynamic stability of Prdx6 after phosphorylation using circular dichroism (CD) and fluorescence measurements.
EXPERIMENTAL PROCEDURES
Material
MAPK (ERK2, extracellular–signal-regulated kinase) was purchased from Upstate (Millipore, Billerica, MA). 1, 2-Bis palmitoyl-sn-glycero-3-phosphocholine (DPPC), egg yolk phosphatidylcholine (PC), phosphatidylglycerol (PG), cholesterol (chol) and 8-anilinonaphthalene-1-sulfonate (ANS) were purchased from Sigma-Aldrich (St. Louis, MO). Urea was from Invitrogen Life Technologies (Carlsbad, CA). The polyclonal antibody to phosphorylated Prdx6 has been described (10). Rat wild type and mutant Prdx6 proteins (W33F, W82F) were cloned into the pETBlue-1 plasmid and expressed in the Tuner strain of E. coli (Novagen, Madison, WI). Proteins were purified using ion-exchange and size-exclusion chromatography (1, 6, 11) resulting in a homogenous product as determined by SDS-PAGE and western blotting (not shown) (1, 11). The W181F mutant protein formed inclusion bodies upon expression in pETBlue and was not further studied.
Liposome Preparation
Unilamellar liposomes consisting of DPPC/egg PC/cholesterol/PG (50:25:15:10, mol/mol) were prepared by extrusion under pressure (9). Tracer [3H-9,10-palmitate] – DPPC was added for PLA2 assays. The lipids dissolved in chloroform were evaporated to dryness under nitrogen onto the wall of a Corex glass tube. The evaporated film was resuspended in 50 mM Tris-HCl, 100 mM NaCl, pH 7.4 (called standard buffer) and was vigorously mixed, then frozen and thawed three times by alternating liquid N2 and a 50°C water bath followed by extrusion at 50°C for 10 cycles through a 0.1μm pore size polycarbonate filter. Recovery of 3H in the liposome preparation was 95-100% of the original dpm. Liposomes were stored overnight at 4°C before use. Analysis by dynamic light scattering (DLS 90 Plus Particle size Analyzer; Brookhaven Instruments, Holtsville, NY) showed a homogenous population of vesicles with a diameter of 100-120 nm.
In vitro phosphorylation of Prdx6
Recombinant Prdx6 (1 μg/μl) was phosphorylated in vitro using MAPK/ERK2 (0.021 μg/μl) in standard buffer in the presence of 2 mM ATP and 10 mM MgCl2 (8). The mixture was incubated for the indicated times with slow shaking in a water bath at 30°C. Samples were analyzed by 10% Bis-Tris gels using MES buffer (Invitrogen) and stained with NOVEX Collodial Blue (Invitrogen). Prdx6 protein bands were excised and subjected to in-gel tryptic digestion (12). Tryptic digests were subjected to liquid chromatography-tandem mass spectrometry (LC-MS/MS) analysis using an LTQ-Orbitrap XL mass spectrometer (Thermo Scientific) interfaced with Nano-ACQUITY UPLC system (Waters) (13). Peptide sequences were interpreted from MS/MS spectra by searching against a human database using BIOWORKS version 3.3.1, SP1 (Thermo Fisher Scientific). Database searches were performed using partial trypsin specificity, a fixed modification of Cys with iodoacetamide, variable oxidation of Met, and variable phosphorylation of Ser, Thr and Tyr. Outputs from BIOWORKS searches are filtered using mass tolerance of 10 ppm, ΔCn>=0.05, and full tryptic boundaries. Peptide quantitation was subsequently determined from the corresponding extracted ion chromatographic peak area. The phosphorylation of Prdx6 was also analyzed by SDS/PAGE followed by Western blotting using anti-pPrdx6 polyclonal antibody (1:2000) and anti-rabbit IRDye™800 (green) secondary antibody (Rockland, Gilbertsville, PA) and imaged with an Odyssey dual-color fluorescent infrared-excited imaging system (LI-COR,Lincoln, NE).
Enzymatic activity
PLA2 activity was measured at pH 7.0 as described previously (14, 15) using 3H-DPPC-labeled liposomes as substrate. Dpm were measured in the non-esterified fatty acid (palmitate) spot obtained by thin layer chromatography.
Fluorescence spectroscopy
Fluorescence spectroscopy was performed with a spectrofluorometer (PTI, Photon Technology International, Lawrenceville, NJ) equipped with a water bath temperature-controlled sample holder, a single photon counting system for fluorescence intensity detection, and dual fluorescence and absorbance channels. Measurements were performed with 1μM protein in standard buffer at 22°C in microquartz fluorescence cuvettes with pathlength of 0.3 cm (Hellma) using 1 nm excitation and emission slits. For tryptophan fluorescence measurements, the emission spectra were recorded from 310-450 nm after excitation at 295 nm to avoid tyrosine fluorescence. ANS (250μM) fluorescence spectra were collected from 400 to 600 nm with excitation at 360 nm. For tryptophan fluorescence quenching, the concentration of NaI was varied from 0-0.4 M using a 5 M stock solution of NaI dissolved in Tris-HCl buffer, pH 7.4. Fluorescence intensity was monitored at the emission maximum. Assay solutions contained 1 mM sodium thiosulfate to suppress free iodide formation (16). After correction for dilution, the data were analyzed according to the Stern-Volmer equation (17, 18) : Fo/F = 1 + kQ [X], where, Fo and F are the fluorescence emission intensities in the absence and presence of NaI, [X] is the molar concentration of NaI, and kQ the Stern-Volmer quenching constant. Stern-Volmer quenching constants were obtained from the initial slope of the plots if they showed non-linearity at higher concentration.
Time-resolved intensity was measured using the PTI EasyLife Lifetime Fluorometer with an emission cut-off filter at 320 nm. The excitation source in this fluorometer is a LED that is rapidly pulsed at 295 nm. Glycogen in water was used to record the instrumental response function (IRF). Intensity decay was analyzed using the multiexponential decay law given by : It = Io ΣαI exp(-t/τi) where It is time-dependent intensity, Io is the intensity at time 0, αI is the normalized pre-exponential factor and τi is decay time, respectively (19). The fractional fluorescence intensity of each component is defined as fi = αiτi/Σαiτi. The software used for data analysis was obtained from ISS. The best-fit parameters were obtained by reducing χ2 and residuals of the fit close to 1 and zero, respectively.
Circular dichroism (CD)
CD was measured with protein (10 μM) in standard buffer in a fused quartz cell with a path length of 0.1 cm using AVIV 202 and 62 DS CD spectrometers (AVIV, Lakewood, NJ) equipped with a thermoelectric cell holder. Temperature was maintained at 25°C using a Pelletier element. The sample mixture of protein with or without liposomes was incubated for 1 h and then spectra were recorded with three repeats in the far-ultraviolet region (190–260 nm) with a bandwidth of 1.0 nm, a step size of 1 nm, and an integration time of 30 s. The buffer baseline or a blank sample containing an identical concentration of liposomes was subtracted. CD measurements are expressed as mean residue ellipticity ([θ]λ) in deg cm2 dmol-1 at a given wavelength λ (nm) using the relation: [θ]λ = θλMo / 10cl, where θλ is the observed ellipticity in millidegrees at wavelength λ, Mo is the mean residual weight of the protein, c is the protein concentration (mg/cm3), and l is the path length (cm). The change in far-UV CD is quantitated by measuring the α-helix content using the formula: α-helix (%) = [(-[θ]222 + 3000) / 39000] × 100, where [θ]222 is the mean residue ellipticity at 222 nm (20).
Thermal denaturation was recorded at 220 nm with scanning from 20°C to 90°C at a rate of 1°C/min using a fused quartz cell (1 cm pathlength) and 1 μM protein. The mean residue ellipticity measured as a function of temperature is expressed as fractional denaturation after normalizing to [θ]220 at the start of the temperature scan. By assuming a linear dependence of pre-and post-transition baselines on temperature, each thermal denaturation curve was fitted to a two-state unfolding model (21, 22):
| (1) |
where y (T) is the observed mean residue ellipticity at a given temperature, mN and mD are slopes and yN and yD are the intercept of the native and denatured baselines, respectively, T is the temperature and Tm is the melting temperature in degrees Kelvin, ΔHm is the enthalpy change of denaturation at melting temperature, and R is the universal gas constant.
Urea denaturation
Urea-induced denaturation of proteins (1 μM in standard buffer) was measured at 324 nm with excitation at 295 nm after equilibration at room temperature for 4 h with different concentrations of urea; longer (overnight) incubation of the reaction mixture gave similar results. For refolding experiments, denaturant solution was added to protein before dilution with buffer. The data from the urea denaturation curves were analyzed for ΔG°D and mun assuming two-state reversible unfolding. The transition curve was determined using the relation (21):
| (2) |
where y(u) is the observed optical property at the molar concentration of urea [u], mN and mD are slopes and yN and yD are the respective intercepts of the native and denatured baselines, is the value of Gibbs free energy change (ΔGD) in the absence of the denaturant, mUN is the slope (∂ΔGD / ∂[u]), R is the universal gas constant, and T is the temperature in degrees Kelvin.
Isothermal Titration Calorimetry (ITC)
The VP-ITC (Microcal, Northampton, MA) was used to measure the heat of protein binding to liposomes at 20°C. The protein solution was dialyzed against PBS, pH 7.4 and both the liposome and protein solutions were degassed completely under vacuum before use. Liposomes at 5 mM lipid in the sample cell (1.3 ml) were injected 25 to 29 times with 10 μ1 protein solution (28μM) with continuous stirring at 350 rpm to measure the enthalpy of binding. The molar ratio of liposomes to protein was kept over 100 so that the injected protein bound completely to the liposomes. Binding enthalpies were corrected by subtracting the heat of dilution as determined by injecting protein solutions into buffer only.
Structural analysis
The published crystal structure of human Prdx6 (23) was accessed using 3D structure analysis tools and ribbon and surface diagrams were drawn using PyMOL. Contacts between Thr177 and nearby residues in Prdx6 and the accessible surface area of Trp residues and T177 were determined using the contact and AREAIMOL programs, respectively, from the CCP4 package (24).
Statistical analysis
Results are presented as mean ± SD. Curve fitting of data points for liposome binding and urea thermal denaturation was done with Sigma Plot 11 software in dynamic fit.
RESULTS
Phosphorylation and enzymatic activity of Prdx6
Phosphorylation of recombinant Prdx6 in the presence of MAPK/ERK2 was detected within 5 min of the start of incubation and reached 90% at 540 minutes as measured by mass spectroscopy (Fig. 1). Our previous studies have indicated that Prdx6 is phosphorylated at Thr 177 (8). PLA2 activity of Prdx6 measured at pH 7.0 was similar to our previous results for rat recombinant protein (25). The phosphorylation of Prdx6 resulted in a 30-fold increase in PLA2 activity (Table 1).
Figure 1.

Time course of phosphorylation of recombinant Prdx6. Incubation was at 30°C for the indicated time with ERK2. (A) Representative western blot using anti-pPrdx6 Ab (1:2000) and (B) quantitation by densitometry of immunoblots of phosphorylated Prdx6 (pPrdx6). (C) Quantitation by mass spectroscopy of pPrdx6 as a % of total Prdx6.
Table 1.
PLA2 activity of Prdx6 and phosphorylated Prdx6 (pPrdx6)
| PLA2 activity (nmols/min/mg protein) | |
|---|---|
| Prdx6 | 50.5 ± 3.8 |
| pPrdx6 | 1580 ± 89 |
Activity was measured at pH 7.0 in 50 mM Tris-HC1, 5 mM EDTA and 1 mM GSH. Values are means ± S.D. (n = 3)
Effect of phosphorylation on the CD spectrum
To determine the basis for increased PLA2 activity, we evaluated the effect of phosphorylation on Prdx6 secondary structure as determined by the far-UV region of the CD spectrum (Fig. 2A) (26, 27). The calculated α-helix content of Prdx6 (Table 2) agrees well with that determined from the crystal structure of Prdx6 (23). Phosphorylation of Prdx6 led to a significant decrease in its α-helical content (Table 2).
Figure 2.

Far-UV CD (A) and near-UV CD (B) measurements of Prdx6 and pPrdx6. Measurements were done at 22 °C in standard buffer (50 mM Tris-HCl, 100 mM NaCl, pH 7.4). Spectra are mean of two independent experiments.
Table 2.
Conformational and Thermodynamic Parameters of Prdx6 and pPrdx6
| α-helix (%) | ΔG0D, kcal mol-1 | MUN, kcal mol-1 [u]-1 | |
|---|---|---|---|
| Prdx6 | 28.9 ± 1.2 | 3.3±0.3 | 1.1±0.4 |
| pPrdx6 | 21.7 ± 2.5 | 1.7 ±0.2 | 0.6 ±0.2 |
Mean ±S. D. from three independent experiments.
The near-UV CD (260-320 nm) spectrum was used to evaluate the tertiary structure of Prdx6 (27). The spectral intensity at 290 nm was decreased from 12.2 deg cm2 dmol-1 for Prdx6 to -13.1 for the phosphorylated protein (Fig. 2B), indicating a less ordered tertiary structure. The peak at 290 nm (Fig. 2B) can be ascribed to Trp transitions (28). Thus, these results suggest that the tryptophan residues in Prx6 are incorporated into the rigid tertiary structure and are responsible for the CD signals.
Tryptophan fluorescence spectroscopy
Tryptophan fluorescence emission also was used to evaluate the conformational state of the protein (29). A change in tryptophan fluorescence is presumed to reflect a change in the local environment of Trp residues in the protein (19). Phosphorylation of Prdx6 resulted in a decreased fluorescence intensity compared to Prdx6 and a red-shift in peak fluorescence from 326 to 334 nm (Fig. 3A), compatible with exposure of tryptophan residues towards a more polar environment.
Figure 3.

Trytophan fluorescence (A), the difference in fluorescence after treatment with ANS (B), and NaI quenching (C) of Prdx6 and pPrdx6. Measurements were done at 22 °C in standard buffer. Spectra are mean of two independent experiments. The inset in panel B shows the fluoresence of Prdx6 and pPrdx6 in the presence of ANS and the fluorescence spectrum of ANS alone (….).
The fluorescent hydrophobic probe ANS can detect accessible hydrophobic surfaces on proteins (30, 31). In aqueous solvent, the fluorescence quantum yield of the probe is weak but yield increases several fold upon binding to hydrophobic surfaces (Fig. 3B) (32). ANS fluorescence showed an increase in emission at its fluorescence maximum (~507 nm) and a blue shift (~496 nm) on binding to pPrdx6 (Fig. 3B, inset). These results indicate that the phosphorylation of Prdx6 leads to unfolding of Prdx6 and exposure of its hydrophobic surfaces. NaI quenching experiments were done to investigate the microenvironment of tryptophan residues in the proteins. Stern-Volmer plots for Prdx6 were linear while the plots for pPrdx6 showed upward curvature (Fig. 3C). Thus, the Trp residues in Prdx6 show no selective quenching but showed static quenching in pPrdx6 (18). KSV values for iodide quenching of Prdx6 and pPrdx6 are 1.40 ± 0.02 and 2.55 ± 0.01 M-1, respectively.
Urea-induced denaturation of Prdx6 was monitored to determine its conformational stability. The unfolding curves of the proteins were reversible over the entire concentration range (0-7 M) of the denaturant (Fig. 4). The phosphorylation of Prdx6 resulted in a decrease in both the conformational stability ( ) and mUN of Prdx6 (Table 2) with decreased cooperativity as indicated by the denaturation transition curves. The parameter mUN is proportional to the amount of newly accessible surface area exposed upon denaturation (33, 34). The decrease in the cooperativity and mUN of Prdx6 indicates that phosphorylation of Prdx6 exposes hydrophobic amino acid residues with consequent loss of non-covalent interactions (34).
Figure 4.

Urea-induced equilibrium denaturation of Prdx6 (A) and pPrdx6 (B) as a function of urea concentration measured by tryptophan fluorescence at 22 °C. Data points were obtained at 324 nm after excitation at 295 nm for protein incubated in standard buffer at room temperature for 4 hrs. Data points are the mean ± SD of three independent experiments. The solid lines represent the best fits using dynamic curve fitting by linear extrapolation method in Sigma Plot software version 11.0.
Prdx6 binding to liposomes
Tryptophan fluorescence also was used to monitor the interaction of Prdx6 with liposomes. The change in fluorescence intensity of Prdx6 upon addition of increasing concentration of liposomes was minimal (Fig. 5A) and saturated at 30 μM lipid concentration (Fig. 5B). These results indicate weak binding of Prdx6 to liposomes, consistent with previous results (9). However, incubation of pPrdx6 with liposomes resulted in a significant increase in the relative fluorescence (Fig. 5C) and saturation was reached at 50-100 μM lipid concentration (Fig. 5D). The experimental data fit a standard sigmoidal curve (assuming simple ligand binding of a single binding site) with R2 > 0.97. The calculated apparent dissociation constants (Kd) indicate that the phosphorylation of Prdx6 results in significantly a higher binding affinity for liposomal vesicles (Table 3).
Figure 5.
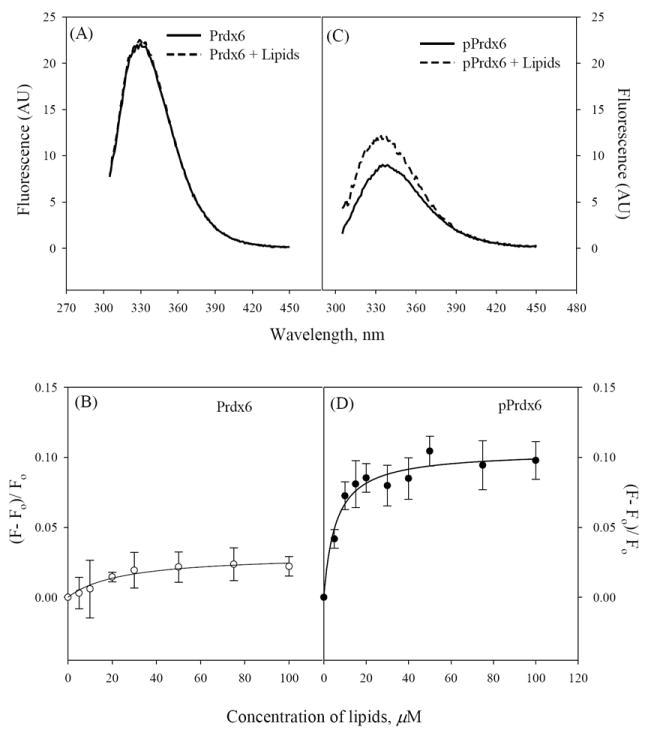
Fluorescence (A,C) before and after addition of 100 μM unilamellar liposomes and lipid binding kinetics (B,D) of Prdx6 and pPrdx6. Protein concentration was 1μM. Data points were collected at 333 nm after excitation at 295 nm with incubation for 30 mins at room temperature in standard buffer. Spectra and plots are mean of three independent experiments. The error bars in panels (C) and (D) are ± SD and solid lines represent the standard sigmoid fit in a one binding site model using Sigma software version 11.0.
Table 3.
Kinetic and thermodynamic parameters for lipid binding by Prdx6 and pPrdx6
| Kd,μM | ΔH, kcal mol-1 | |
|---|---|---|
| Prdx6 | 24.9±4.5 | -15.41±0.19 |
| pPrdx6 | 5.6±1.2 | -31.49±0.22 |
Mean ± S. D. from three or more independent measurements.
Fluorescence lifetime was analyzed as a multi-exponential decay using the second exponential fit τ1 and τ2 (see Supplemental Fig. 1 in supporting data). In some cases, the triple exponential fit was recorded; however, the pre-exponential factor α3 for these fits was close to zero, and therefore this component of the decay is not included in the calculated average values of fluorescence lifetime <τ>. There was no change in protein lifetime decay on incubation of Prdx6 with liposomes but phosphorylation of the protein resulted in a significantly increased rate of decay (Table 4) This decreased lifetime indicates a relatively more polar environment for the Trp residues following phosphorylation (19). This interpretation is supported by the subsequent increase in fluorescence lifetime upon exposure to lipids (Table 4). The chi squared values for the fluorescence lifetime measurements are around 1, confirming their validity.
Table 4.
Effect of lipids on time-resolved fluorescence of Prdx6 and pPrdx6
| τ1(nsec) | f1 | τ2(nsec) | f2 | <τ>(nsec) | χ2 | |
|---|---|---|---|---|---|---|
| Prdx6 | 5.18±0.04 | 0.67 | 2.91±0.01 | 0.32 | 4.89±0.02 | 1.02 |
| Prdx6 + lipid | 5.17±0.01 | 0.81 | 2.87±0.21 | 0.18 | 4.75±0.03 | 1.29 |
| pPrdx6 | 4.38±0.01 | 0.71 | 0.88±0.01 | 0.28 | 4.10±0.01 | 0.94 |
| pPrdx6 + lipid | 6.31±0.02 | 0.61 | 2.71±1.01 | 0.38 | 4.90±0.02 | 1.33 |
The interaction of Prdx6 with unilamellar liposomal vesicles also was evaluated by ITC. Interactions of protein with liposomes was an exothermic process (Fig. 6). Due to the high lipid to protein molar ratio that was used in the studies, all of the injected protein molecules appeared to bind to liposomes resulting in an identical heat release for each consecutive injection (35, 36). After phosphorylation, the interaction of Prdx6 with liposomes was more exothermic as compared with the native protein (Fig. 6,Table 3), indicating an increase in affinity (36).
Figure 6.

Isothermal titration calorimetry for Prdx6 (A) and pPrdx6 (B) injected into a solution containing unilamellar liposomes. Each peak corresponds to the injection of 10 μl of protein solution (28 μM) into 5 mM lipid at 20°C. Solutions were prepared in phosphate buffered saline, pH 7.4.
Far-UV CD measurements of Prdx6 following addition of liposomes showed no significant change in the secondary structure (not shown), or in melting temperature (Tm) and enthalpy (ΔHm) at melting temperature (Fig. 7, Table 5). On the other hand, addition of liposomes to pPrdx6 resulted in altered secondary structure (α helical %, 21.7 ± 2.5 for Prdx6 and 18.8 ± 1.5 for pPrdx6) with decreased melting temperature and increased ΔHm (Fig. 7, Table 5). Thus, the binding of pPrdx6 to liposomes changes its conformation with the formation of non-covalent interactions.
Figure 7.

Binding of Prdx6 (A) and pPrdx6 (B) to lipids monitored by far-UV CD at 22°C in standard buffer. Thermal melting of Prdx6 (C) and pPrdx6 (D) with and without the presence of liposomes. Melting curves were recorded at 220 nm as a function of temperature in the range 20-90 °C, at a scan rate 1°C/min. Experiments used 1 mM lipid and 10 μM protein. The solid lines in panels (C) and (D) represent the best dynamic curve fit of data using van’t Hoff equation in Sigma software version 11.0.
Table 5.
Thermodynamic parameters of Prdx6 and pPrdx6 interaction with lipids determined by far –UV CD
| ΔHm, kcal mol-1 | Tm, (°C) | |
|---|---|---|
| Prdx6 | 345±4 | 68.81±0.06 |
| Prdx6 + lipid | 355±1 | 68.42±0.09 |
| pPrdx6 | 304±4 | 65.15±0.05 |
| pPrdx + lipid | 330±8 | 61.29±0.08 |
Mean ± S. D. from three independent experiments.
Role of Trp residues
Prdx6 has Trp residues at positions 33, 82, and 181. Steady-state tryptophan fluorescence and quenching of W82F and W33F mutant Prdx6 were used to evaluate accessibility of tryptophan residues to solvent (19). The far-UV CD spectrum of W33F and W82F indicated a slight decrease in comparison to wild type Prdx6 (Fig 8A). Trp fluorescence of the mutant proteins showed a marked decrease across the entire spectrum (Fig. 8B); the greater decrease with the Trp33 mutant implies that this residue makes a greater contribution than Trp82 to Prdx6 total fluorescence, in agreement with previous results (6). Trp33 plus Trp 82 together accounted for approximately 75% of the total fluorescence consistent with a relatively minor role for Trp 181. The mutant proteins showed the same λmax at ~ 327 nm as wild type Prdx6 indicating that the corresponding Trp residues in these different proteins are similarly exposed to the environment. Because W33F mutant protein showed a linear Stern-Volmer plot on addition of NaI, quenching of Trp residues was not selective. However, the upward curvature of the Stern-Volmer plot for W82F mutant protein at higher concentration of quencher indicates static quenching (18). KSV values for iodide quenching of W33F and W82F mutant proteins are 1.85 ± 0.01 and 2.47 ± 0.02 M-1, respectively, compared to 1.14 ± 0.02 for wild type Prdx6.
Figure 8.

Study of Prdx6 Trp mutant proteins W33F and W82F using far-UV CD (A), Trp steady-state fluorescence (B) and NaI fluorescence quenching (C) at 22 °C in standard buffer. Excitation was at 295 nm for Trp fluorescence measurements. Data points with NaI (C) are the mean of three independent experiments.
Structural analysis
Thr177 is the site of phosphorylation of Prdx6 (8). Examination of the crystal structure of Prdx6 (23) suggests possible inter- and intra-molecular van der Waals interactions within the A monomer and for Thr177 at the interface of Prdx6 dimer (Fig. 9A) Ser166 and Trp 181 within the monomer possibly interact the Thr177 through Van Der Waals forces (table 6). Amino acid residues within the B monomer which can form van der Waals interactions with Thr177 (Table 6) may play an important role in the formation of the Prdx6 dimer [T152, G154, and V46 in the B monomer all are within 3.5 Å of T177 (in the A monomer) and thus may be important for dimerization.
Figure 9.
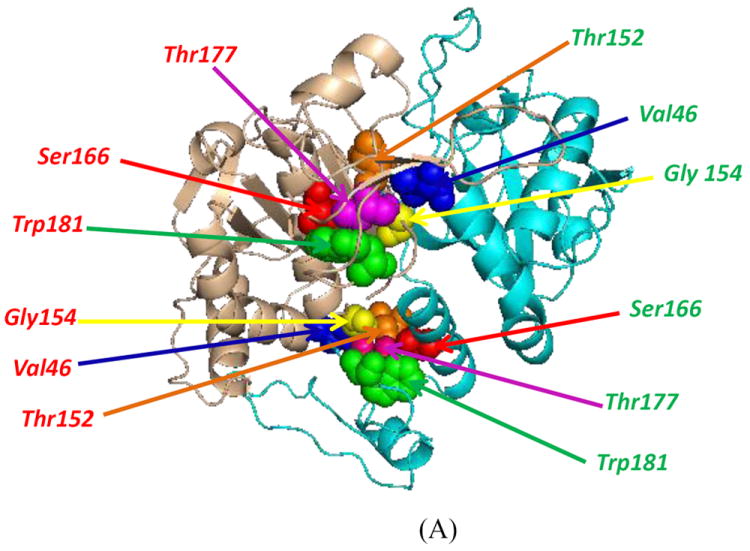

Crystal structure of the Prdx6 dimer (PDB 1PRX) shown in a model developed with PyMol. (A) Thr177 is the site of phosphorylation mediated by MAPKinase (10). The amino acid residues in the dimer that may form inter-and intra-molecular van der Waals interactions with Thr177 are indicated. Positions of the 3 Trp residues (W33, W82 and W181) and Thr177 are shown in ribbon (B) and surface (C) diagrams (22).
Table 6.
Van der Waals interactions between side chains of Thr177 and adjacent amino acid residues
| Target Atoms | Distance (Å) | |
|---|---|---|
| 177 (A) THR (N) | 152 (B) THR (O) | 2.8 |
| 177 (A) THR (O) | 154 (B) GLY (CA) | 3.3 |
| 177 (A) THR (O) | 154 (B) GLY (N) | 2.8 |
| 177 (A) THR (O) | 46 (B) VAL (CG2) | 3.3 |
| 177 (A) THR (OG1) | 166 (A) SER (CB) | 3.4 |
| 177 (A) THR (CG2) | 181 (A) TRP (CD2) | 3.5 |
Distance was calculated using the contact program of the CCP4 package (CCP4, 1994)
We also used the published crystal structure (23) to estimate the surface exposure of the Trp residues and T177. Assuming that the crystal structure represents the intracellular conformation of the protein, the surface diagrams of the Prdx6 dimer indicate that W33 and W181 are only partially exposed to the solvent while T177 and W82 are totally buried in the globular Prdx6 protein (Fig. 9B,C). This was confirmed by determining the accessible surface area using the contact program from the CCP4 package (Table 7) (24). Thus, T177 in the wild type native protein is not accessible at the cell surface and a conformational change is required before this site can be phosphorylated.
Table 7.
Accessible surface area of Trp residues and Thrl77 of Prdx6
| Accessible surface area (Å) | |
|---|---|
| W33 | 10 |
| W82 | 0 |
| W181 | 3 |
| T177 | 0 |
Å was calculated using AREAIMOL programme of the CCP4 package (CCP4, 1994)
DISCUSSION
Protein phosphorylation is a common and important form of reversible protein posttranslational modification, and in many cells up to 30% of all proteins are phosphorylated at any given time (37). Phosphorylation of a protein can either activate or inhibit its enzymatic activity (7). Phosphorylation of Prdx6 at T177 by treatment with a MAP kinase in vitro increased the PLA2 activity of the protein by ~30 – fold without a change in peroxidase activity (8). Because T177 is completely buried in the conformation given by the crystal structure and it is not located near the catalytic triad of PLA2, H26-S32-D140 (23), it is unlikely that phosphorylation of Prdx6 has a direct effect on the PLA2 active site. The present results contribute towards the understanding of the mechanism for enhancement of the PLA2 activity of Prdx6 after phosphorylation through the study of the change in the conformation of Prdx6 after phosphorylation, the characterization of the conformational state of pPrdx6, the interaction of pPrdx6 with phospholipids, and localization of the change in the conformation through the use of Trp mutants.
Several modifications of protein structures were noted after phosphorylation of Prdx6. Based on the decrease in both far and near-UV CD measurement, phosphorylation changed both secondary and tertiary structure (Fig. 2A, B). Quenching of tryptophan fluorescence with a red-shift in its emission maximum (Fig. 3A) and decrease in fluorescence lifetime (τ) (Table 4) after phosphorylation indicate the exposure of Trp residues to a more polar environment (19). Phosphorylation also resulted in an increase in ANS fluorescence intensity and a blue-shift in emission maximum (Fig. 3B) compatible with exposure of hydrophobic residues that were buried in the native protein. The greater decrease in mUN of pPrdx6 in comparison to that of Prdx6 with urea-induced denaturation (Table 2) also reflects exposure of hydrophobic amino acid residues that is proportional to the amount of newly accessible surface area (33, 34). Finally, the evidence for less cooperativity in the denaturation curve (Fig. 4) and the decrease in the melting temperature (Table 5) after phosphorylation reflect decreased stability, which we interpret as a loss of non-covalent interactions of the protein (35). Based on these experimental observations, phosphorylated pPrdx6 shows characteristics of the molten globular state, characterized by substantial secondary structure without a rigid tertiary structure, decreased cooperativity, and exposure of hydrophobic residues (31, 38-41).
Prdx6 normally exists as a dimer that is stabilized by hydrophobic and hydrogen bonding, resulting in a 17.4 % decrease of the total exposed surface of two monomers (23). Binding by the phosphate groups carrying two negative charges might be the mechanism for the change in conformation following phosphorylation (7, 42). The basal PLA2 activity of T177E mutant protein was 2.4 times greater compared to the T177A mutant, presumably related to the negative charge of glutamic acid, mimicking the phosphate group (8). Further, T177 is located in domain 2 of Prdx6 and can interact through intra- and inter-molecular Van der Waals forces with adjacent amino acid residues (Fig.9, Table 6). Interactions of adjacent amino acids with phosphorylated T177 may lead to disturbance at the interface of the dimer and exposure of buried hydrophobic residues (23). These changes associated with phosphorylation would be expected to alter the secondary and tertiary structure of Prdx6 as confirmed by the CD and fluorescence measurements.
The changes in conformation with phosphorylation of Prdx6 result in increased binding to lipids, as indicated by the binding isotherm measured by tryptophan fluorescence (Fig. 5), a greater exothermic heat release by ITC (Table 3), and increased lifetime fluorescence decay on interaction with liposomes (Table 4). The decrease in far-UV CD and melting temperature of pPrdx6 with the increased change in enthalpy may reflect the insertion of a fatty acyl group into the hydrophobic pocket of Prdx6 as proposed earlier (3). These changes are associated with an increase in PLA2 activity where substrate binding is necessary for catalysis (6).
It has been generally assumed that a protein is active when in its native three-dimensional structure. However, there is increasing evidence that some proteins function best in the less ordered intermediate state (43-47). This study demonstrates that phosphorylation induces Prdx6 to assume a molten globule state that shows optimal enzymatic (PLA2) activity. This state has been widely recognized as a thermodynamic and kinetic intermediate in protein folding (40, 41, 48) and this is the configuration associated with activity for many proteins (45, 49, 50). The structural flexibility associated with this non-native intermediate state has an advantage over the greater rigidity of the fully folded native state in that it enables a greater range of conformations for binding to substrates as required for catalysis. The current address for Hamidur Rahaman is: Dept. of Biotechnology, Manipur University, Canchepur, Imphal, Manipur, India 795003.
Supplementary Material
Acknowledgments
We thank Dr. Mahendra Jain for advice and insightful observations, Drs. Leland Mayne and Walter Englander for assistance with CD measurements, Drs. David Kast and Roberto Dominguez for assistance with ITC measurements, and Tea Shuvaeva, Ling Gao and Daniel Gonder for technical assistance.
Funding source: Financial support was provided by HL19737 and HL102016 from the National Heart, Lung and Blood Institute.
ABBREVIATIONS
- Prdx6
peroxiredoxin 6
- pPrdx
phosphorylated Prdx6
- PLA2
phospholipase A2
- MAPK
mitogen activated protein kinase
- ANS
8-anilinonaphthalene-1-sulfonate
- DPPC
1, 2,-bis palmitoyl-sn-glycero-3-phosphocholine
- ITC
isothermal titration calorimetry
- CD
circular dichroism
Footnotes
SUPPORTING INFORMATION
Fluorescence lifetime was analyzed as a multi-exponential decay using the second exponential fit as described in Supplemental Fig. S1. This material is available free of charge via the internet at http://pubs.acs.org.
Presented in part at the Experimental Biology Annual Meetings in 2011 (Washington, DC) and 2012 (San Diego, CA).
References
- 1.Chen JW, Dodia C, Feinstein SI, Jain MK, Fisher AB. 1-Cys peroxiredoxin, a bifunctional enzyme with glutathione peroxidase and phospholipase A2 activities. J Biol Chem. 2000;275:28421–28427. doi: 10.1074/jbc.M005073200. [DOI] [PubMed] [Google Scholar]
- 2.Manevich Y, Fisher AB. Peroxiredoxin 6, a 1-Cys peroxiredoxin, functions in antioxidant defense and lung phospholipid metabolism. Free Radic Biol Med. 2005;38:1422–1432. doi: 10.1016/j.freeradbiomed.2005.02.011. [DOI] [PubMed] [Google Scholar]
- 3.Fisher AB. Peroxiredoxin 6: A bifunctional enzyme with glutathione peroxidase and phospholipase A2 activities. Antioxid Redox Signal. doi: 10.1089/ars.2010.3412. in press. [DOI] [PMC free article] [PubMed] [Google Scholar]
- 4.Akiba S, Dodia C, Chen X, Fisher AB. Characterization of acidic Ca(2+)- independent phospholipase A2 of bovine lung. Comp Biochem Physiol B Biochem Mol Biol. 1998;120:393–404. doi: 10.1016/s0305-0491(98)10046-9. [DOI] [PubMed] [Google Scholar]
- 5.Fisher AB, Dodia C. Role of phospholipase A2 enzymes in degradation of dipalmitoylphosphatidylcholine by granular pneumocytes. J Lipid Res. 1996;37:1057–1064. [PubMed] [Google Scholar]
- 6.Manevich Y, Reddy KS, Shuvaeva T, Feinstein SI, Fisher AB. Structure and phospholipase function of peroxiredoxin 6: Identification of the catalytic triad and its role in phospholipid substrate binding. J Lipid Res. 2007;48:2306–2318. doi: 10.1194/jlr.M700299-JLR200. [DOI] [PubMed] [Google Scholar]
- 7.Johnson LN, Barford D. The effects of phosphorylation on the structure and function of proteins. Annu Rev Biophys Biomol Struct. 1993;22:199–232. doi: 10.1146/annurev.bb.22.060193.001215. [DOI] [PubMed] [Google Scholar]
- 8.Wu Y, Feinstein SI, Manevich Y, Chowdhury I, Pak JH, Kazi A, Dodia C, Speicher DW, Fisher AB. Mitogen activated protein kinase-mediated phosphorylation of peroxiredoxin 6 regulates its phospholipid A2 activity. Biochemical Journal. 2009;419:669–679. doi: 10.1042/BJ20082061. [DOI] [PMC free article] [PubMed] [Google Scholar]
- 9.Manevich Y, Shuvaeva T, Dodia C, Kazi A, Feinstein SI, Fisher AB. Binding of peroxiredoxin 6 to substrate determines differential phospholipid hydroperoxide peroxidase and phospholipase A(2) activities. Archives of Biochemistry and Biophysics. 2009;485:139–149. doi: 10.1016/j.abb.2009.02.008. [DOI] [PMC free article] [PubMed] [Google Scholar]
- 10.Chatterjee S, Feinstein SI, Dodia C, Sorokina E, Lien YC, Nguyen S, Debolt K, Speicher D, Fisher AB. Peroxiredoxin 6 phosphorylation and subsequent phospholipase A2 activity are required for agonist-mediated activation of NADPH oxidase in mouse pulmonary microvascular endothelium and alveolar macrophages. J Biol Chem. 2011;286:11696–11701. doi: 10.1074/jbc.M110.206623. [DOI] [PMC free article] [PubMed] [Google Scholar]
- 11.Manevich Y, Feinstein SI, Fisher AB. Activation of the antioxidant enzyme 1-CYS peroxiredoxin requires glutathionylation mediated by heterodimerization with pi GST. Proc Natl Acad Sci U S A. 2004;101:3780–3785. doi: 10.1073/pnas.0400181101. [DOI] [PMC free article] [PubMed] [Google Scholar]
- 12.Speicher KD, Kolbas O, Harper S, Speicher DW. Systematic analysis of peptide recoveries from in-gel digestions for protein identifications in proteome studies. J Biomol Tech. 2000;11:74–86. [PMC free article] [PubMed] [Google Scholar]
- 13.Fong KP, Barry C, Tran AN, Traxler EA, Wannemacher KM, Tang HY, Speicher KD, Blair IA, Speicher DW, Grosser T, Brass LF. Deciphering the human platelet sheddome. Blood. 2011;117:e15–26. doi: 10.1182/blood-2010-05-283838. [DOI] [PMC free article] [PubMed] [Google Scholar]
- 14.Fisher AB, Dodia C, Feinstein SI, Ho YS. Altered lung phospholipid metabolism in mice with targeted deletion of lysosomal-type phospholipase A2. J Lipid Res. 2005;46:1248–1256. doi: 10.1194/jlr.M400499-JLR200. [DOI] [PubMed] [Google Scholar]
- 15.Wu YZ, Manevich Y, Baldwin JL, Dodia C, Yu K, Feinstein SI, Fisher AB. Interaction of surfactant protein A with peroxiredoxin 6 regulates phospholipase A2 activity. Journal of Biological Chemistry. 2006;281:7515–7525. doi: 10.1074/jbc.M504525200. [DOI] [PubMed] [Google Scholar]
- 16.Homer RB, Allsopp SR. An investigation of the electronic and steric environments of tyrosyl residues in ribonuclease A and Erwinia carotovora L-asparaginase through fluorescence quenching by caesium, iodide and phosphate ions. Biochim Biophys Acta. 1976;434:297–310. doi: 10.1016/0005-2795(76)90222-1. [DOI] [PubMed] [Google Scholar]
- 17.Lehrer SS. Solute perturbation of protein fluorescence. The quenching of the tryptophyl fluorescence of model compounds and of lysozyme by iodide ion. Biochemistry. 1971;10:3254–3263. doi: 10.1021/bi00793a015. [DOI] [PubMed] [Google Scholar]
- 18.Phillips SR, Wilson LJ, Borkman RF. Acrylamide and iodide fluorescence quenching as a structural probe of tryptophan microenvironment in bovine lens crystallins. Curr Eye Res. 1986;5:611–619. doi: 10.3109/02713688609015126. [DOI] [PubMed] [Google Scholar]
- 19.Lakowicz JR. Principles of fluorescence spectroscopy. Academic/Plenum; New York: 1999. [Google Scholar]
- 20.Fisher AB. Peroxiredoxin 6: A Bifunctional Enzyme with Glutathione Perozidase and Phospholipase A(2) Activities. Antioxidant Redox Signaling. 2011;15:831–844. doi: 10.1089/ars.2010.3412. [DOI] [PMC free article] [PubMed] [Google Scholar]
- 21.Santoro MM, Bolen DW. Unfolding free energy changes determined by the linear extrapolation method. 1. Unfolding of phenylmethanesulfonyl alpha-chymotrypsin using different denaturants. Biochemistry. 1988;27:8063–8068. doi: 10.1021/bi00421a014. [DOI] [PubMed] [Google Scholar]
- 22.Alam Khan MK, Das U, Rahaman MH, Hassan MI, Srinivasan A, Singh TP, Ahmad F. A single mutation induces molten globule formation and a drastic destabilization of wild-type cytochrome c at pH 6.0. J Biol Inorg Chem. 2009;14:751–760. doi: 10.1007/s00775-009-0488-6. [DOI] [PubMed] [Google Scholar]
- 23.Choi HJ, Kang SW, Yang CH, Rhee SG, Ryu SE. Crystal structure of a novel human peroxidase enzyme at 2.0 A resolution. Nat Struct Biol. 1998;5:400–406. doi: 10.1038/nsb0598-400. [DOI] [PubMed] [Google Scholar]
- 24.Emsley P, Cowtan K. Coot: model-building tools for molecular graphics. Acta Crystallogr D Biol Crystallogr. 2004;60:2126–2132. doi: 10.1107/S0907444904019158. [DOI] [PubMed] [Google Scholar]
- 25.Fisher AB, Dodia C, Manevich Y, Chen JW, Feinstein SI. Phospholipid hydroperoxides are substrates for non-selenium glutathione peroxidase. J Biol Chem. 1999;274:21326–21334. doi: 10.1074/jbc.274.30.21326. [DOI] [PubMed] [Google Scholar]
- 26.Yang JT, Wu CS, Martinez HM. Calculation of protein conformation from circular dichroism. Methods Enzymol. 1986;130:208–269. doi: 10.1016/0076-6879(86)30013-2. [DOI] [PubMed] [Google Scholar]
- 27.Kelly SM, Jess TJ, Price NC. How to study proteins by circular dichroism. Biochim Biophys Acta. 2005;1751:119–139. doi: 10.1016/j.bbapap.2005.06.005. [DOI] [PubMed] [Google Scholar]
- 28.Strickland EH. Aromatic contributions to circular dichroism spectra of proteins. CRC Crit Rev Biochem. 1974;2:113–175. doi: 10.3109/10409237409105445. [DOI] [PubMed] [Google Scholar]
- 29.Vivian JT, Callis PR. Mechanisms of tryptophan fluorescence shifts in proteins. Biophys J. 2001;80:2093–2109. doi: 10.1016/S0006-3495(01)76183-8. [DOI] [PMC free article] [PubMed] [Google Scholar]
- 30.Stryer L. The interaction of a naphthalene dye with apomyoglobin and apohemoglobin. A fluorescent probe of non-polar binding sites. J Mol Biol. 1965;13:482–495. doi: 10.1016/s0022-2836(65)80111-5. [DOI] [PubMed] [Google Scholar]
- 31.Semisotnov GV, Rodionova NA, Razgulyaev OI, Uversky VN, Gripas AF, Gilmanshin RI. Study of the “molten globule” intermediate state in protein folding by a hydrophobic fluorescent probe. Biopolymers. 1991;31:119–128. doi: 10.1002/bip.360310111. [DOI] [PubMed] [Google Scholar]
- 32.Rosen CG, Weber G. Dimer formation from 1-amino-8-naphthalenesulfonate catalyzed by bovine serum albumin. A new fluorescent molecule with exceptional binding properties. Biochemistry. 1969;8:3915–3920. doi: 10.1021/bi00838a006. [DOI] [PubMed] [Google Scholar]
- 33.Myers JK, Pace CN, Scholtz JM. Denaturant M values and heat capacity changes: relation to changes in accessible areas of protein unfolding. Protein Sci. 1995;4:2138–2148. doi: 10.1002/pro.5560041020. [DOI] [PMC free article] [PubMed] [Google Scholar]
- 34.Baskakov IV, Bolen DW. The paradox between CP’ for denaturation of ribonuclease T1 with disulfide bonds intact and broken. Protein Sci. 1999;8:1314–1319. doi: 10.1110/ps.8.6.1314. [DOI] [PMC free article] [PubMed] [Google Scholar]
- 35.Saito H, Dhanasekaran P, Baldwin F, Weisgraber KH, Lund-Katz S, Phillips MC. Lipid binding-induced conformational change in human apolipoprotein E. Evidence for two lipid-bound states on spherical particles. J Biol Chem. 2001;276:40949–40954. doi: 10.1074/jbc.M106337200. [DOI] [PubMed] [Google Scholar]
- 36.Saito H, Dhanasekaran P, Nguyen D, Deridder E, Holvoet P, Lund-Katz S, Phillips MC. Alpha-helix formation is required for high affinity binding of human apolipoprotein A-I to lipids. J Biol Chem. 2004;279:20974–20981. doi: 10.1074/jbc.M402043200. [DOI] [PubMed] [Google Scholar]
- 37.Cohen P. The regulation of protein function by multisite phosphorylation--a 25 year update. Trends Biochem Sci. 2000;25:596–601. doi: 10.1016/s0968-0004(00)01712-6. [DOI] [PubMed] [Google Scholar]
- 38.Barrick D, Baldwin RL. Stein and Moore Award address. The molten globule intermediate of apomyoglobin and the process of protein folding. Protein Sci. 1993;2:869–876. doi: 10.1002/pro.5560020601. [DOI] [PMC free article] [PubMed] [Google Scholar]
- 39.Kuwajima K. The molten globule state as a clue for understanding the folding and cooperativity of globular-protein structure. Proteins. 1989;6:87–103. doi: 10.1002/prot.340060202. [DOI] [PubMed] [Google Scholar]
- 40.Ptitsyn OB. Molten globule and protein folding. Adv Protein Chem. 1995;47:83–229. doi: 10.1016/s0065-3233(08)60546-x. [DOI] [PubMed] [Google Scholar]
- 41.Qureshi SH, Moza B, Yadav S, Ahmad F. Conformational and thermodynamic characterization of the molten globule state occurring during unfolding of cytochromes-c by weak salt denaturants. Biochemistry. 2003;42:1684–1695. doi: 10.1021/bi0271042. [DOI] [PubMed] [Google Scholar]
- 42.Waksman G, Kominos D, Robertson SC, Pant N, Baltimore D, Birge RB, Cowburn D, Hanafusa H, Mayer BJ, Overduin M, Resh MD, Rios CB, Silverman L, Kuriyan J. Crystal structure of the phosphotyrosine recognition domain SH2 of v-src complexed with tyrosine-phosphorylated peptides. Nature. 1992;358:646–653. doi: 10.1038/358646a0. [DOI] [PubMed] [Google Scholar]
- 43.Fink AL. Natively unfolded proteins. Curr Opin Struct Biol. 2005;15:35–41. doi: 10.1016/j.sbi.2005.01.002. [DOI] [PubMed] [Google Scholar]
- 44.Dunker AK, Lawson JD, Brown CJ, Williams RM, Romero P, Oh JS, Oldfield CJ, Campen AM, Ratliff CM, Hipps KW, Ausio J, Nissen MS, Reeves R, Kang C, Kissinger CR, Bailey RW, Griswold MD, Chiu W, Garner EC, Obradovic Z. Intrinsically disordered protein. J Mol Graph Model. 2001;19:26–59. doi: 10.1016/s1093-3263(00)00138-8. [DOI] [PubMed] [Google Scholar]
- 45.Bemporad F, Gsponer J, Hopearuoho HI, Plakoutsi G, Stati G, Stefani M, Taddei N, Vendruscolo M, Chiti F. Biological function in a non-native partially folded state of a protein. EMBO J. 2008;27:1525–1535. doi: 10.1038/emboj.2008.82. [DOI] [PMC free article] [PubMed] [Google Scholar]
- 46.Kukreja R, Singh B. Biologically active novel conformational state of botulinum, the most poisonous poison. J Biol Chem. 2005;280:39346–39352. doi: 10.1074/jbc.M508463200. [DOI] [PubMed] [Google Scholar]
- 47.Uversky VN, Dunker AK. Understanding protein non-folding. Biochim Biophys Acta. 2010;1804:1231–1264. doi: 10.1016/j.bbapap.2010.01.017. [DOI] [PMC free article] [PubMed] [Google Scholar]
- 48.Arai M, Kuwajima K. Role of the molten globule state in protein folding. Adv Protein Chem. 2000;53:209–282. doi: 10.1016/s0065-3233(00)53005-8. [DOI] [PubMed] [Google Scholar]
- 49.Pervushin K, Vamvaca K, Vogeli B, Hilvert D. Structure and dynamics of a molten globular enzyme. Nat Struct Mol Biol. 2007;14:1202–1206. doi: 10.1038/nsmb1325. [DOI] [PubMed] [Google Scholar]
- 50.Uversky VN, Kutyshenko VP, Protasova N, Rogov VV, Vassilenko KS, Gudkov AT. Circularly permuted dihydrofolate reductase possesses all the properties of the molten globule state, but can resume functional tertiary structure by interaction with its ligands. Protein Sci. 1996;5:1844–1851. doi: 10.1002/pro.5560050910. [DOI] [PMC free article] [PubMed] [Google Scholar]
Associated Data
This section collects any data citations, data availability statements, or supplementary materials included in this article.