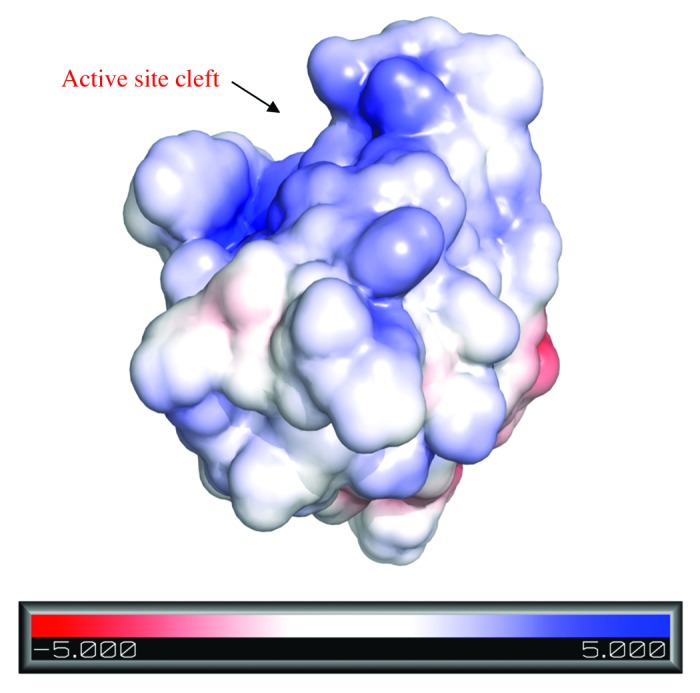
Figure 8. Electrostatic surface representation of CHAPK with the active site cleft indicated by a black arrow. The protein surface is colored according to its electrostatic potential from regions of red (negatively charged) to blue (positively charged). Model created in PyMOL using the Adaptive Poison Boltzmann Solver (APBS) program.
