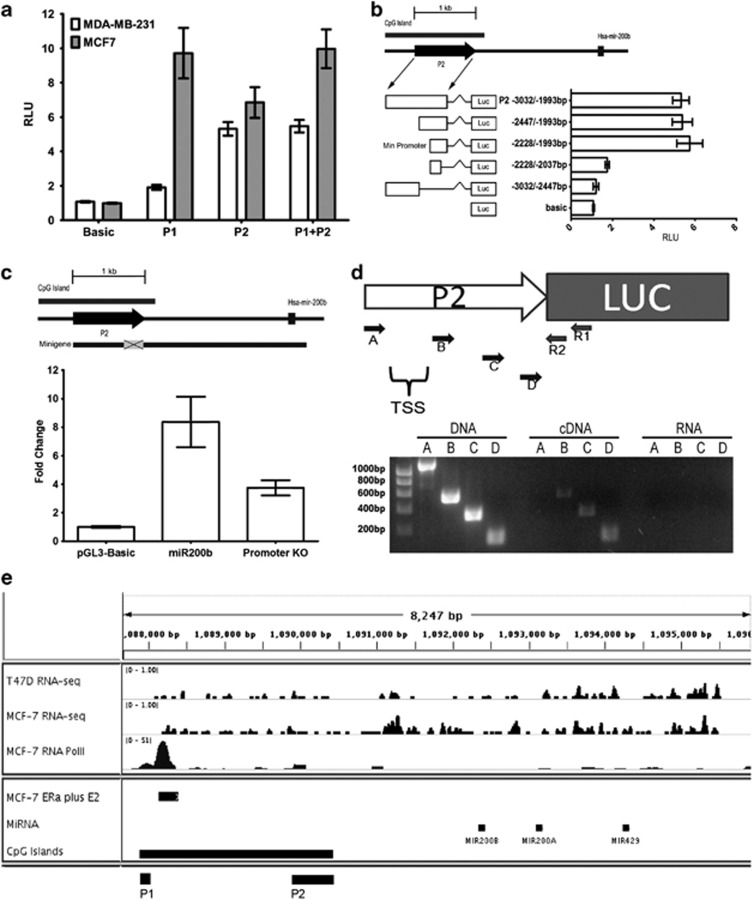
Figure 6.
miR-200b cluster has two functional promoters. (a) Promoter activities of miR-200b P1 and P2 in MCF7 and MDA-MB-231 cells. Reporter activity is expressed in RLU±the s.e.m. Data were generated from three independent experiments. White bars represent activity in MDA-MB-231 cells whereas grey bars represent activity in MCF7 cells. (b) Luciferase activities of various miR-200b P2 5′ and 3′ truncations. Graphical representation of the various reporter fragments in relation to their genomic locations and their associated reporter activities expressed in RLU. Error bars represent s.e. of three separate experiments. (c) Top: relative location of the minigene to P2, Hsa-mir-200b and the CGI. Grey box represents the region deleted in the minigene promoter KO construct. Bottom: MDA-MB-231 cells were transfected with pGL3-basic, miR200b minigene or miR200b minigene promoter KO plasmids and assayed for mature miR-200b expression by TaqMan real-time PCR±s.e. (d) Top: schematic of the miR-200b P2 luciferase construct. The white arrow represents the P2 promoter followed by the luciferase gene. Primers R1, R2, A to D are represented small arrows. Bottom: DNA agarose gel of the 5′ PCR walk using the R2 primer with either Primer A, B, C or D, as labelled above each lane. (e) RNA-sequence profiles in T47D and MCF7 and RNA Polymerase II (RNA PolII) chip profile of MCF7 at the miR-200b locus. Peaks in RNA-sequence tracks represent expression detected at that region. Peaks represent RNA PolII binding in RNA PolII track. Horizontal bars indicate the location of the miR-200b cluster, CGI and oestrogen response element.

