

Abstract
C1 neurons activate sympathetic tone and stimulate the hypothalamic– pituitary–adrenal axis in circumstances such as pain, hypoxia or hypotension. They also innervate pontine noradrenergic cell groups, including the locus coeruleus (LC) and A5. Activation of C1 neurons reportedly inhibits LC neurons; however, because these neurons are glutamatergic and have excitatory effects elsewhere, we re-examined the effect of C1 activation on pontine noradrenergic neurons (LC and A5) using a more selective method. Using a lentivirus that expresses channelrhodopsin2 (ChR2) under the control of the artificial promoter PRSx8, we restricted ChR2 expression to C1 neurons (67%), retrotrapezoid nucleus neurons (20%) and cholinergic neurons (13%). The LC contained ChR2-positive terminals that formed asymmetric synapses and were immunoreactive for vesicular glutamate transporter type 2. Low-frequency photostimulation of ChR2-expressing neurons activated LC (38 of 65; 58%) and A5 neurons (11 of 16; 69%) and sympathetic nerve discharge. Locus coeruleus and A5 inhibition was not seen unless preceded by excitation. Locus coeruleus activation was eliminated by intracerebroventricular kynurenic acid. Stimulation of ChR2-expressing neurons at 20 Hz produced modest increases in LC and A5 neuronal discharge. In additional rats, the retrotrapezoid nucleus region was destroyed with substance P–saporin prior to lentivirus injection into the rostral ventrolateral medulla, increasing the proportion of C1 ChR2-expressing neurons (83%). Photostimulation in these rats activated the same proportion of LC and A5 neurons as in control rats but produced no effect on sympathetic nerve discharge owing to the destruction of bulbospinal C1 neurons. In conclusion, low-frequency stimulation of C1 neurons activates pontine noradrenergic neurons and sympathetic nerve discharge, possibly via the release of glutamate from monosynaptic C1 inputs.
Key points
C1 neurons activate sympathetic tone and stimulate the hypothalamic–pituitary–adrenal axis in circumstances such as pain, hypoxia or hypotension.
C1 neurons innervate pontine noradrenergic cell groups, including the locus coeruleus (LC) and A5.
In this study, using an optogenetic approach in anaesthetized rats, we show that C1 neurons form excitatory synapses with LC neurons and that selective stimulation of C1 neurons activates LC and A5 neurons.
These results show that the C1 neurons activate pontine noradrenergic neurons through the release of glutamate. This effect may be important in the arousal-promoting effects of hypoxia and pain.
Introduction
The C1 adrenergic neurons, located in the rostral ventrolateral medulla oblongata (RVLM), activate sympathetic tone and the hypothalamic–pituitary–adrenal axis (Hökfelt et al. 1974; Ross et al. 1984; Sawchenko et al. 2000; Guyenet, 2006; Abbott et al. 2009b; Marina et al. 2011). The C1 neurons also target several brainstem noradrenergic nuclei, notably the locus coeruleus (LC) and the A5 neurons in the ventrolateral pons (Hökfelt et al. 1974; Aston-Jones et al. 1986; Milner et al. 1989; Card et al. 2006). In fact, 30% of the synaptic inputs to the cell-dense core of the locus coeruleus contain the enzyme phenylethanolamine N-methyltransferase (PNMT) and therefore originate from adrenergic neurons (Hökfelt et al. 1974; Milner et al. 1989).
Neurophysiological evidence suggests that this dense C1–LC connection is inhibitory (Aston-Jones et al. 1992; Ennis et al. 1992), implying that the C1 neurons could have the effect of reducing vigilance and arousal (Aston-Jones & Cohen, 2005). Yet, the notion that these cells inhibit LC neurons is at odds with their morphological and functional characteristics. For instance, unlike the pontine noradrenergic neurons, the C1 neurons contain the mRNA that encodes vesicular glutamate transporter 2 (VGLUT2) and therefore presumably release glutamate (Stornetta et al. 2002; Guyenet, 2006). Also, in the LC and elsewhere, the nerve endings of C1 neurons are densely packed with small, clear vesicles and form asymmetric synapses characteristic of glutamatergic transmission (Milner et al. 1988, 1989). Finally, C1 cells are activated by acute somatic and visceral pain, hypotension, acute hypoxia or hypercapnia. Each of these conditions increases sympathetic tone and activates the hypothalamic-pituitary-adrenal axis (Morrison & Reis, 1989; Marshall, 1994; Sun & Reis, 1996; Hirooka et al. 1997; Sawchenko et al. 2000; Guo et al. 2002; Guyenet, 2006). In addition, these conditions also produce differing degrees of alertness or arousal (Pappenheimer, 1977; Bowes et al. 1981; Berthon-Jones & Sullivan, 1984; Marshall, 1994). As increased alertness is uniformly associated with LC activation, an inhibitory input from the C1 neurons to the LC during conditions such as hypotension and hypoxia is hard to rationalize.
These apparent inconsistencies prompted us to reinvestigate the influence of the C1 cells on the activity of LC and A5 neurons with a channelrhodopsin2 (ChR2)-based optogenetic approach (Abbott et al. 2009b), which permits more selective activation of the C1 cells than previously used methods (Aston-Jones et al. 1992; Ennis et al. 1992). Trasngene expression was targeted to C1 neurons using a lentiviral vector encoding ChR2-mCherry under the control of the artificial promoter PRSx8 (Hwang et al. 2001; Duale et al. 2007; Abbott et al. 2009b). The cell selectivity of this promoter relies on the presence of transcription factors Phox2a and Phox2b which, in the ventrolateral medulla of adult rodents, are produced predominantly by the C1 cells and the nearby retrotrapezoid nucleus (RTN; Kang et al. 2007; Card et al. 2010). In a subset of rats, we destroyed the RTN neurons with a substance P–saporin conjuguate (Takakura et al. 2008) in order to transduce the C1 neurons with even greater selectivity.
Methods
The experiments were performed in male Sprague–Dawley rats (n= 29, 10–12 weeks old, 225–325 g; Taconic, Hudson, NY, USA) in accordance with NIH and Institutional Animal Care and Use Guidelines. The Animal Research Committee of the University of Virginia approved all procedures and protocols. All protocols and procedures are in compliance with the guidelines set out by Drummond (2009).
Viral vector preparation and injection
We used a previously described lentiviral vector that expresses enhanced humanized ChR2 fused with mCherry under the control of the artificial Phox2 (a/b) specific promoter PRSx8 (pLenti-PRSx8-hChR2(H134R)- mCherry-WPRE, henceforth abbreviated PRSx8-ChR2- mCherry; Hwang et al. 2001; Duale et al. 2007; Abbott et al. 2009a,b). Two different batches of PRSx8-ChR2-mCherry were used in this study. The first lentivirus was produced in house and its titer, 1.0 × 10⁸ (transducing units) TU ml−1, was determined as previously described (Abbott et al. 2009b). The other lentivirus was produced by the University of North Carolina core facility and was diluted to a final titer of 3.0 × 10⁸ TU ml−1 in sterile Dulbecco's phosphate-buffered saline before use.
The PRSx8-ChR2-mCherry was injected in rats anaesthetized with a bolus of ketamine (75 mg kg−1), xylazine (5 mg kg−1) and acepromazine (1 mg kg−1) given i.m. The facial nerve was stimulated (0.1 ms, 100–500 μA, 1 Hz) to evoke antidromic field potentials within the facial motor nucleus as previously described (Brown & Guyenet, 1985). These field potentials were used to map the caudal and ventral extent of the facial motor nucleus and thus determine the location of the C1 neurons that reside caudal and slightly medial to this nucleus. Rats (n= 19) received two 200 nl pressure injections of PRSx8-ChR2-mCherry into the rostral C1 region centred 100 and 400 μm caudal to the facial motor nucleus (approximate co-ordinates: 1.9 mm lateral, 2.7–3.1 mm caudal to lambda and 8.5–9.0 mm ventral from the surface of the brain). In a second group of rats (n= 7), saporin conjugated to a substance P analogue (SSP–saporin; Takakura et al. 2008) was first injected under the caudal edge of the facial motor nucleus to destroy the RTN (2 × 30 nl, 200 μm apart, 1.9 mm lateral, 2.5–2.7 mm caudal to lambda and 8.8–9.3 mm ventral from the dorsal surface of the brain; concentration 0.6 ng (30 nl)-1; Advanced Targeting Systems, San Diego, CA, USA). Then, PRSx8-ChR2-mCherry was microinjected into the C1 region 300 and 600 μm caudal to the facial motor nucleus (200 nl per site). The rats were treated with ampicillin, Sandoz, Princeton, NJ (100 mg kg−1, i.m.) and ketoprofen, Fort Dodge Animal House, Fort Dodge, IA, USA (0.6 mg kg−1, i.p.) for two consecutive days thereafter.
Physiology
Between 2 and 6 weeks after PRSx8-ChR2-mCherry injection, rats were re-anaesthetized with 5% isoflurane in pure oxygen and maintained under artificial ventilation with 3.0–3.5% isoflurane in 100% oxygen following tracheal cannulation. Cannulation of the femoral vein and artery for administration of fluids and arterial blood pressure recording, exposure of the left mandibular branch of the facial nerve for antidromic mapping of the facial motor nucleus, dissection and recording of the renal and splanchnic sympathetic nerves and craniotomy for optical fibre and electrode insertion were done as previously described (Guyenet et al. 2005; Moreira et al. 2006; Kanbar et al. 2011). In three rats, PE-10 tubing filled with saline was inserted through the dura mater into the cerebroventricular space and sealed in place with cyanoacrylic glue. This cannula was used to administer the broad-spectrum ionotropic glutamate receptor antagonist kynurenic acid (250 mm, 5–10 μl dissolved in distilled H2O, pH 7.3; Sigma) during experiments (rate <5 μl min−1).
Photostimulation of the ventrolateral medulla was performed through a 200-μm-thick multimode optical fibre (Thor labs, Newton, NJ, USA) connected to a diode-pumped solid-state blue laser (473 nm; CrystaLaser, Reno, NV, USA) controlled by Transistor-Transistor Logic TTL pulses from a Grass model S88 stimulator (AstroMed Inc., West Warwick, RI, USA). Laser output measured at the tip of the fibre was set at 9 mW prior to the insertion of the fibre in each experiment (Abbott et al. 2009a). Prior to the insertion of the fibre, the facial motor nucleus was mapped as described in the previous paragraph to determine the caudal and ventral extent of the facial field. Based on this mapping, the fibre was inserted between 200 and 500 μm caudal to the facial field and at a depth of 500 μm dorsal to the lowest level at which a field potential could be evoked within the facial motor nucleus (approximate co-ordinates: 1.9 mm lateral, 2.7–3.1 mm caudal to lambda and 8.0–8.5 mm ventral from the surface of the brain). When LC neurons were recorded, the optical fibre was inserted into the medulla oblongata at a 20 deg angle from the vertical in the transverse plane. The optical fibre was inserted vertically when recordings were made in the A5 region.
Upon completion of surgical procedures, isoflurane was gradually withdrawn, while freshly prepared α-chloralose (dissolved in 2% sodium borate; initial dose, 70 mg kg−1; additional doses of 20 mg kg−1 as required, n= 9 for LC recordings) or urethane (10% w/v in physiological saline; initial dose, 1.4 g kg−1; additional doses of 130 mg kg−1 as required, n= 17 for LC and A5 recordings) was slowly infused i.v. and ventilation with 100% O2 was continued. Following the initial doses of α-chloralose or urethane and the complete removal of isoflurane, rats were allowed 30 min to stabilize before commencing recordings. The adequacy of the anaesthesia was assessed by the absence of the withdrawal reflex and changes in arterial pressure in response to a firm paw pinch. Paralysis was induced with pancuronium bromide prior to the recordings (initial dose 1 mg kg−1 i.v. plus additional 0.2 mg kg−1 doses if needed). Thereafter, the adequacy of the anaesthesia was judged by the absence of changes in arterial pressure responses to a firm toe or tail pinch. Rectal temperature was maintained at 37.0 ± 0.5°C. End-tidal CO2 was continuously monitored with a micro-capnometer (Columbus Instruments, Columbus, OH, USA) and maintained between 3.5 and 4.5%.
Locus coeruleus and A5 neurons were recorded extracellularly using glass pipettes filled with 2 m NaCl (8–14MΩ) or with 5% w/v biotinamide in 0.5 m sodium acetate (18–22 MΩ) in cases where juxtacellular labelling was attempted (Schreihofer & Guyenet, 1997). Locus coeruleus neurons were located ∼6.0 mm below the cerebellar surface, 0.8–1.4 mm lateral to the mid-line and 0.8–1.3 mm caudal to the parieto-occipital suture. Identification of LC neurons was based on their low basal discharge and large triphasic action potential, a characteristic excitation–inhibition response to contralateral toe pinch and a very high packing density (Cedarbaum & Aghajanian, 1976). The A5 neurons were recorded with electrodes inserted at 24 deg from vertical at a depth between 9.5 and 11.0 mm from the surface in the parasagittal plane, approximately 2.0–2.3 mm lateral to the mid-line and 2.5–3.0 mm rostral to the parieto-occipital suture. Identification of A5 neurons was based on their projections to the spinal cord, low firing rate (<5 Hz) and weak CO2 response (Andrade & Aghajanian, 1982; Kanbar et al. 2011). The existence of a spinal axon was identified by antidromic activation from the thoracic spinal cord (segments T3–T4; 0.5 ms, 1–2 mA; bipolar electrode inserted in the dorsolateral funiculus).
All analog data were acquired on a computer via a micro1401 digitizer [Cambridge Electronics (CED), Cambridge, UK] and were processed offline using Spike software (CED). Integrated sympathetic nerve discharge (SND) was obtained after rectification and smoothing (time constant = 1 s) of the original signal that was acquired with a 300–3000 Hz bandpass filter. The SND was normalized within rats by assigning a value of 100 to resting SND and a value of zero to the minimal value recorded at saturation of the baroreflex during administration of phenylephrine (10 μg kg−1; i.v.).
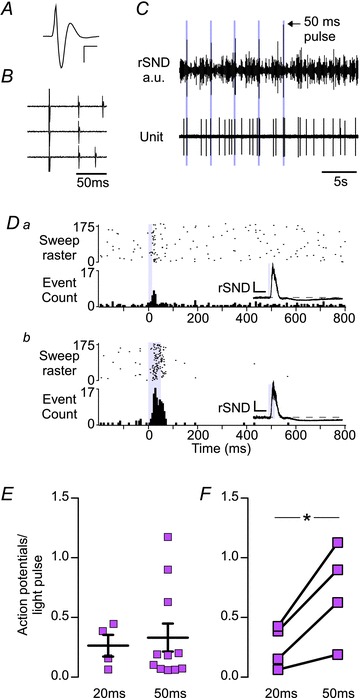
Photostimulation consisted of light pulses delivered at low frequency (0.3–1 Hz, 20 and 50 ms pulse duration) or as 20 Hz trains (20–30 s, 10–20 ms pulse duration). Continuous stimulation (20 Hz, 10 ms light pulses) entrained the discharge rate of ChR2-expressing neurons on a 1:1 and occasionally 2:1 basis (ratio of action potentials to light pulse; Abbott et al. 2009b). However, light pulses delivered at low frequency (<2 Hz) evoked two or three action potentials per 20 ms pulse and four or five action potentials per 50 ms pulse in putative C1 cells recorded extracellularly under urethane anaesthesia (Fig. 1).
Figure 1. Response of a humanized enhanced channelrhodopsin2 (ChR2)-expressing rostral ventrolateral medulla (RVLM) neuron to different stimulus protocols.
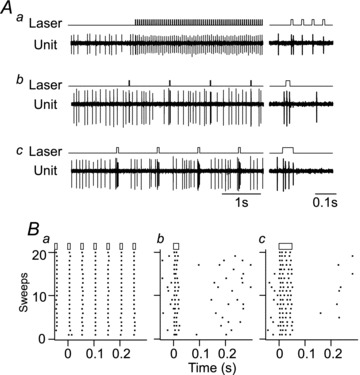
A, effect of three different stimulus protocols on the discharge of a representative ChR2-expressing neuron, presumed to be a C1 neuron based on its location and its baromodulated discharge pattern. Stimulation with 10 ms pulses delivered at 20 Hz entrains neuronal discharge at the stimulus frequency (Aa). Note that the first light pulse in the train produces two action potentials and a single one thereafter. Stimulation of the same neuron with 20 (Ab) or 50 ms (Ac) light pulses at 1 Hz reliably produces bursts of action potentials. B, raster plots of neuronal discharge during 20 consecutive stimuli for the examples presented in (A). In this case, 20 Hz stimulation with a 10 ms pulse (Ba) produce a single action potential for every light pulse, whereas low-frequency stimulation at 1 Hz reliably produces two and four action potentials per pulse using a 20 (Bb) and 50 ms (Bc) light pulse, respectively.
Peristimulus triggered histograms (PSTHs) of LC and A5 unit activity were generated by averaging sweeps of unit activity triggered from the stimulus onset (median sweep count, 216; range, 65–697). A neuron was judged to be significantly activated by photostimulation of the RVLM if the count in any one 5 ms bin was greater than two standard deviations above the mean of the prestimulus period. Further analysis was focused on neurons satisfying the above criteria. We did not observe neurons exhibiting a purely inhibitory response.
To quantify the activation of LC and A5 neurons, we measured the number of action potentials in excess of baseline generated during the excitation period (0–150 ms following onset of RVLM stimulus) and divided this number by the corresponding number of light pulses used to build the peristimulus triggered histogram. This ratio reflects the probability for a single light pulse delivered in the RVLM to evoke an action potential in an LC or A5 neuron. Maximal postactivation inhibition was evaluated from the same PSTHs by averaging the bin counts between 150 and 200 ms post-stimulus and expressing these values as a percentage of prestimulus activity.
Statistics
Statistical analysis was done using Prism software (version 5; GraphPad Software Inc., La Jolla, CA, USA). Values are given as means ± SEM unless otherwise stated. Significant differences were determined using Student's paired t-test, one- and two-way ANOVA with multiple comparisons following D’Agostino–Pearson omnibus normality tests unless otherwise noted. Differences were considered statistically significant when P < 0.05.
Light microscopy histology
At the end of the experiment, rats were overdosed with urethane and perfused with a heparin solution followed by a saline rinse and buffered 4% paraformaldehyde, pH 7.4. After 1–2 days of postfixation, coronal sections were cut at 30 μm on a vibrating microtome and stored in a cryoprotectant solution (20% glycerol plus 30% ethylene glycol in 50 mm phosphate buffer, pH 7.4) at –20°C until further processing.
Immunohistochemical detection of mCherry (marker for ChR2-expressing neurons), tyrosine hydroxylase (TH; C1, A5 and LC neurons), choline acetyltransfrease (ChAT) and PNMT was done using previously established methods and antibodies (Mulkey et al. 2004; Kang et al. 2007). Briefly, all sections were processed free-floating using a Tris-based buffer through rinses and antibody incubations, then mounted, air dried and dehydrated through a graded series of alcohols and xylenes and covered with DPX mounting medium. The mCherry protein was detected using a cross-reacting anti-DsRed antibody (rabbit polyclonal, 1:500 dilution, Clontech no. 632496; Clontech Laboratories, Mountain View, CA, USA) with the secondary antibody Cy3- tagged anti-rabbit-IgG (1:200 dilution; Jackson ImmunnoResearch Laboratories, West Grove, PA, USA) used to visualize mCherry-immunoreactivity as red fluorescence. Tyrosine hydroxylase was detected with a sheep polyclonal antibody (Millipore no. AB1542; EMD Millipore, Rockland, MA, USA) used at 1:2000 dilution. Alexafluor 488-tagged donkey anti-sheep antibody (1:200 dilution; Jackson ImmunnoResearch Laboratories) was used as a secondary antibody to visualize TH-immunoreactivity as green fluorescence. Vesicular glutamate transporter type 2 was detected with anti-VGLUT2 antibody (guinea-pig polyclonal, 1:2000 dilution, Millipore no. AB2251; Millipore), with Alexafluor 488-tagged donkey anti-guinea-pig (1:200 dilution; Jackson ImmunnoResearch Laboratories) as the secondary antibody, to visualize VGLUT2-immunoreactivity as green fluorescence. Phenylethanolamine N-methyltransferase was detected using a rabbit polyclonal antibody (provided by M. C. Bohn, Northwestern University, Chicago, IL) used at 1:3000 dilution and revealed with a Cy3-tagged anti-rabbit IgG (1:200 dilution; Jackson ImmunnoResearch Laboratories) visualized as red fluorescence.
Cell counts were taken from a one-in-six series of sections using a computer-assisted plotting program (Neurolucida, version 10; MBF Bioscience, Colcehster, VT, USA) that allowed tracing of each coronal section and precise placement of cell profiles. Only profiles containing a nucleus were counted. Tracings were exported as vector drawings to Canvas software (version 10; ACD Systems, Seattle, WA, USA) for final assembly and labelling.
Immunohistochemistry for electron microscopy
Three rats were injected (2 × 180 nl) with PRSx8-ChR2-mCherry lentivirus in the RVLM, 0 and 400 μm caudal to the facial motor nucleus. Four weeks later, these rats were processed for electron microscopic ultrastructural analysis as previously described (Bochorishvili et al. 2011) using the same rabbit anti-dsRed antibody described in the previous subsection. Ultrathin sections of the LC (75–80 nm thick) were collected on mesh grids and analysed for mCherry-immunoreactive (ir) terminals using transmission electron microscopy (JEOL 1230, with real-time digital imaging; JEOL USA, Inc. Peabody, MA, USA).
Results
Channelrhodopsin2-expressing C1 neurons innervate LC and A5 neurons
In 19 rats used for physiology experiments, 117 ± 11 ChR2-expressing (mCherry-ir) neurons were counted in every sixth section (approximately ∼700 mCherry-ir neurons per rat without correction for double counting). Of this total, 66.9 ± 3.7% were catecholaminergic (TH-ir; Fig. 2A and H). The ChR2-expressing TH-ir neurons were confined to within ∼1 mm of the caudal pole of the facial motor nucleus (Fig. 2H). The mCherry-ir neurons that lacked TH (33.0 ± 3.6%) were most often located below the ventral pole of the facial motor nucleus or within the marginal layer of the ventral medullary surface and were likely to have been RTN neurons (Stornetta et al. 2006; Abbott et al. 2009a). In cases where ChAT immunoreactivity was examined (11 of 19), 12.8 ± 3.7% of all ChR2-expressing neurons were positive for this enzyme. Choline acetyltransferase-immunoreactive neurons were found dorsal to TH-ir neurons and never in the facial motor nucleus, suggesting that these cells were parasympathetic preganglionic neurons or airway motor neurons.
Figure 2. Channelrhodopsin2-expressing neurons in the RVLM innervate the locus coeruleus (LC) and A5 region and are excitatory.
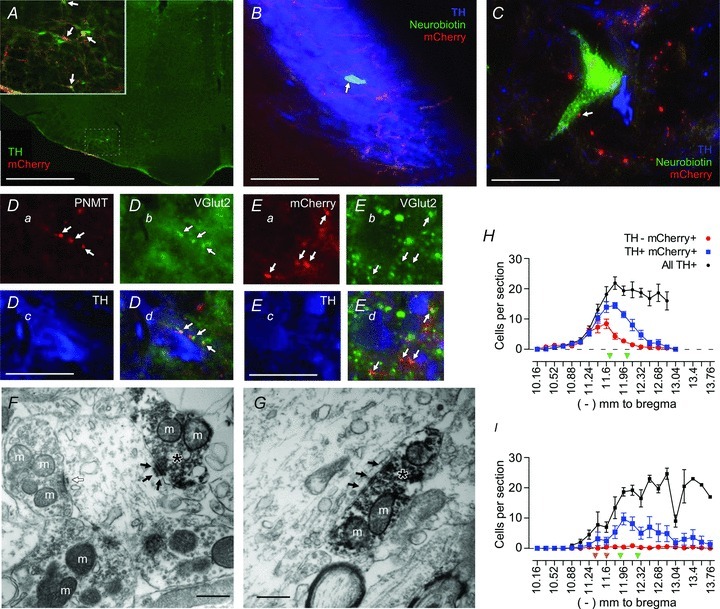
A, low-magnification view of a coronal section of the brainstem (approximately 11.6 mm caudal to bregma) in a rat injected with PRSx8-ChR2-mCherry lentivirus. Channelrhodopsin2-expressing neurons in the RVLM are predominantly catecholaminergic [tyrosine hydroxylase-immunoreactive (TH-ir); in green]. Channelrhodopsin2-mCherry (in red) is visualized with a cross-reacting DsRed antibody. Double-labelled neurons appear orange (examples indicated by arrows in the inset). Inset, higher power view of the RVLM region that contained transduced neurons. B, a juxtacellularly filled locus coeruleus (LC) neuron [neurobiotin (NB) in green; indicated by arrow] surrounded by many TH-ir neurons (in blue). Channelrhodopsin2-mCherry-ir axonal fibres (in red) course within the cell-body-rich core of the LC. C, a neurobiotin-filled A5 neuron (in green) containing TH-immunoreactivity (in blue). Channelrhodopsin2-mCherry-ir processes are in red, and a putative contact between an axonal varicosity and the recorded A5 neuron is indicated by an arrow. Catecholaminergic neurons in the A5 region are sparsely distributed compared with the LC. D, phenylethanolamine N-methyltransferase (PNMT)-ir processes (in red; Da) are vesicular glutamate transporter type 2 (VGLUT2)-ir (in green; Db) within the LC (TH in blue; Dc). The PNMT/VGLUT2-ir boutons appear in yellow; examples are indicated by arrows (Dd). E, mCherry-ir boutons (in red; Ea) are VGLUT2-ir (in green; Eb) in the LC (TH in blue; Ec), and mCherry/VGLUT2-ir boutons appear in yellow; examples are indicated by arrows (Ed). F and G show the ultrastructure of the synaptic contacts between the terminals of ChR2-mCherry-expressing neurons and an LC neuron. The mCherry-ir terminals (indicated with asterisks) contain intracellular and plasma-membrane-associated electron-dense immunoperoxidase reaction product. In both F and G, mCherry-ir terminals in the LC area make asymmetric synaptic contacts (black arrows) with unlabelled dendrites. An asymmetric synapse formed between an unlabelled terminal and an unlabelled dendrite is also shown (open arrow in F). Mitochondria are indicated with the letter m. H, rostrocaudal (left–right) distribution of mCherry-ir neurons after injection of PRSx8-ChR2-mCherry lentivirus into the RVLM of control rats (n= 19). The mCherry-ir, TH-ir and mCherry-ir, non-TH-ir neurons are presented separately, along with the total number of TH-ir neurons identified within the ipsilateral RVLM. The green arrowheads identify the level at which the lentiviral vector has been injected. I, rostrocaudal distribution of ChR2-mCherry-ir neurons in rats injected with substance P analogue (SSP)–saporin toxin to destroy RTN neurons (n= 7). The level at which the toxin was injected is indicated by two orange arrowheads. The PRSx8-ChR2-mCherry lentivirus was injected at the level indicated by the two green arrowheads. Note the reduction in the total number of TH-ir neurons rostral to a level –12.0 mm from bregma relative to H. Scale bars are as follows: A, 1 mm; inset, 250 μm; B, 125 μm; C, 40 μm; D, 30 μm; E, 30 μm; and F and G, 0.5 μm.
Dense mCherry-ir axonal processes and terminal fields were present in the cell-body-rich core of the locus coeruleus, with sparser projections in the pericoeruleus area (Fig. 2B). In the A5 region, mCherry-ir processes overlapped with TH-ir neurons (Fig. 2C). The LC and A5 regions contained numerous terminals that were immunoreactive for both PNMT and VGLUT2 (Fig. 2D), indicating that at least some of the adrenergic terminals in these areas were glutamatergic. In addition, many mCherry-ir varicosities located within the LC contained detectable levels of VGLUT2 (Fig. 2E). Finally, the ultrastructure of the mCherry-ir terminals located within the LC was examined in three rats. The mCherry-ir varicosities (n= 15) contained predominantly round or spherical vesicles and formed asymmetric synapses, generally associated with excitatory contacts, with putative LC neurons (Fig. 2F and G). All 15 synapses were located on dendrites of LC neurons. This evidence suggests that LC neurons receive a monosynaptic glutamatergic input from the ChR2-expressing RVLM neurons. For reasons detailed in the Discussion, we believe that most if not all the mCherry-ir axonal varicosities present in the LC originated from transduced C1 neurons.
Low-frequency stimulation of the RVLM increases the activity of LC neurons
We recorded from 64 LC neurons in 11 rats. A subset of these neurons was juxtalabelled with biotinamide (11 neurons from four rats). The labelled neurons always resided in the cell-body-rich core of the nucleus (Fig. 2B) and were TH-ir, confirming their catecholaminergic phenotype. These neurons were in close proximity to mCherry-ir axonal processes (Fig. 2B).
The characteristics of the recorded LC neurons were consistent with previous descriptions, i.e. large triphasic action potentials (Fig. 3A), a biphasic response to a firm pinch of the contralateral hindpaw (Fig. 3B) and a low basal discharge rate (2.0 ± 0.3 Hz). The majority of the LC neurons recorded (38 of 65; 58%) were significantly activated by low-frequency stimulation of the RVLM (Fig. 3C–F). We recorded LC neurons activated by RVLM stimulation under α-chloralose (n= 16 of 26; 62%) and urethane anaesthesia (n= 22 of 39; 56%) and found no difference in the proportion of activated neurons (P= 0.83, Fischer's exact test) or the probability that a single light pulse delivered at low frequency would evoke an action potential (P= 0.139, anaesthetic conditions by two-way ANOVA). On this basis, we combined results from both anaesthetic conditions for the remainder of the analysis. In all cells satisfying the criteria for activation, approximately one in every four light pulses evoked an action potential in LC neurons (23.4 ± 3.2% with 20 ms light pulses, n= 30; and 26.5 ± 9.1% with 50 ms light pulses, n= 19). The median latency from the pulse onset to the peak bin count of LC activity was 25 and 35 ms (range 15–75 and 10–90 ms) for 20 and 50 ms stimuli, respectively (Mann–Whitney U test, P= 0.3). Increasing the pulse duration increased the probability of an evoked action potential in neurons that were tested with both 20 and 50 ms pulses (10 neurons from five rats, Student's paired t test, P= 0.018).
Figure 3. The effect of low-frequency photostimulation of the RVLM on the activity of LC neurons.
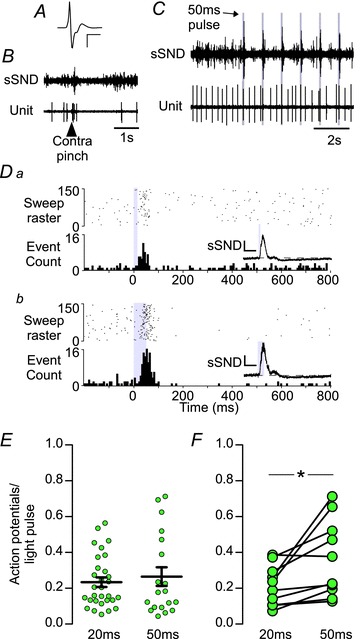
A, waveform average of an extracellular recording of an LC neuron. Calibration bar: x-axis, 2 ms; and y-axis, 500 μV. B, the effect of a noxious pinch of the contralateral hindpaw on splanchnic sympathetic nerve discharge (sSND) and LC unit firing. Both sSND and LC activity show an initial burst of activity followed by a period of inactivity. C, simultaneous recording of sSND and LC activity during low-frequency photostimulation (1 Hz, 50 ms pulse) of the RVLM. D, peristimulus triggered histogram (PSTH) of the activity of an LC neuron during low-frequency stimulation with 20 (Da) or 50 ms light pulses (Db). Each action potential that occurred during the photostimulation trial is plotted as a single point in the raster plot (upper panel), and action potential counts are binned in 5 ms bins in the cumulative histogram (lower panel); 1 s sample period. Insets, waveform averages of sSND during the trial represented in the PSTH. Calibration bar: x-axis, 0.1 s; and y-axis, 300 mV. E, group averages of action potentials to light-pulse ratio for activated LC neurons. F, action potentials to light-pulse ratio in activated LC neurons tested with both 20 and 50 ms light pulses (*P < 0.05).
We administered kynurenic acid [250 mm, 5 μl, intracerebroventricularly (i.c.v.)], a broad spectrum ionotropic glutamate receptor antagonist, in three rats to determine whether excitatory amino acid (EAA) blockade prevented the activation of LC neurons (Fig. 4). Prior to EAA blockade, 11 of 16 (69%) LC neurons in three rats exhibited a significant excitation in response to photostimulation. Following EAA blockade, LC neurons (n= 7) were still active but were unresponsive (i.e. exhibited neither excitatory nor inhibitory responses) to stimulation of the RVLM (P= 0.006 vs. pretreatment, Fisher's exact test). Kynurenic acid administered i.c.v. increased resting blood pressure and SND (not shown), and initially potentiated the effects of RVLM photostimulation on SND (insets in Fig. 4Ac and Bc). Locus coeruleus neurons had, on average, reduced basal activity following kynurenic acid administration (2.2 ± 0.4 vs. 0.9 ± 0.1 Hz, n= 11 and 7 from three rats, Mann–Whitney U test, P= 0.019). Owing to the relative instability of the LC region, we maintained only one LC neuron recording before, during and after kynurenic acid injection (Fig. 4). In normal conditions, this cell had an average discharge of 1.8 Hz and was significantly activated by low-frequency stimulation of the C1 region (Fig. 4A); following EAA blockade, cell firing fell to 0.9 Hz and the cell was no longer activated by photostimulation, although the peripheral sympathoexcitatory effect of stimulation was increased (Fig. 4B). Importantly, the persistence of the sympathoexcitation after EAA blockade strongly suggests that this intervention did not prevent the activation of the ChR2-expressing RVLM neurons by the light pulses. The sympathoexcitatory response persists despite EAA blockade because transmission between the C1 cells and sympathetic preganglionic neurons is monosynaptic, and i.c.v. kynurenic does not reach the thoracic spinal cord at an effective concentration until much later in the experiment (Sun et al. 1988). Together, this evidence suggests that the excitation of LC neurons by stimulation of C1 neurons requires EAA neurotransmission.
Figure 4. Excitatory amino acid blockade abolishes the excitation of LC neurons produced by photostimulation of the RVLM.
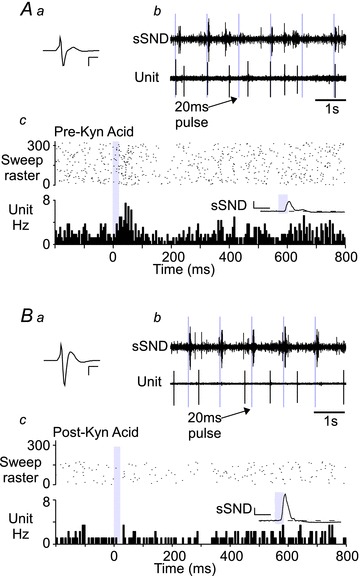
Aa, waveform average of an extracellular recording of an LC neuron. Calibration bar: x-axis, 1 ms; and y-axis, 500 μV. Ab, raw recording of sSND discharge and the neuron in Aa during low-frequency photostimulation of the RVLM (1 Hz, 20 ms pulse). Ac, PSTH of the activity of the LC neuron in Aa during low-frequency stimulation. Inset, waveform average of sSND during the trial used to generate the PSTH. Calibration bar: x-axis, 0.1 s; and y-axis, 100 mV. Ba, as per Aa, except following intracerebroventricular (i.c.v.) administration of kynurenic acid (250 mm, 5 μl). Bb, as for Ab, following i.c.v. kynurenic acid. Bc, as for Ac, following i.c.v. kynurenic acid.
Low-frequency stimulation of the RVLM increases the activity of A5 neurons
We identified 16 A5 neurons in eight rats based on location, large triphasic action potentials (Fig. 5A), low basal discharge frequency (0.90 ± 0.17 Hz) and antidromic activation from the thoracic spinal cord (0.64 ± 0.1 m s−1, antidromic latency 22.4 ± 3.4 ms, range 6–56 ms; Fig. 5A and B). The majority of A5 neurons (11 of 16; 69%) were significantly activated by low-frequency stimulation of the RVLM. On average, one in four 20 ms pulses and one in three 50 ms pulses produced at least one action potential (20 ms, 26.3 ± 9.1%, n= 4; and 50 ms, 33.1 ± 11.7%, n= 11). Some A5 neurons discharged in couplets during stimulation (Fig. 5C), producing a protracted peak in the resulting PSTH (Fig. 5Db). The median latency from the pulse onset to the peak bin count of A5 activity was 30 and 55 ms (range 20–40 and 25–85 ms) for 20 and 50 ms pulse durations, respectively (Mann–Whitney U test, P < 0.03). Increasing pulse width increased the probability of an evoked action potential (four neurons from three rats; from 26.5 ± 8.2 to 70.6 ± 19.3%; P= 0.033).
Figure 5. Effect of low-frequency photostimulation of the RVLM on the activity of A5 neurons.
A, waveform average of an extracellular recording of an A5 neuron. Calibration bar: x-axis, 2 ms; and y-axis, 400 μV. B, bulbospinal A5 neurons were identified by antidromic activation. Note the constant latency of the action potential evoked by spinal cord stimulation (T2–T3) following the large stimulation artefact. The antidromic latency of this cell was 52 ms (conduction velocity, 0.7 m s−1). C, raw recording of renal sympathetic nerve discharge (rSND) and A5 activity during low-frequency stimulation of the RVLM (0.3 Hz, 50 ms pulse). Note that each stimulus produced multiple action potentials in this A5 neuron. D, PSTH of the activity of an A5 neuron during RVLM stimulation with 20 (Da) or 50 ms light pulses (Db; for details see legend to Fig. 3D). Insets, waveform averages of rSND during the trial represented in the PSTH. Calibration bar: x-axis, 0.1 s; and y-axis, 300 mV. E, group averages of action potentials to light-pulse ratio for activated A5 neurons. F, action potentials to light-pulse ratio for neurons tested with both 20 and 50 ms pulses (*P < 0.05).
We successfully labelled and recovered five putative A5 neurons from three rats and found that every cell was TH-ir (Fig. 2C). In addition to the bulbospinal A5 neurons, we encountered a small number of CO2-activated non-bulbospinal neurons, several of which were activated by stimulation of the RVLM. These neurons are likely to have been RTN neurons (Kanbar et al. 2011).
The activity of both LC and A5 neurons was reduced immediately following the excitation produced by RVLM stimulation (Figs 3D, 5D and 6). However, we never observed a discernible inhibition in LC or A5 neurons without a preceding excitation. The magnitude of the postactivation silent period was slightly greater when the RVLM was stimulated with longer light pulses (Fig. 6B). This difference was significant in LC (P= 0.045; Fig. 6B), but not A5 neurons (P= 0.11). Furthermore, the magnitude of the silent period was modestly correlated with the strength of excitation of LC and A5 neurons (0.24 and 0.46, respectively; P < 0.01 for both).
Figure 6. Locus coeruleus and A5 neurons exhibit postactivation inhibition during low-frequency photostimulation.
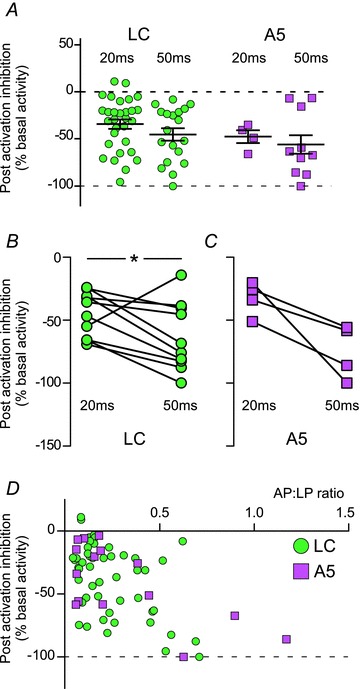
A, postactivation inhibition for all LC and A5 neurons that were significantly activated by photostimulation of the RVLM; for description of analysis, see Methods. B and C, postactivation inhibition for LC (B) and A5 neurons (C) tested with both 20 and 50 ms light pulses. D, x–y plot of the postactivation inhibition relative to the action potentials to light-pulse ratio (AP:LP ratio). The degree of inhibition was significantly correlated with the AP:LP ratio in both LC and A5 neurons (r2= 0.24 and 0.46, respectively, P < 0.01 for both).
We recorded the discharge of the renal or splanchnic sympathetic nerve (rSND or sSND) in all experiments. As previously described (Abbott et al. 2009b), low-frequency stimulation of the RVLM produced a very large burst in SND, followed by a prolonged period of reduced activity (insets in Figs. 3Da-Db; 5Da-Db). On average, increasing the width of the light pulse increased the magnitude of the evoked sympathetic response measured as area under the curve (from 168.1 ± 13.6 to 207.0 ± 20.9% increase relative to baseline, n= 12, P= 0.0039), but the peak amplitude was unchanged (478.2 ± 107.4 vs. 546.0 ± 121.5% of baseline, n= 12, P= 0.15).
In sum, the response of the pontine noradrenergic neurons to intermittent photostimulation of the RVLM ChR2-expressing neurons consisted of an excitation–inhibition sequence that had similar characteristics to the sympathetic nerve response.
Effects of continuous high-frequency stimulation of LC and A5 neurons
In these experiments, we photostimulated the RVLM at 20 Hz (10 or 20 ms pulse width) for 20–30 s (Fig. 7). Consistent with our previous observations in anaesthetized rats (Abbott et al. 2009b), 20 Hz photostimulation modestly increased blood pressure and SND, with virtually no effect on HR (MAP increased from 123 ± 10 to 135 ± 10 mmHg, P= 0.004; SND +22 ± 5% of baseline, P < 0.01; and HR unchanged from 439 ± 19 to 440 ± 17 beats min-1, P= 0.79, n= 6). Note that in proportion to the baseline the steady-state increase in SND (22%) was at least an order of magnitude less than the effect elicited by a single pulse (see previous section of the Results).
Figure 7. High-frequency stimulation of the RVLM modestly increases the activity of LC and A5 neurons.
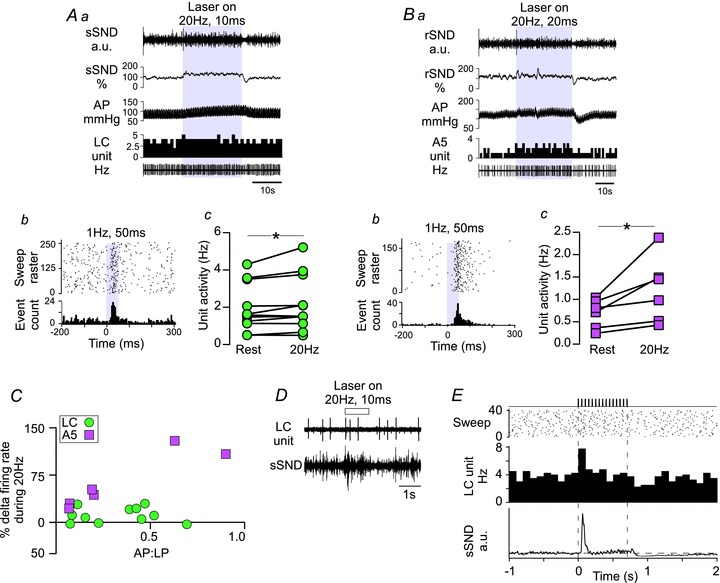
A, the effects of high-frequency stimulation on LC neurons. Aa, original recording of a high-frequency stimulation trial (20 Hz, 10 ms pulse for 30 s). Stimulations produced reliable but modest increases in sSND (expressed as a percentage of baseline) and arterial pressure (AP), and a small increase in the activity of this particular LC neuron (in herz, 1 s bins). Ab, PSTH of the excitation produced by low-frequency stimulation (1 Hz, 50 ms) of the neuron presented in Aa. Ac, For all LC neurons tested (n= 11), high-frequency stimulation increased basal discharge rate (*P < 0.05). B, the effects of high-frequency stimulation on A5 neurons. Ba, original recording as for Aa, except that rSND was recorded. This A5 neuron showed an obvious increase in activity, with fast on–off kinetics. Bb, PSTH of the excitation produced by low-frequency stimulation (0.5 Hz, 50 ms) of the neuron presented in Ba. Bc, high-frequency stimulation increased basal discharge rate of A5 neurons (n= 6, *P < 0.05). C, x–y plot of the effect of high-frequency stimulation (expressed as the percentage change from baseline activity) relative to the action potentials to light-pulse (AP:LP) ratio observed during low frequency photostimulation (50 ms pulses only). For A5 neurons, r2= 0.83, P= 0.01; and for LC neurons, r2 < 0.01, P= 0.96. D, original recording presenting the effect of a short, 1 s, train (20 Hz, 10 ms pulse) on sSND and LC unit activity. E, event-triggered averages of LC firing and sSND from 40 such trials (20 Hz, 10 ms pulse for 1 s every 10 s). Note that LC activity (100 ms bins) is initially increased after the onset of the stimulus, settles very close to prestimulus levels for the remainder of the stimulus and is reduced below baseline after the end of the stimulus. Note the similarity of the sSND response.
In LC neurons, 20 Hz stimulation produced only a small increase in steady-state unit firing rate (Fig. 7Aa), although these neurons were clearly activated by low-frequency stimulation of the RVLM (Fig. 7Ab). On average, 20 Hz stimulation modestly increased LC firing from 2.0 ± 0.4 to 2.2 ± 0.5 Hz (11 neurons from six rats, P= 0.03), even though not all cells showed a detectable increase relative to baseline (Fig. 7Ac). Stimulation of RVLM at 20 Hz produced a slightly more robust increase in the firing of the A5 neurons tested (from 0.6 ± 0.1 to 1.1 ± 0.3 Hz, six neurons from five rats, P= 0.042; Fig. 7Ba–c). There was a significant correlation between the degree of activation during low-frequency stimulation and the increase in firing rate during 20 Hz stimulation of the RVLM for A5 neurons (r2= 0.83, P= 0.01), but not LC neurons (r2 < 0.01, P= 0.96; Fig. 7C). Interestingly, LC unit activity and SND showed quantitatively similar responses to brief (1 s) 20 Hz trains (Fig. 7D and E), consisting of a brief excitation within the first 100 ms of the stimulus followed by a rapid return to near baseline. Following the cessation of the stimulus, both LC firing and SND showed a brief period of inactivity before returning to prestimulus activity. Based on previous reports, we suggest that the continuous activation of SND by RVLM photostimulation is gated by the intrinsic cellular properties of sympathetic preganglionic neurons in the spinal cord (Yoshimura et al. 1987; Abbott et al. 2009b). Similar mechanisms are plausible for the C1–LC activation (see the Discussion).
Photostimulation of the RVLM activates LC and A5 neurons after the destruction of the RTN
Retrotrapezoid nucleus neurons do not innervate the LC (Abbott et al. 2009a; Bochorishvili et al. 2011), but their stimulation could conceivably activate the LC neurons via a polysynaptic route. To exclude this possibility, a substance P analogue conjugated to the ribosomal toxin saporin (SSP–saporin) was injected into the RTN region (Takakura et al. 2008). The PRSx8-ChR2 lentivirus was then injected slightly more caudally within the ventrolateral medulla in the hope of preferentially targeting the C1 neurons.
In toxin-treated rats, injections of the PRSx8-ChR2-mCherry lentivirus transduced approximately 430 neurons (e.g. 73 ± 10 neurons in a one-in-six series of sections). A greater proportion of the ChR2-expressing neurons were catecholaminergic in these toxin-treated rats than in the control rats (control vs. toxin, 66.9 ± 3.6 vs. 83.2 ± 5.2%, n= 19 and 7, P= 0.025). In the toxin-treated rats, only 16.8 ± 5.2% of the ChR2-expressing neurons transduced were non-catecholaminergic cells, and a majority of these cells were cholinergic neurons (12.6 ± 3.7% of the entire population) located in or near the nucleus ambiguus. These cholinergic neurons are likely to be visceral motor neurons and are therefore unlikely to have either direct or polysynaptic connections with pontine noradrenergic neurons.
The SSP–saporin is designed preferentially to destroy neurons that express the substance P receptor (i.e. neurokinin 1 receptor). Retrotrapezoid nucleus neurons express these receptors, which accounts for their vulnerability to this toxin (Takakura et al. 2008). C1 neurons are generally resistant to SSP–saporin (Gray et al. 2001; Guyenet et al. 2002), although a fraction of rostral C1 neurons are reported to contain substance P receptor immunoreactivity (Li et al. 2005). We observed a significant reduction in the number of ipsilateral TH-ir neurons close to the site of SSP–saporin injections compared with more caudal regions of the RVLM (ipsilateral TH-ir neurons between bregma levels −11.3 to −12.0 vs. −12.0 to −12.7 mm normalized to contralateral TH-ir neurons in the same coronal section, 65.3 ± 12.8 vs. 109.7 ± 9.6%, n= 6, P= 0.031; Fig. 2I). However, the total number of TH-ir neurons expressing ChR2 in the toxin-treated rats was not significantly different from that in control rats (respectively, 81 ± 8 vs. 61 ± 11 neurons counted per rat in a one-in-six series of sections, n= 19 and 7, P= 0.19). The ChR2-expressing C1 cells were on average located somewhat more caudal within the RVLM in the toxin-treated rats (compare panels H and I in Fig. 2).
In the toxin-treated rats, a majority of the LC neurons (16 of 24 neurons in three rats; 67%; Fig. 8A) and A5 neurons (five of six in four rats; 83%) were significantly activated by low-frequency stimulation of the RVLM (Fig. 8B). The proportion of activated cells was the same as in the control rats (Fisher's exact test, P= 0.63 for both LC and A5 neurons). Locus coeruleus neurons in toxin-treated rats had a slightly higher basal activity (2.0 ± 0.3 vs. 3.0 ± 0.5 Hz, n= 30 and 16, P < 0.001), but there was no difference in the probability of a light pulse evoking an action potential compared with the toxin-treated rats (control vs. toxin, 20 ms pulses, 23.4 ± 2.6 vs. 26.2 ± 4.6%, n= 30 and 7; and control vs. toxin, 50 ms pulses, 26.5 ± 5.2 vs. 36.5 ± 4.7%, n= 19 and 16, P= 0.19; Fig. 8B). The resting activity of A5 neurons was marginally but not significantly higher in toxin-treated rats (0.9 ± 0.2 vs. 1.8 ± 0.5 Hz, P= 0.068), and low-frequency photostimulation of the RVLM had the same probability of evoking an action potential in these neurons (20 ms, 26.3 ± 9.1 vs. 14.7 ± 3.8%, n= 4 and 5; and 50 ms, 33.1 ± 11.7 vs. 28.1 ± 10.2%, n= 11 and 5, P= 0.48; Fig. 8B). However, the sympathoexcitation evoked by low-frequency RVLM stimulation was attenuated, and in some cases absent, in the toxin-treated rats (P < 0.001 vs. control rats; Fig. 8C and D), consistent with the loss of the most rostral C1 neurons, which contribute the bulk of the innervation of the sympathetic preganglionic neurons (Tucker & Saper, 1985).
Figure 8. Destruction of the retrotrapezoid nucleus (RTN) with SSP–saporin does not reduce the activation of LC or A5 neurons produced by photostimulation of the RVLM.
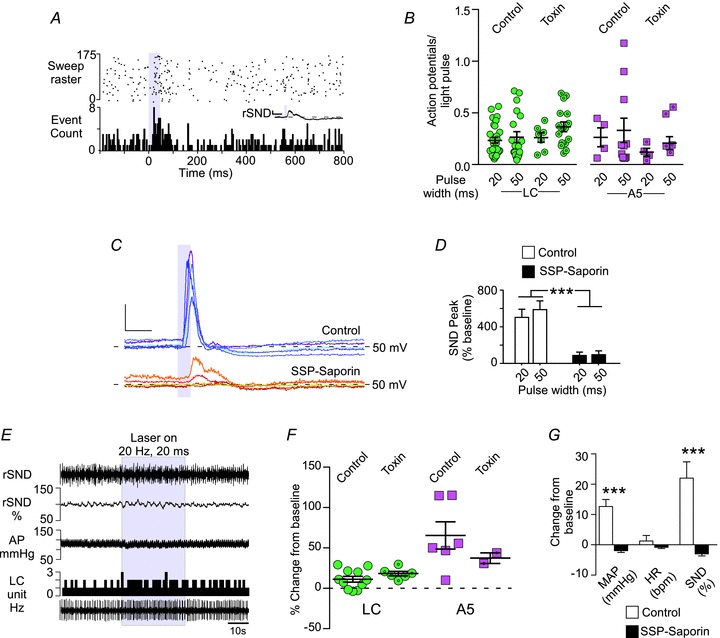
A, PSTH of a representative LC neuron, triggered by low-frequency stimulation (0.5 Hz, 50 ms) of the RVLM in a toxin-treated rat. Inset, waveform average of rSND during the trial. Calibration bar: x-axis, 0.2 s; y-axis, 100 mV. B, average action potentials to light-pulse ratio for LC and A5 neurons in control rats and toxin-treated rats. C, representative waveform averages of rSND during low-frequency photostimulation of the RVLM (50 ms pulse at <0.8 Hz) in control (n= 5, upper traces) and toxin-treated rats (n= 5, lower traces). Calibration bar: x-axis, 0.1 s; and y-axis, 100 mV. D, average evoked response produced by low-frequency stimulation in control and toxin-treated rats (n= 12 and 5, ***P < 0.001). E, representative example of an LC neuron (in herz, 1 s bins) activated by high-frequency (20 Hz, 20 ms pulse for 30 s) RVLM photostimulation in a toxin-treated rat. In toxin-treated rats, the effects of high-frequency photostimulation on arterial pressure (AP) and rSND were essentially eliminated. F, average increase in LC and A5 neuron activity produced by high-frequency RVLM photostimulation in control and toxin-treated rats. G, average cardiovascular effects produced by high-frequency RVLM photostimulation in control and toxin-treated rats (n= 6 and 6, ***P < 0.001).
High-frequency photostimulation of the RVLM (20 Hz) produced similar increases in the mean discharge rate of the LC and A5 neurons in toxin-treated and control rats (LC, P= 0.21, n= 11 and 6; and A5, P= 0.4, n= 6 and 2; Fig. 8E and F), whereas high-frequency stimulation of the RVLM did not increase SND or blood pressure in toxin-treated rats (MAP, 12.6 ± 2.3 vs. –1.9 ± 0.6 mmHg, n= 6 and 6, P= 0.0001; and SND, 22.0 ± 5.4 vs. –3.0 ± 0.7% of baseline, n= 6 and 6, P= 0.001; Fig. 8E and G). This result is consistent with the attenuation of the sympathetic response to low-frequency stimulation (Fig. 8C). Furthermore, this result suggests that activation of the LC and A5 neurons does not contribute significantly to the sympathoexcitation produced by photostimulation of RVLM in this study and that the rise in blood pressure caused by RVLM stimulation has no influence on the activation of pontine noaradrenaline neurons by transduced RVLM neurons.
Discussion
The present results show that C1 cell stimulation activates A5 and LC neurons and suggest that this excitatory influence could be mediated by a direct glutamatergic connection between the C1 cells and these pontine noradrenergic neurons. We also show that C1 neurons other than those that innervate the autonomic regions of the spinal cord are among the cells that are capable of increasing LC and A5 activity. These results suggest that, in addition to indirectly increasing catecholamine release in the periphery by activating the sympathetic nervous system, the C1 cells have the potential to increase CNS noradrenaline release throughout the brain by activating LC and A5 neurons.
Selectivity of the lentiviral vector and limitations of the optogenetic methodology
The PRSx8-based lentiviral vectors have previously been described as selective for catecholaminergic neurons (Card et al. 2006). In fact, the artificial promoter PRSx8 is activated by transcription factors Phox2 (a and/or b), which are also expressed in the RVLM by neurons other than the C1 cells (Hwang et al. 2001; Stornetta et al. 2006). Indeed, other reports have shown that the PRSx8 promoter drives transgene expression in cholinergic neurons in the brainstem (Lonergan et al. 2005; Duale et al. 2007). In our hands, ∼95% of ChR2-expressing neurons contain detectable levels of Phox2b (Abbott et al. 2009a,b), and in our experience the selectivity of the promoter for catecholaminergic neurons depends on the accuracy of virus injections, viral titer and incubation period. In this series of experiments, the transduced neurons consisted of a frank majority of catecholaminergic neurons, but they also included subsets of cholinergic neurons and non-catecholaminergic neurons presumed to belong to the RTN (Abbott et al. 2009a,b).
We classified the transduced catecholaminergic neurons as C1 rather than A1 neurons based on their location. Dual staining for PNMT and mCherry is not currently possible because the available antibodies to detect mCherry and PNMT by immunohistochemistry are both raised in rabbits; therefore, we could not distinguish between the C1 and A1 neurons in the RVLM. Almost all ChR2-expressing TH-ir neurons were located rostral to bregma level –13.5 mm, where virtually every TH-ir neuron contains the C1-defining enzyme, PNMT (Hökfelt et al. 1974; Stornetta et al. 1999; Phillips et al. 2001). In the toxin-treated group, a few A1 neurons may have been transduced. However, the fibre optic was inserted well rostral to the A1 region in all cases.
Our estimate of the number of transduced C1 neurons (a total of 470 neurons in the rats without saporin toxin injections) equates to ∼16% of the total bilateral C1 population, based on previous counts of PNMT-ir neurons in the RVLM (Stornetta et al. 1999). Furthermore, the number of transduced cells responding to light could be less than those expressing detectable mCherry-ir, considering the limited penetration of blue light within the brain (Yizhar et al. 2011) and the possibility that some cells have insufficient ChR2 expression to confer light sensitivity. These considerations could explain the relatively small changes in LC and A5 neuron activity elicited in our experiments and lead us to believe that the impact of C1 neurons on the activity of LC and A5 neurons could be much greater than what we observed.
Channelrhodopsin2-expressing C1 neurons make glutamatergic synapses with locus coeruleus neurons
The C1 neurons innervate the LC (Pieribone et al. 1988; Card et al. 2006), and the following evidence suggests that these C1 neurons release glutamate. The majority of the C1 neurons in the rat contain VGLUT2 mRNA (Stornetta et al. 2002). Phenylethanolamine N-methyltransferase-containing terminals form asymmetric synapses with LC neurons (Milner et al. 1989), and in this study we show that PNMT-containing boutons in the LC express VGLUT2. Furthermore, mCherry-ir varicosities form asymmetric synapses with LC neurons, and we consistently found detectable VGLUT2 immunoreactivity in mCherry-ir boutons within close proximity to LC neurons. Without evidence that the mCherry-ir terminals in LC contained both PNMT and VGLUT2, we fall short of demonstrating that the mCherry-ir terminals in the LC arise from C1 neurons. However, previous studies have demonstrated that RTN neurons do not innervate the LC (Bochorishvili et al. 2011), and it seems unlikely that cholinergic neurons express VGLUT2 and innervate the LC. Therefore, we conclude that C1 neurons form glutamatergic synapses with LC neurons.
The C1 neurons excite LC neurons
Electrical stimulation of the C1 region produces a stereotyped excitation–inhibition sequence in >80% of LC neurons, while 5–10% of these neurons exhibit purely inhibitory responses in the same circumstances (Aston-Jones et al. 1992; Ennis et al. 1992). According to these authors, the excitation is caused by glutamatergic RVLM neurons other than the C1 cells, and the subsequent inhibition is produced by catecholamines released by the C1 neurons. These studies predate evidence that the C1 neurons express VGLUT2 (Stornetta et al. 2002) and are subject to the limitation inherent to electrical stimulation, namely the activation of axons of passage (Histed et al. 2009). Here, we reproduced the previously described excitation–inhibition sequence in close to 60% of LC neurons by performing much more selective activation of the C1 neurons. The evoked excitation was undoubtedly less robust than that produced by electrical stimulation (Aston-Jones et al. 1992; Ennis et al. 1992). This difference could have several explanations. First, for reasons detailed above, we probably activated a small subset of the C1 neurons that innervate the LC, at most 16%. Second, the reticular formation is likely to contain other types of neurons that are capable of driving the LC, and these other neurons may have been recruited by electrical stimulation. Third, electrical stimulation could be predominantly activating axons of passage (Histed et al. 2009). In our hands, LC neurons were never inhibited by C1 cell stimulation without preceding excitation, and no LC inhibition was evoked after excitatory amino acid receptor blockade. Thus, we found no evidence that C1 neurons inhibit LC neurons and are led to propose the exact opposite, namely that the C1 neurons excite a substantial proportion of LC neurons.
The activation of LC neurons by stimulation of the C1 neurons is plausibly mediated monosynaptically via the release of glutamate. This interpretation is consistent with the neuroanatomical data described earlier and the fact that centrally administered kynurenic acid blocks the excitation of LC neurons. Furthermore, the latency of the response of LC neurons to RVLM stimulation, which could appear excessively long, is compatible with this possibility of a monosynaptic effect. The latency of antidromic action potentials evoked in putative C1 cells by stimulating their axons in the region of the LC is very long (16 ± 1 ms, with a range of 7–37 ms, 27 neurons; Huangfu et al. 1992). Moreover, there is a 3–10 ms delay between the onset of a light pulse and the first action potential elicited in a ChR2-transfected C1 neuron (Abbott et al. 2009b). Accordingly, we would expect the mean peak latency of activation of LC neurons measured from the onset of a light pulse to be about 24 ms if it was caused by a monosynaptic connection. This figure is close to what we observed (25 ms) when we used 20 ms light pulses. The longer peak latency following 50 ms pulses can be can be explained by the fact that the C1 cells respond to such long pulses by a burst of action potentials. In short, the observed latencies are compatible with the notion that a monosynaptic excitatory glutamatergic input from the C1 neurons is responsible for the LC activation. However, we acknowledge that the supporting evidence provided herein falls short of a proof because we have not ruled out the possibility that C1 neurons could excite LC by α1-adrenoreceptor activation or via a polysynaptic pathway and we have not ruled out that i.c.v. kynurenic acid interfered with the excitatory response of LC neurons merely by reducing their excitability.
The C1 neurons excite the A5 neurons
The C1 neurons arborize within the A5 region (Card et al. 2006). We provide the first evidence that C1 neurons excite these noradrenergic neurons, presumably also at least partly via monosynaptic connections.
The peak latency for the activation of A5 neurons was slightly longer than the latency observed in the LC neurons. This result could appear counterintuitive because the A5 neurons reside in the ventrolateral pons, i.e. closer to the ventrolateral medullary C1 neurons than the dorsally located LC. However, the assumption that the axonal trajectory is shorter between C1 and A5 than between C1 and LC lacks supporting evidence. The axons of the C1 neurons generally ascend through the dorsomedial tegmentum before bifurcating into secondary branches, and this bifurcating point is closer to the LC than to the A5 region (Astier et al. 1990; Schreihofer & Guyenet, 1997; Card et al. 2006); therefore, the total axonal trajectory between C1 and A5 neurons could even be longer than that between C1 and LC neurons.
The A5 neurons are activated by systemic and psychogenic stressors (Senba et al. 1993; Chan & Sawchenko, 1994; Carrive & Gorissen, 2008). These cells widely innervate the subcortical neuraxis (Byrum & Guyenet, 1987), notably the spinal cord, where they preferentially target the intermediolateral cell column (Bruinstroop et al. 2011). Activation of the A5 neurons produces organ-specific changes in sympathetic vasoconstrictor tone (Kanbar et al. 2011) and blood flow (Stanek et al. 1984) and has antinociceptive effects (Heinricher et al. 2009). Our evidence suggests that C1 cells are likely to contribute to the excitation of A5 neurons during hypotension, hypoxia, hypercapnia and painful visceral stimuli. The C1–A5 projection can therefore be viewed as a reinforcing loop for activation of the autonomic system by the C1 cells.
Why does activation of C1 neurons at 20 Hz produce such a small steady-state activation of LC and sympathetic preganglionic neurons?
Stimulation of C1 neurons produces strikingly similar effects on the activity of pontine noradrenergic neurons and sympathetic efferents. Specifically, continuous stimulation at 20 Hz produces a modest increase in LC steady-state unit discharge rate (∼10%) and SND (∼20%), whereas low-frequency photostimulation elicits a response severalfold greater than baseline. Channelrhodopsin2-expressing C1 neurons faithfully generate at least one action potential per light pulse throughout a 30 s, 20 Hz photostimulus (Abbott et al. 2009b). Thus, the attenuation of the postsynaptic response during high-frequency stimulation is not caused by the failure of the photostimulus to activate the C1 cells. Other explanations include a frequency-dependent reduction in presynaptic glutamate release, the corelease of other transmitters by C1 cells during high-frequency stimulation, the possibility that activation of the transduced C1 cells inhibits the discharge of the non-transduced C1 neurons via the baroreflex and, finally, the accommodation properties of the targeted neurons (LC or sympathetic preganglionic neurons). The last of these is a highly plausible explanation because both LC neurons and sympathetic preganglionic neurons have extremely long-lasting spike after-hyperpolarizations (Andrade & Aghajanian, 1984; Yoshimura et al. 1987). This after-hyperpolarization functions as a low-pass filter, reducing the efficacy of high-frequency excitatory inputs. In sympathetic preganglionic neurons, the after-hyperpolarization is regulated by neuromodulators such as noradrenaline (Inokuchi et al. 1992), a transmitter that should logically be released by the C1 neurons. Yet, C1 cell photostimulation had no detectable effect on LC activity following EAA blockade, suggesting that catecholamines are not the primary transmitter released in the LC or A5 following RVLM photostimulation. As kynurenic acid did not attenuate the sympathetic response elicited by light activation of the RVLM, we can be fairly certain that the loss of the LC response was not caused by a failure to photoactivate the C1 neurons following central EAA blockade. Conceivably, the release of catecholamines or other signalling molecules requires specific activation patterns of C1 cells that were not evaluated in this series of experiments. The corelease of glutamate and dopamine or acetylcholine has been documented in the nucleus accumbens and interpeduncular nucleus, respectively (Tecuapetla et al. 2010; Ren et al. 2011). Catecholamine release by the terminals of CNS noradrenergic neurons has also been demonstrated (Chiti & Teschemacher, 2007), but we are unaware of similar evidence regarding the C1 neurons (Dampney, 1994).
Do separate populations of C1 neurons innervate the spinal cord, LC and A5?
There is evidence for specialization among C1 neurons based on differential projections, expression of ancillary peptide transmitters and transporters, and differential reactivity to various stressors (Pilowsky & Goodchild, 2002; Guyenet, 2006; Stornetta, 2009). The present SSP–saporin experiments suggest that the LC and A5 receive input from C1 neurons that lack spinal projections. Whether these noradrenergic neurons also receive collaterals from bulbospinal C1 neurons is uncertain. Bulbospinal C1 neurons rarely innervate the hypothalamus (Verberne et al. 1999), but most have axon terminals within the dorsolateral pons and midbrain (Tucker et al. 1987; Haselton & Guyenet, 1990; Huangfu et al. 1992; Stornetta et al. 1999). In a previous study, bulbospinal putative C1 neurons were not found to arborize within the LC (Huangfu et al. 1992), but this evidence is based on nine bulbospinal, barosensitive RVLM neurons with unknown phenotype and should not be viewed as definitive.
The C1 neurons and responses to acute stresses
The C1 neurons have been described as central command neurons of the peripheral sympathetic system responsible for generalized sympathetic responses to stress (Jansen et al. 1995). The present results suggest that the C1 cells are also capable of influencing the entire neuraxis by facilitating the release of noradrenaline from pontine noradrenergic cell groups. We show that C1 neurons are especially effective at synchronizing the activity of LC, A5 and SND. Phasic synchronous activation of the LC is essential for optimization of behaviour (Aston-Jones & Cohen, 2005). Likewise, synchronous intermittent discharge of sympathetic ganglionic neurons is thought to facilitate cardiovascular performance (Malpas, 1998). The discharges of the C1 neurons are themselves synchronized by numerous rhythmic inputs, notably from arterial baroreceptors (Guyenet, 2006). Our evidence supports the notion that the firing pattern of the C1 neurons, especially the synchronization between the discharges of subgroups of C1 neurons, is important to activate efferent targets, such as the LC and the peripheral sympathetic nervous system (Gebber et al. 1990). Likewise, the pattern of C1 activation by systemic and psychological stressors may also be essential to elicit appropriate behavioural and autonomic responses through frequency-dependent activation of LC and A5 neurons.
Conclusions
We propose that, contrary to previous belief, the C1 neurons have a predominantly excitatory influence on LC and A5 neuron activity consistent with their excitatory effects in the spinal cord and the hypothalamic paraventricular nucleus. Our evidence suggests that the excitatory influence of the C1 neurons on LC and A5 neurons may be mediated by a monosynaptic glutamatergic input to these neurons.
The C1 neurons are likely to excite other noradrenergic cell groups besides LC and A5 because virtually every noradrenergic cluster is targeted by the terminals of C1 neurons (Card et al. 2006). The C1 neurons contribute to sympathetic responses and to the activation of the hypothalamic–pituitary–adrenal axis when rats are challenged by somatic stresses, such as hypotension, acute hypoxia, pain, hypoglycaemia and infection (Li et al. 1996; Madden & Sved, 2003; Guyenet, 2006; Madden et al. 2006; Schiltz & Sawchenko, 2007). These effects are likely to be facilitated by the recruitment of the LC, which may also foster arousal, and by the activation of the A5 neurons, which further enhances the sympathetic outflow, presumably by releasing noradrenaline in the spinal cord. In particular, the C1 neurons are strongly activated by acute hypoxia (Sun & Reis, 1994). Activation of CNS noradrenergic neurons may be particularly beneficial in conditions such as hypoxia and hypotension, given that brain noradrenaline increases CNS glycogenolysis (Ingvar et al. 1983; Hertz et al. 2010). The excitatory input from the C1 neurons to the locus coeruleus could also facilitate arousal during acute hypoxia and could therefore contribute to the sleep disruption associated with obstructive sleep apnoea.
Acknowledgments
This work is supported by grant HL028785 from the National Institutes of Health to P.G.G. S.B.A. is supported by a fellowship from the American Heart Association (11post7170001). R.K. was supported by a fellowship from the French Society of Hypertension.
Glossary
- ChAT
choline acetyltransferase
- ChR2
humanized enhanced channelrhodopsin2 (H134R)
- EAA
excitatory amino acid
- ir
immunoreactive
- LC
locus coeruleus
- PNMT
phenylethanolamine N-methyltransferase
- PSTH
peristimulus triggered histogram
- RTN
retrotrapezoid nucleus
- RVLM
rostral ventrolateral medulla
- r/sSND
renal/splanchnic sympathetic nerve discharge
- SSP
substance P analogue
- TH
tyrosine hydroxylase
- VGLUT2
vesicular glutamate transporter type 2
- WPRE
woodchuck hepatitis virus post-transcriptional regulatory element
Author contributions
S.B.A., R.K., R.L.S. and P.G.G. conceived and designed the experiments. All authors shared in the collection, analysis and interpretation of the data. S.B.A., R.L.S. and P.G.G. contributed to drafting and revising the article. All experiments were performed at the University of Virginia.
References
- Abbott SB, Stornetta RL, Fortuna MG, Depuy SD, West GH, Harris TE, Guyenet PG. Photostimulation of retrotrapezoid nucleus phox2b-expressing neurons in vivo produces long-lasting activation of breathing in rats. J Neurosci. 2009a;29:5806–5819. doi: 10.1523/JNEUROSCI.1106-09.2009. [DOI] [PMC free article] [PubMed] [Google Scholar]
- Abbott SB, Stornetta RL, Socolovsky CS, West GH, Guyenet PG. Photostimulation of channelrhodopsin-2 expressing ventrolateral medullary neurons increases sympathetic nerve activity and blood pressure in rats. J Physiol. 2009b;587:5613–5631. doi: 10.1113/jphysiol.2009.177535. [DOI] [PMC free article] [PubMed] [Google Scholar]
- Andrade R, Aghajanian GK. Single cell activity in the noradrenergic A-5 region: responses to drugs and peripheral manipulations of blood pressure. Brain Res. 1982;242:125–135. doi: 10.1016/0006-8993(82)90502-9. [DOI] [PubMed] [Google Scholar]
- Andrade R, Aghajanian GK. Locus coeruleus activity in vitro: intrinsic regulation by a calcium-dependent potassium conductance but not α2-adrenoceptors. J Neurosci. 1984;4:161–170. doi: 10.1523/JNEUROSCI.04-01-00161.1984. [DOI] [PMC free article] [PubMed] [Google Scholar]
- Astier B, Vanbockstaele EJ, Aston-Jones G, Pieribone VA. Anatomical evidence for multiple pathways leading from the rostral ventrolateral medulla (nucleus paragigantocellularis) to the locus-coeruleus in rat. Neurosci Lett. 1990;118:141–146. doi: 10.1016/0304-3940(90)90612-d. [DOI] [PubMed] [Google Scholar]
- Aston-Jones G, Astier B, Ennis M. Inhibition of noradrenergic locus coeruleus neurons by C1 adrenergic cells in the rostral ventral medulla. Neurosci. 1992;48:371–382. doi: 10.1016/0306-4522(92)90497-p. [DOI] [PubMed] [Google Scholar]
- Aston-Jones G, Cohen JD. An integrative theory of locus coeruleus-norepinephrine function: adaptive gain and optimal performance. Annu Rev Neurosci. 2005;28:403–450. doi: 10.1146/annurev.neuro.28.061604.135709. [DOI] [PubMed] [Google Scholar]
- Aston-Jones G, Ennis M, Pieribone VA, Nickell WT, Shipley MT. The brain nucleus locus coeruleus: restricted afferent control of a broad efferent network. Science. 1986;234:734–737. doi: 10.1126/science.3775363. [DOI] [PubMed] [Google Scholar]
- Berthon-Jones M, Sullivan CE. Ventilation and arousal responses to hypercapnia in normal sleeping humans. J Appl Physiol. 1984;57:59–67. doi: 10.1152/jappl.1984.57.1.59. [DOI] [PubMed] [Google Scholar]
- Bochorishvili G, Stornetta RL, Coates MB, Guyenet PG. Pre-Bötzinger complex receives glutamatergic innervation from galaninergic and other retrotrapezoid nucleus neurons. J Comp Neurol. 2011;520:1047–1061. doi: 10.1002/cne.22769. [DOI] [PMC free article] [PubMed] [Google Scholar]
- Bowes G, Townsend ER, Kozar LF, Bromley SM, Phillipson EA. Effect of carotid body denervation on arousal response to hypoxia in sleeping dogs. J Appl Physiol. 1981;51:40–45. doi: 10.1152/jappl.1981.51.1.40. [DOI] [PubMed] [Google Scholar]
- Brown DL, Guyenet PG. Electrophysiological study of cardiovascular neurons in the rostral ventrolateral medulla in rats. Circ Res. 1985;56:359–369. doi: 10.1161/01.res.56.3.359. [DOI] [PubMed] [Google Scholar]
- Bruinstroop E, Cano G, VanderHorst VG, Cavalcante JC, Wirth J, Sena-Esteves M, Saper CB. Spinal projections of the A5, A6 (locus coeruleus), and A7 noradrenergic cell groups in rats. J Comp Neurol. 2012;520:1985–2001. doi: 10.1002/cne.23024. [DOI] [PMC free article] [PubMed] [Google Scholar]
- Byrum CE, Guyenet PG. Afferent and efferent connections of the A5 noradrenergic cell group in the rat. J Comp Neurol. 1987;261:529–542. doi: 10.1002/cne.902610406. [DOI] [PubMed] [Google Scholar]
- Card JP, Lois J, Sved AF. Distribution and phenotype of Phox2a-containing neurons in the adult sprague-dawley rat. J Comp Neurol. 2010;518:2202–2220. doi: 10.1002/cne.22327. [DOI] [PubMed] [Google Scholar]
- Card JP, Sved JC, Craig B, Raizada M, Vazquez J, Sved AF. Efferent projections of rat rostroventrolateral medulla C1 catecholamine neurons: implications for the central control of cardiovascular regulation. J Comp Neurol. 2006;499:840–859. doi: 10.1002/cne.21140. [DOI] [PubMed] [Google Scholar]
- Carrive P, Gorissen M. Premotor sympathetic neurons of conditioned fear in the rat. Eur J Neurosci. 2008;28:428–446. doi: 10.1111/j.1460-9568.2008.06351.x. [DOI] [PubMed] [Google Scholar]
- Cedarbaum JM, Aghajanian GK. Noradrenergic neurons of the locus coeruleus: inhibition by epinephrine and activation by the α-antagonist piperoxane. Brain Res. 1976;112:413–419. doi: 10.1016/0006-8993(76)90297-3. [DOI] [PubMed] [Google Scholar]
- Chan RKW, Sawchenko PE. Spatially and temporally differentiated patterns of c-fos expression in the brainstem catecholaminergic cell groups induced by cardiovascular challenges in the rat. J Comp Neurol. 1994;348:433–460. doi: 10.1002/cne.903480309. [DOI] [PubMed] [Google Scholar]
- Chiti Z, Teschemacher AG. Exocytosis of norepinephrine at axon varicosities and neuronal cell bodies in the rat brain. FASEB J. 2007;21:2540–2550. doi: 10.1096/fj.06-7342com. [DOI] [PubMed] [Google Scholar]
- Dampney RAL. The subretrofacial vasomotor nucleus: anatomical, chemical and pharmacological properties and role in cardiovascular regulation. Prog Neurobiol. 1994;42:197–227. doi: 10.1016/0301-0082(94)90064-7. [DOI] [PubMed] [Google Scholar]
- Drummond GB. Reporting ethical matters in The Journal of Physiology: standards and advice. J Physiol. 2009;587:713–719. doi: 10.1113/jphysiol.2008.167387. [DOI] [PMC free article] [PubMed] [Google Scholar]
- Duale H, Waki H, Howorth P, Kasparov S, Teschemacher AG, Paton JF. Restraining influence of A2 neurons in chronic control of arterial pressure in spontaneously hypertensive rats. Cardiovasc Res. 2007;76:184–193. doi: 10.1016/j.cardiores.2007.06.018. [DOI] [PubMed] [Google Scholar]
- Ennis M, Aston-Jones G, Shiekhattar R. Activation of locus coeruleus neurons by nucleus paragigantocellularis or noxious sensory stimulation is mediated by intracoerulear excitatory amino acid neurotransmission. Brain Res. 1992;598:185–195. doi: 10.1016/0006-8993(92)90182-9. [DOI] [PubMed] [Google Scholar]
- Gebber GL, Barman SM, Kocsis B. Coherence of medullary unit activity and sympathetic nerve discharge. Am J Physiol. 1990;259:R561–R571. doi: 10.1152/ajpregu.1990.259.3.R561. [DOI] [PubMed] [Google Scholar]
- Gray PA, Janczewski WA, Mellen N, McCrimmon DR, Feldman JL. Normal breathing requires preBötzinger complex neurokinin-1 receptor-expressing neurons. Nat Neurosci. 2001;4:927–930. doi: 10.1038/nn0901-927. [DOI] [PMC free article] [PubMed] [Google Scholar]
- Guo ZL, Lai HC, Longhurst JC. Medullary pathways involved in cardiac sympathoexcitatory reflexes in the cat. Brain Res. 2002;925:55–66. doi: 10.1016/s0006-8993(01)03259-0. [DOI] [PubMed] [Google Scholar]
- Guyenet PG. The sympathetic control of blood pressure. Nat Rev Neurosci. 2006;7:335–346. doi: 10.1038/nrn1902. [DOI] [PubMed] [Google Scholar]
- Guyenet PG, Mulkey DK, Stornetta RL, Bayliss DA. Regulation of ventral surface chemoreceptors by the central respiratory pattern generator. J Neurosci. 2005;25:8938–8947. doi: 10.1523/JNEUROSCI.2415-05.2005. [DOI] [PMC free article] [PubMed] [Google Scholar]
- Guyenet PG, Sevigny CP, Weston MC, Stornetta RL. Neurokinin-1 receptor-expressing cells of the ventral respiratory group are functionally heterogeneous and predominantly glutamatergic. J Neurosci. 2002;22:3806–3816. doi: 10.1523/JNEUROSCI.22-09-03806.2002. [DOI] [PMC free article] [PubMed] [Google Scholar]
- Haselton JR, Guyenet PG. Ascending collaterals of medullary barosensitive neurons and C1 cells in rats. Am J Physiol Regul Integr Comp Physiol. 1990;258:R1051–R1063. doi: 10.1152/ajpregu.1990.258.4.R1051. [DOI] [PubMed] [Google Scholar]
- Heinricher MM, Tavares I, Leith JL, Lumb BM. Descending control of nociception: specificity, recruitment and plasticity. Brain Res Rev. 2009;60:214–225. doi: 10.1016/j.brainresrev.2008.12.009. [DOI] [PMC free article] [PubMed] [Google Scholar]
- Hertz L, Lovatt D, Goldman SA, Nedergaard M. Adrenoceptors in brain: cellular gene expression and effects on astrocytic metabolism and [Ca2+]i. Neurochem Int. 2010;57:411–420. doi: 10.1016/j.neuint.2010.03.019. [DOI] [PMC free article] [PubMed] [Google Scholar]
- Hirooka Y, Polson JW, Potts PD, Dampney RAL. Hypoxia-induced Fos expression in neurons projecting to the pressor region in the rostral ventrolateral medulla. Neurosci. 1997;80:1209–1224. doi: 10.1016/s0306-4522(97)00111-5. [DOI] [PubMed] [Google Scholar]
- Histed MH, Bonin V, Reid RC. Direct activation of sparse, distributed populations of cortical neurons by electrical microstimulation. Neuron. 2009;63:508–522. doi: 10.1016/j.neuron.2009.07.016. [DOI] [PMC free article] [PubMed] [Google Scholar]
- Hökfelt T, Fuxe K, Goldstein M, Johansson O. Immunohistochemical evidence for the existence of adrenaline neurons in the rat brain. Brain Res. 1974;66:235–251. [Google Scholar]
- Huangfu D, Verberne AJM, Guyenet PG. Rostral ventrolateral medullary neurons projecting to locus coeruleus have cardiorespiratory inputs. Brain Res. 1992;598:67–75. doi: 10.1016/0006-8993(92)90169-a. [DOI] [PubMed] [Google Scholar]
- Hwang DY, Carlezon WA, Jr, Isacson O, Kim KS. A high-efficiency synthetic promoter that drives transgene expression selectively in noradrenergic neurons. Hum Gene Ther. 2001;12:1731–1740. doi: 10.1089/104303401750476230. [DOI] [PubMed] [Google Scholar]
- Ingvar M, Lindvall O, Folbergrová J, Siesjö BK. Influence of lesions of the noradrenergic locus coeruleus system on the cerebral metabolic response to bicuculline-induced seizures. Brain Res. 1983;264:225–231. doi: 10.1016/0006-8993(83)90820-x. [DOI] [PubMed] [Google Scholar]
- Inokuchi H, Yoshimura M, Polosa C, Nishi S. Adrenergic receptors (alpha 1 and alpha 2) modulate different potassium conductances in sympathetic preganglionic neurons. Can J Physiol Pharmacol. 1992;70(Suppl):S92–S97. doi: 10.1139/y92-249. [DOI] [PubMed] [Google Scholar]
- Jansen ASP, Nguyen XV, Karpitskiy V, Mettenleiter TC, Loewy AD. Central command neurons of the sympathetic nervous system: basis of the fight-or flight response. Science. 1995;270:644–646. doi: 10.1126/science.270.5236.644. [DOI] [PubMed] [Google Scholar]
- Kanbar R, Depuy SD, West GH, Stornetta RL, Guyenet PG. Regulation of visceral sympathetic tone by A5 noradrenergic neurons in rodents. J Physiol. 2011;589:903–917. doi: 10.1113/jphysiol.2010.198374. [DOI] [PMC free article] [PubMed] [Google Scholar]
- Kang BJ, Chang DA, Mackay DD, West GH, Moreira TS, Takakura AC, Gwilt JM, Guyenet PG, Stornetta RL. Central nervous system distribution of the transcription factor Phox2b in the adult rat. J Comp Neurol. 2007;503:627–641. doi: 10.1002/cne.21409. [DOI] [PubMed] [Google Scholar]
- Li HY, Ericsson A, Sawchenko PE. Distinct mechanisms underlie activation of hypothalamic neurosecretory neurons and their medullary catecholaminergic afferents in categorically different stress paradigms. Proc Natl Acad Sci USA. 1996;93:2359–2364. doi: 10.1073/pnas.93.6.2359. [DOI] [PMC free article] [PubMed] [Google Scholar]
- Li Q, Goodchild AK, Seyedabadi M, Pilowsky PM. Pre-protachykinin A mRNA is colocalized with tyrosine hydroxylase-immunoreactivity in bulbospinal neurons. Neurosci. 2005;136:205–216. doi: 10.1016/j.neuroscience.2005.07.057. [DOI] [PubMed] [Google Scholar]
- Lonergan T, Teschemacher AG, Hwang DY, Kim KS, Pickering AE, Kasparov S. Targeting brain stem centers of cardiovascular control using adenoviral vectors: impact of promoters on transgene expression. Physiol Genomics. 2005;20:165–172. doi: 10.1152/physiolgenomics.00120.2004. [DOI] [PubMed] [Google Scholar]
- Madden CJ, Stocker SD, Sved AF. Attenuation of homeostatic responses to hypotension and glucoprivation after destruction of catecholaminergic rostral ventrolateral medulla (RVLM) neurons. Am J Physiol Regul Integr Comp Physiol. 2006;291:R751–R759. doi: 10.1152/ajpregu.00800.2005. [DOI] [PubMed] [Google Scholar]
- Madden CJ, Sved AF. Cardiovascular regulation after destruction of the C1 cell group of the rostral ventrolateral medulla in rats. Am J Physiol Heart Circ Physiol. 2003;285:H2734–H2748. doi: 10.1152/ajpheart.00155.2003. [DOI] [PubMed] [Google Scholar]
- Malpas SC. The rhythmicity of sympathetic nerve activity. Prog Neurobiol. 1998;56:65–96. doi: 10.1016/s0301-0082(98)00030-6. [DOI] [PubMed] [Google Scholar]
- Marina N, Abdala AP, Korsak A, Simms AE, Allen AM, Paton JF, Gourine AV. Control of sympathetic vasomotor tone by catecholaminergic C1 neurones of the rostral ventrolateral medulla oblongata. Cardiovasc Res. 2011;91:703–710. doi: 10.1093/cvr/cvr128. [DOI] [PMC free article] [PubMed] [Google Scholar]
- Marshall JM. Peripheral chemoreceptors and cardiovascular regulation. Physiol Rev. 1994;74:543–594. doi: 10.1152/physrev.1994.74.3.543. [DOI] [PubMed] [Google Scholar]
- Milner TA, Abate C, Reis DJ, Pickel VM. Ultrastructural localization of phenylethanolamine N- methyltransferase-like immunoreactivity in the rat locus coeruleus. Brain Res. 1989;478:1–15. doi: 10.1016/0006-8993(89)91471-6. [DOI] [PubMed] [Google Scholar]
- Milner TA, Morrison SF, Abate C, Reis DJ. Phenylethanolamine N-methyltransferase-containing terminals synapse directly on sympathetic preganglionic neurons in the rat. Brain Res. 1988;448:205–222. doi: 10.1016/0006-8993(88)91258-9. [DOI] [PubMed] [Google Scholar]
- Moreira TS, Takakura AC, Colombari E, Guyenet PG. Central chemoreceptors and sympathetic vasomotor outflow. J Physiol. 2006;577:369–386. doi: 10.1113/jphysiol.2006.115600. [DOI] [PMC free article] [PubMed] [Google Scholar]
- Morrison SF, Reis DJ. Reticulospinal vasomotor neurons in the RVL mediate the somatosympathetic reflex. Am J Physiol Regul Integr Comp Physiol. 1989;256:R1084–R1097. doi: 10.1152/ajpregu.1989.256.5.R1084. [DOI] [PubMed] [Google Scholar]
- Mulkey DK, Stornetta RL, Weston MC, Simmons JR, Parker A, Bayliss DA, Guyenet PG. Respiratory control by ventral surface chemoreceptor neurons in rats. Nat Neurosci. 2004;7:1360–1369. doi: 10.1038/nn1357. [DOI] [PubMed] [Google Scholar]
- Pappenheimer JR. Sleep and respiration of rats during hypoxia. J Physiol. 1977;266:191–207. doi: 10.1113/jphysiol.1977.sp011763. [DOI] [PMC free article] [PubMed] [Google Scholar]
- Phillips JK, Goodchild AK, Dubey R, Sesiashvili E, Takeda M, Chalmers J, Pilowsky PM, Lipski J. Differential expression of catecholamine biosynthetic enzymes in the rat ventrolateral medulla. J Comp Neurol. 2001;432:20–34. doi: 10.1002/cne.1086. [DOI] [PubMed] [Google Scholar]
- Pieribone VA, Aston-Jones G, Bohn MC. Adrenergic and non-adrenergic neurons in the C1 and C3 areas project to locus coeruleus: a fluorescent double labeling study. Neurosci Lett. 1988;85:297–303. doi: 10.1016/0304-3940(88)90582-4. [DOI] [PubMed] [Google Scholar]
- Pilowsky PM, Goodchild AK. Baroreceptor reflex pathways and neurotransmitters: 10 years on. J Hypertens. 2002;20:1675–1688. doi: 10.1097/00004872-200209000-00002. [DOI] [PubMed] [Google Scholar]
- Ren J, Qin C, Hu F, Tan J, Qiu L, Zhao S, Feng G, Luo M. Habenula “cholinergic” neurons co-release glutamate and acetylcholine and activate postsynaptic neurons via distinct transmission modes. Neuron. 2011;69:445–452. doi: 10.1016/j.neuron.2010.12.038. [DOI] [PubMed] [Google Scholar]
- Ross CA, Ruggiero DA, Park DH, Joh TH, Sved AF, Fernandez-Pardal J, Saavedra JM, Reis DJ. Tonic vasomotor control by the rostral ventrolateral medulla: effect of electrical or chemical stimulation of the area containing C1 adrenaline neurons on arterial pressure, heart rate, and plasma catecholamines and vasopressin. J Neurosci. 1984;4:474–494. doi: 10.1523/JNEUROSCI.04-02-00474.1984. [DOI] [PMC free article] [PubMed] [Google Scholar]
- Sawchenko PE, Li HY, Ericsson A. Circuits and mechanisms governing hypothalamic responses to stress: a tale of two paradigms. Prog Brain Res. 2000;122:61–78. doi: 10.1016/s0079-6123(08)62131-7. [DOI] [PubMed] [Google Scholar]
- Schiltz JC, Sawchenko PE. Specificity and generality of the involvement of catecholaminergic afferents in hypothalamic responses to immune insults. J Comp Neurol. 2007;502:455–467. doi: 10.1002/cne.21329. [DOI] [PubMed] [Google Scholar]
- Schreihofer AM, Guyenet PG. Identification of C1 presympathetic neurons in rat rostral ventrolateral medulla by juxtacellular labeling in vivo. J Comp Neurol. 1997;387:524–536. doi: 10.1002/(sici)1096-9861(19971103)387:4<524::aid-cne4>3.0.co;2-4. [DOI] [PubMed] [Google Scholar]
- Senba E, Matsunaga K, Tohyama M, Noguchi K. Stress-induced c-fos expression in the rat brain: activation mechanism of sympathetic pathway. Brain Res Bull. 1993;31:329–344. doi: 10.1016/0361-9230(93)90225-z. [DOI] [PubMed] [Google Scholar]
- Stanek KA, Neil JJ, Sawyer WB, Loewy AD. Changes in regional blood flow and cardiac output after L-glutamate stimulation of A5 cell group. Am J Physiol Heart Circ Physiol. 1984;246:H44–H51. doi: 10.1152/ajpheart.1984.246.1.H44. [DOI] [PubMed] [Google Scholar]
- Stornetta RL. Neurochemistry of bulbospinal presympathetic neurons of the medulla oblongata. J Chem Neuroanat. 2009;38:222–230. doi: 10.1016/j.jchemneu.2009.07.005. [DOI] [PMC free article] [PubMed] [Google Scholar]
- Stornetta RL, Akey PJ, Guyenet PG. Location and electrophysiological characterization of rostral medullary adrenergic neurons that contain neuropeptide Y mRNA in rat. J Comp Neurol. 1999;415:482–500. doi: 10.1002/(sici)1096-9861(19991227)415:4<482::aid-cne5>3.0.co;2-4. [DOI] [PubMed] [Google Scholar]
- Stornetta RL, Moreira TS, Takakura AC, Kang BJ, Chang DA, West GH, Brunet JF, Mulkey DK, Bayliss DA, Guyenet PG. Expression of Phox2b by brainstem neurons involved in chemosensory integration in the adult rat. J Neurosci. 2006;26:10305–10314. doi: 10.1523/JNEUROSCI.2917-06.2006. [DOI] [PMC free article] [PubMed] [Google Scholar]
- Stornetta RL, Sevigny CP, Guyenet PG. Vesicular glutamate transporter DNPI/VGLUT2 mRNA is present in C1 and several other groups of brainstem catecholaminergic neurons. J Comp Neurol. 2002;444:191–206. doi: 10.1002/cne.10141. [DOI] [PubMed] [Google Scholar]
- Sun MK, Hackett JT, Guyenet PG. Sympathoexcitatory neurons of rostral ventrolateral medulla exhibit pacemaker properties in the presence of a glutamate-receptor antagonist. Brain Res. 1988;438:23–40. doi: 10.1016/0006-8993(88)91320-0. [DOI] [PubMed] [Google Scholar]
- Sun MK, Reis DJ. Central neural mechanisms mediating excitation of sympathetic neurons by hypoxia. Prog Neurobiol. 1994;44:197–219. doi: 10.1016/0301-0082(94)90038-8. [DOI] [PubMed] [Google Scholar]
- Sun MK, Reis DJ. Excitatory amino acid-mediated chemoreflex excitation of respiratory neurones in rostral ventrolateral medulla in rats. J Physiol. 1996;492:559–571. doi: 10.1113/jphysiol.1996.sp021329. [DOI] [PMC free article] [PubMed] [Google Scholar]
- Takakura AC, Moreira TS, Stornetta RL, West GH, Gwilt JM, Guyenet PG. Selective lesion of retrotrapezoid Phox2b-expressing neurons raises the apnoeic threshold in rats. J Physiol. 2008;586:2975–2991. doi: 10.1113/jphysiol.2008.153163. [DOI] [PMC free article] [PubMed] [Google Scholar]
- Tecuapetla F, Patel JC, Xenias H, English D, Tadros I, Shah F, Berlin J, Deisseroth K, Rice ME, Tepper JM, Koos T. Glutamatergic signaling by mesolimbic dopamine neurons in the nucleus accumbens. J Neurosci. 2010;30:7105–7110. doi: 10.1523/JNEUROSCI.0265-10.2010. [DOI] [PMC free article] [PubMed] [Google Scholar]
- Tucker DC, Saper CB. Specificity of spinal projections from hypothalamic and brainstem areas which innervate sympathetic preganglionic neurons. Brain Res. 1985;360:159–164. doi: 10.1016/0006-8993(85)91231-4. [DOI] [PubMed] [Google Scholar]
- Tucker DC, Saper CB, Ruggiero DA, Reis DJ. Organization of central adrenergic pathways: I. Relationships of ventrolateral medullary projections to the hypothalamus and spinal cord. J Comp Neurol. 1987;259:591–603. doi: 10.1002/cne.902590408. [DOI] [PubMed] [Google Scholar]
- Verberne AJM, Stornetta RL, Guyenet PG. Properties of C1 and other ventrolateral medullary neurones with hypothalamic projections in the rat. J Physiol. 1999;517:477–494. doi: 10.1111/j.1469-7793.1999.0477t.x. [DOI] [PMC free article] [PubMed] [Google Scholar]
- Yizhar O, Fenno LE, Davidson TJ, Mogri M, Deisseroth K. Optogenetics in neural systems. Neuron. 2011;71:9–34. doi: 10.1016/j.neuron.2011.06.004. [DOI] [PubMed] [Google Scholar]
- Yoshimura M, Polosa C, Nishi S. Noradrenaline-induced afterdepolarization in cat sympathetic preganglionic neurons in vitro. J Neurophys. 1987;57:1314–1324. doi: 10.1152/jn.1987.57.5.1314. [DOI] [PubMed] [Google Scholar]