

Abstract
Intestinal enteroendocrine cells (IECs) secrete gut peptides in response to both nutrients and non-nutrients. Glucose and amino acids both stimulate gut peptide secretion. Our hypothesis was that the facilitative glucose transporter, GLUT2, could act as a glucose sensor and the calcium-sensing receptor, CasR, could detect amino acids in the intestine to modify gut peptide secretion. We used isolated loops of rat small intestine to study the secretion of gluco-insulinotropic peptide (GIP), glucagon-like peptide-1 (GLP-1) and peptide tyrosine tyrosine (PYY) secretion stimulated by luminal perfusion of nutrients or bile acid. Inhibition of the sodium-dependent glucose cotransporter 1 (SGLT1) with phloridzin partially inhibited GIP, GLP-1 and PYY secretion by 45%, suggesting another glucose sensor might be involved in modulating peptide secretion. The response was completely abolished in the presence of the GLUT2 inhibitors phloretin or cytochalasin B. Given that GLUT2 modified gut peptide secretion stimulated by glucose, we investigated whether it was involved in the secretion of gut peptide by other gut peptide secretagogues. Phloretin completely abolished gut peptide secretion stimulated by artificial sweetener (sucralose), dipeptide (glycylsarcosine), lipid (oleoylethanolamine), short chain fatty acid (propionate) and major rat bile acid (taurocholate) indicating a fundamental position for GLUT2 in the gut peptide secretory mechanism. We investigated how GLUT2 was able to influence gut peptide secretion mediated by a diverse range of stimulators and discovered that GLUT2 affected membrane depolarisation through the closure of K+ATP-sensitive channels. In the absence of SGLT1 activity (or presence of phloridzin), the secretion of GIP, GLP-1 and PYY was sensitive to K+ATP-sensitive channel modulators tolbutamide and diazoxide. l-Amino acids phenylalanine (Phe), tryptophan (Trp), asparagine (Asn), arginine (Arg) and glutamine (Gln) also stimulated GIP, GLP-1 and PYY secretion, which was completely abolished when extracellular Ca2+ was absent. The gut peptide response stimulated by the amino acids was also blocked by the CasR inhibitor Calhex 231 and augmented by the CasR agonist NPS-R568. GLUT2 and CasR regulate K- and L-cell activity in response to nutrient and non-nutrient stimuli.
Key points
In intestine, nutrients including glucose and amino acids and non-nutrients including bile acids increase secretion of anti-diabetic gut peptides such as gluco-insulinotropic peptide (GIP), glucagon-like peptide-1 (GLP-1) and peptide tyrosine tyrosine (PYY).
Facilitative glucose transporter pathways in addition to active electrogenic transporter pathways contribute to GIP, GLP-1 and PYY secretion; in particular, the facilitative glucose transporter 2 (GLUT2) is involved.
Sucralose, in the presence of glucose, can strongly and acutely upregulate GIP, GLP-1 and PYY secretion in a time scale of minutes.
Amino acid-stimulated GIP, GLP-1 and PYY secretion is acutely regulated by the calcium-sensing receptor (CasR).
The results establish new functions for GLUT2 and CasR as regulators of gut peptide secretion that sense nutrients and provide signalling pathways for the release of GIP, GLP-1 and PYY.
Introduction
The gut releases hormones to initiate activities throughout the body that control gut motility, nutrient absorption and disposal, and satiety in response to the arrival of food. The gut hormone gluco-insulinotropic peptide (GIP) is secreted from intestinal enteroendocrine (IEC) K-cells and the gut hormones glucagon-like peptide-1 (GLP-1) and peptide tyrosine tyrosine (PYY) are secreted from IEC L-cells. Both IECs are distributed throughout the gastrointestinal tract and are targets for anti-diabetic therapies since GIP and GLP-1 directly stimulate insulin secretion. The secretion of these peptides has been extensively investigated and the current model of IEC sensing involves both raised intracellular Ca2+ and cAMP (Reimann et al. 2008; Tolhurst et al. 2009; Parker et al. 2010); the former through either electrogenic transport to directly depolarise the membrane and open voltage-gated Ca2+ channels or activation of Gq protein-coupled receptors, and the latter through Gs protein-coupled receptors.
Luminal nutrients including glucose and l-amino acids trigger GIP, GLP-1 and PYY secretion. It is well established that glucose can regulate GLP-1 secretion through electrogenic Na+-coupled uptake via SGLT1. Sweet taste receptors, Tas1R2+Tas1R3, have also been demonstrated to regulate GLP-1 secretion which was impaired in mice lacking the coupling G protein Gαgustducin (Margolskee et al. 2007). Another glucose transporter, GLUT2, which has a well-established glucose-sensing role mediating insulin secretion from the pancreatic β-cell, also resides in the apical membrane of intestine. When rat small intestine is exposed to increasing glucose concentrations, the density and intrinsic activity of GLUT2 residing at the apical membrane transiently increases (Kellett & Helliwell, 2000) to accommodate the increased absorptive capacity required to meet increased glucose concentration. This experimental observation has been confirmed by independent laboratories in both mice (Tobin et al. 2008; Gorboulev et al. 2012), rat (Au et al. 2002; Wei et al. 2011), in intestinal cell lines (Zheng et al. 2012) and clinically in morbidly obese patients (Ati-Omar et al. 2011). GLUT2 is permanently expressed in the apical membrane of the intestine during diabetes (Gouyon et al. 2003; Tobin et al. 2008) and makes for an ideal target for therapeutic intervention. Expression of GLUT2, glucokinase and subunits of K+ATP-sensitive channels have been detected in IECs, supporting the hypothesis that changes to apical GLUT2 expression may modulate gut peptide secretion by modulating membrane depolarisation through closure of K+ATP-sensitive channels (Reimann et al. 2008).
In addition to glucose, l-amino acids including glutamine (Gln), phenylalanine (Phe) and tryptophan (Trp) have been shown to stimulate GLP-1 secretion using intestinal epithelial cell models (Reimann et al. 2004; Tolhurst et al. 2011). Adding to the cellular mechanisms by which l-amino acids are detected, the taste receptor, Tas1R1+Tas1R3, and the calcium sensing receptor, CasR, have been shown to respond to l-amino acid stimulation (Conigrave et al. 2000; Oya et al. 2011). Given the demonstrations that l-amino acids can stimulate the secretion of the gut peptide cholecystokinin (CCK) (Koop & Buchan, 1992; Chang et al. 1994; Tolhurst et al. 2011) through CasR (Busque et al. 2005; Dufner et al. 2005; Wang et al. 2011), we sought to investigate whether CasR might play a role in the secretion of GIP, GLP-1 and PYY.
At present, it is technically challenging to generate time courses showing gut peptide secretion in rodent models primarily because of the small blood volume that can be sampled. In addition, the analysis of gut peptides is hampered due to the relatively high detection limits of many hormone platforms. We have employed isolated loops of rat small intestine, previously used to study the absorption of nutrients (Fisher & Gardner, 1974; Gardner & Plumb, 1979; Bronk & Hastewell, 1988; Lister et al. 1995) from which we were able to quantify total GIP, active GLP-1 and total PYY. The isolated loop preparation was validated using established GLP-1 secretagogues (see Supplementary information) and remained viable. Our experiments reveal that GLUT2 regulates the secretion of GIP, GLP-1 and PYY in response to a diverse set of gut peptide secretagogues. We also show that extracellular Ca2+ is essential for GIP, GLP-1 and PYY secretion stimulated by l-amino acids via CasR.
Methods
Animals
Male Sprague–Dawley rats (200–250 g) were obtained from Charles Rivers, UK, fed ab libitum and had free access to water. They were maintained on a 12 h light–dark regime. Animals were culled by Schedule 1 methods according to the UK Home Office Animals (Scientific Procedures) Act 1986. All animal procedures were approved by the local ethical committee.
Perfusion technique
Loops of small intestine (from stomach to ileal–caecal valve) were perfused in single-pass mode for 60 min as described previously (Bronk et al. 1987, 1988; Lister et al. 1995, 1997) and modified to include the entire small intestine. Viability was assessed by ability to maintain steady water flow and to actively transport d-glucose. The loop was suspended in liquid paraffin (specific gravity 0.83–0.86) at 37.5°C. The first 30 min was comprised of a control period during which Krebs–Henseleit buffer (KHB) (consisting of (in mm): 120 NaCl, 4.5 KCl, 1 MgSO4,1.8 Na2HPO4, 0.2 NaH2PO4, 25 NaHCO3, 1.25 CaCl2 and 5 d-glucose) was perfused at a flow rate of 1.6 ml min−1 to prevent distension of the preparation (Helliwell & Kellett, 2002). A phosphate- and magnesium-free buffer was used for the experiments involving high Ca2+ concentrations, adapted from Auchere et al. (1997).
Amino acid stock solutions were made up in KHB at 100 mm, except tryptophan which was made up in KHB at 50 mm. After 30 min, the loop was perfused with a second experimental perfusate (identical to the first except for the addition of test agent). As necessary, mannitol was added to the control perfusate buffer to maintain a constant osmolarity between perfusate solutions of differing glucose concentration. For dipeptide experiments where the pH of the KHB was altered to pH 6.8, the NaHCO3 concentration was reduced from 25 mm to 5 mm and the NaCl concentration was increased from 120 mm to 140 mm. For those perfusions in which the luminal pH was altered, the same luminal pH was used throughout the 60 min perfusion.
Serosal secretion samples were collected every 5 min and were analysed for glucose, total GIP, active GLP-1 and total PYY using commercially available ELISAs. A measured segment of the perfused intestine was blotted dry and dried to constant weight. This provided the dry weight per centimetre used to calculate the total dry weight of the perfused segment. The volume of serosal secretion samples was also measured to determine fluid flux so that gut peptide concentrations could be corrected for changes in fluid transport.
Calculation and expression of results
All results are expressed as mean ± standard error of the mean (SEM); n = 8 except where noted. Data are presented as serosal appearance (e.g. pg ml−1 (g dry weight)−1). Area under the curve (AUC) was calculated for control and experimental phases. Where distinct phases of peptide secretion were observed, the AUCreactive for each was calculated in units of pg ml−1 (g dry weight)−1 min−1. Statistical comparisons were carried out using 2-way analysis of variance to compare sets of concentration data, covariance analysis for cumulative serosal appearance and Student's t test for comparison of means.
Results
Model validation
The model was extensively characterised and validated (see Supplementary information). In serosal samples, concentrations of GIP, GLP-1 and PYY to demonstrate both K- and L-cell activity could readily be detected. Glucose (5–100 mm), glycylsarcosine (0.1–5 μm), the mixed nutrient formulation Ensure plus (10–100% v/v), OEA (0.1–10 μm), propionate (5–50 mm) and taurocholate (5–50 mm) stimulated gut peptide secretion (see Supplementary information). Full dose–response relationships were generated for each secretagogue and perfusion conditions optimised for maximal gut peptide stimulation (see Supplementary information). This included addition of the fatty acid amide hydrolase inhibitor URB579 for OEA, and changing the pH to 6.8 for glycylsarcosine, respectively.
Gut peptide secretion involves GLUT2
Challenging the small intestine with increasing glucose (5–100 mm) increased the rate of glucose absorption (Table 1). Phloridzin (0.5 mm) inhibited the rate of glucose absorption by approximately 50%. With both phloridzin and phloretin (0.5 mm) in the perfusate buffer, the rate of glucose absorption was completely abolished (Table 1).
Table 1.
The effect of glucose and inhibitors of SGLT1 and GLUT2 on glucose absorption and fluid transport
| [Glucose] (mm) | Glucose rate (mm (g dry weight)−1 min−1) | Fluid rate (μl (g dry weight)−1 min−1) | |
|---|---|---|---|
| Glucose | 5 | 11.8 ± 2..3 | 217.9 ± 5.3 |
| 25 | 48.3 ± 7.5** | 268.7 ± 11.9** | |
| 50 | 67.4 ± 11.2*** | 273.1 ± 16.4** | |
| 100 | 89.1 ± 28.1*** | 271.6 ± 14.5** | |
| Glucose + phloridzin | 25 | 19.7 ± 8.3 | 230.1 ± 13.7 |
| 50 | 28.3 ± 11.7† | 235.4 ± 10.2 | |
| 100 | 41.2 ± 10.2‡ | 241.2 ± 13.3 | |
| Glucose + phloridzin + phloretin | 100 | 11.3 ± 5.1§§§ | 219.4 ± 21.5 |
| Glucose + phloridzin + cytochalasin B | 100 | 10.6 ± 4.9§§§ | 211.6 ± 19.7 |
| Glucose (Na+-deplete buffer) + phloretin | 100 | 13.6 ± 7.4§§§ | 201.3 ± 24.8 |
Significance was determined using Student's paired or unpaired t test as appropriate vs. 5 mm glucose where *P < 0.05, **P < 0.01 and ***P < 0.05; or 5 mm glucose + phloridzin where †P < 0.05, ‡P < 0.01; or 100 mm glucose where §§§P < 0.05.
Glucose stimulated the secretion of GIP, GLP-1 and PYY from isolated loops of rat small intestine (Fig. 1A–F). The secretion of GIP, GLP-1 and PYY by glucose was partially inhibited by phloridzin (0.5 mm) to block SGLT1 activity (Fig. 1G–L) or by using a Na+-deplete buffer (Fig. 2), indicating that peptide secretion was not solely dependent on SGLT1 and that other mechanisms were operational. In the presence of 100 mm glucose to stimulate GIP, GLP-1 and PYY secretion and 0.5 mm phloridzin to block SGLT1, the subsequent addition of phloretin (0.5 mm) or cytochalasin B (10 μm) returned secretion to basal levels, demonstrating a significant role for GLUT2 in the secretion of GIP, GLP-1 and PYY (Fig. 2). Using two separate conditions to inhibit SGLT1, namely phloridzin and a Na+-deplete buffer, we obtained very similar data suggesting that phloridzin was selective for SGLT1 only.
Figure 1. SGLT1 and GLUT2 regulate GIP, GLP-1 and PYY secretion.
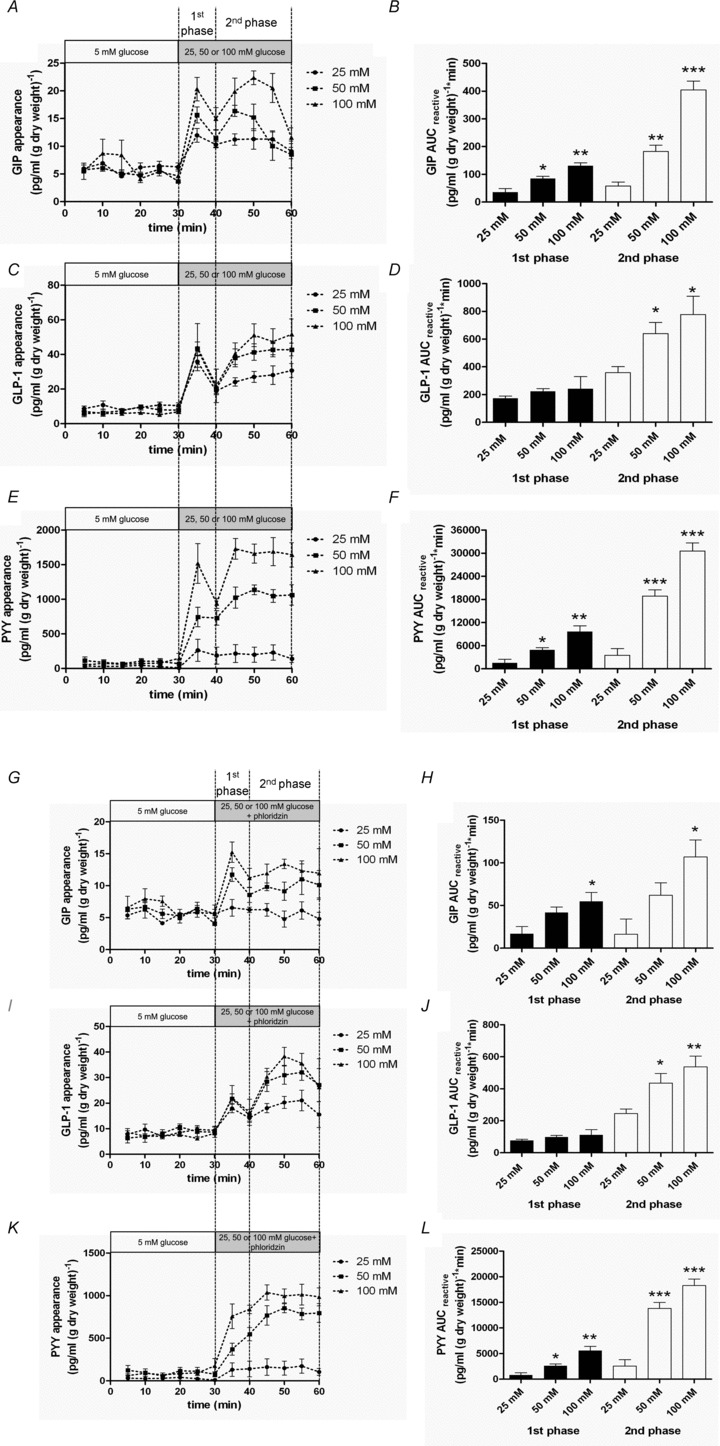
A–F, rat small intestine was perfused with 5 mm glucose in KHB. At 30 min, 25, 50 or 100 mm glucose was introduced for a further 30 min. Samples were analysed for GIP, GLP-1 and PYY. AUCreactive was calculated for 1st (30–40 min) and 2nd (40–60 min) phases for GIP, GLP-1 and PYY. Significance was determined using Student's unpaired t test vs. 5 mm glucose where *P < 0.05, **P < 0.01 and ***P < 0.001. G–L, rat small intestine was perfused with 5 mm glucose in KHB. At 30 min, the perfusate was switched to one containing 25, 50 or 100 mm glucose (25, 50 or 100 mm) + phloridzin (0.5 mm) for a further 30 min. Samples were analysed for GIP, GLP-1 and PYY. AUCreactive was calculated for the 1st (30–40 min) and 2nd (40–60 min) phases for GIP, GLP-1 and PYY. Significance was determined using Student's unpaired t test vs. 25 mm glucose + phloridzin where *P < 0.05, **P < 0.01 and ***P < 0.001.
Figure 2. SGLT1 and GLUT2 inhibitors reduce GIP, GLP-1 and PYY secretion.
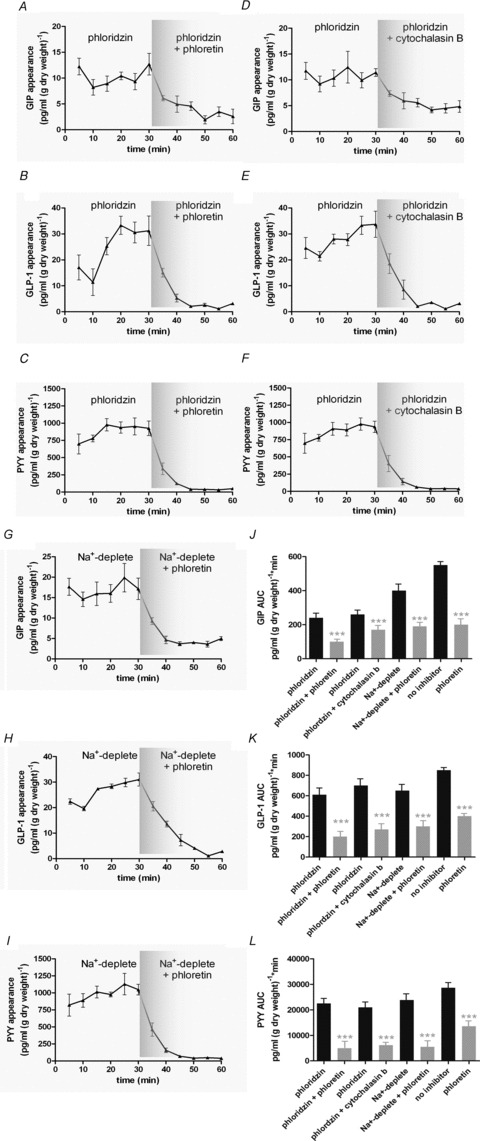
A–F, rat small intestine was perfused with glucose (100 mm) + phloridzin (0.5 mm) in KHB. Phloretin (0.5 mm) or cytochalasin B (10 μm) was added at 30 min. Control perfusions with 100 mm glucose were also conducted and phloretin (0.5 mm) added from 30 min. Samples were analysed for GIP, GLP-1 and PYY. G–I, rat small intestine was perfused with glucose (100 mm) in KHB in which Na+ was replaced with choline. At t= 30 min, phloretin was added. Samples were analysed for GIP, GLP-1 and PYY. J–L, AUC was calculated for t= 0–30 min and t= 30–60 min for GIP, GLP-1 and PYY. Significance was determined using Student's paired t test vs.. t= 0–30 min where ***P < 0.001.
In the presence of 5 mm glucose, sucralose (1 mm) stimulated the secretion of GIP, GLP-1 and PYY which was rapidly reversible (Fig. 3A–F). The response to sucralose was not changed by phloridzin but was significantly diminished by phloretin (Fig. 3G–L). At the same time, sucralose increased the rate of glucose absorption 3-fold, which was phloretin sensitive (Table 2).
Figure 3. Gut peptide secretion stimulated by sucralose is blocked by GLUT2 inhibition.
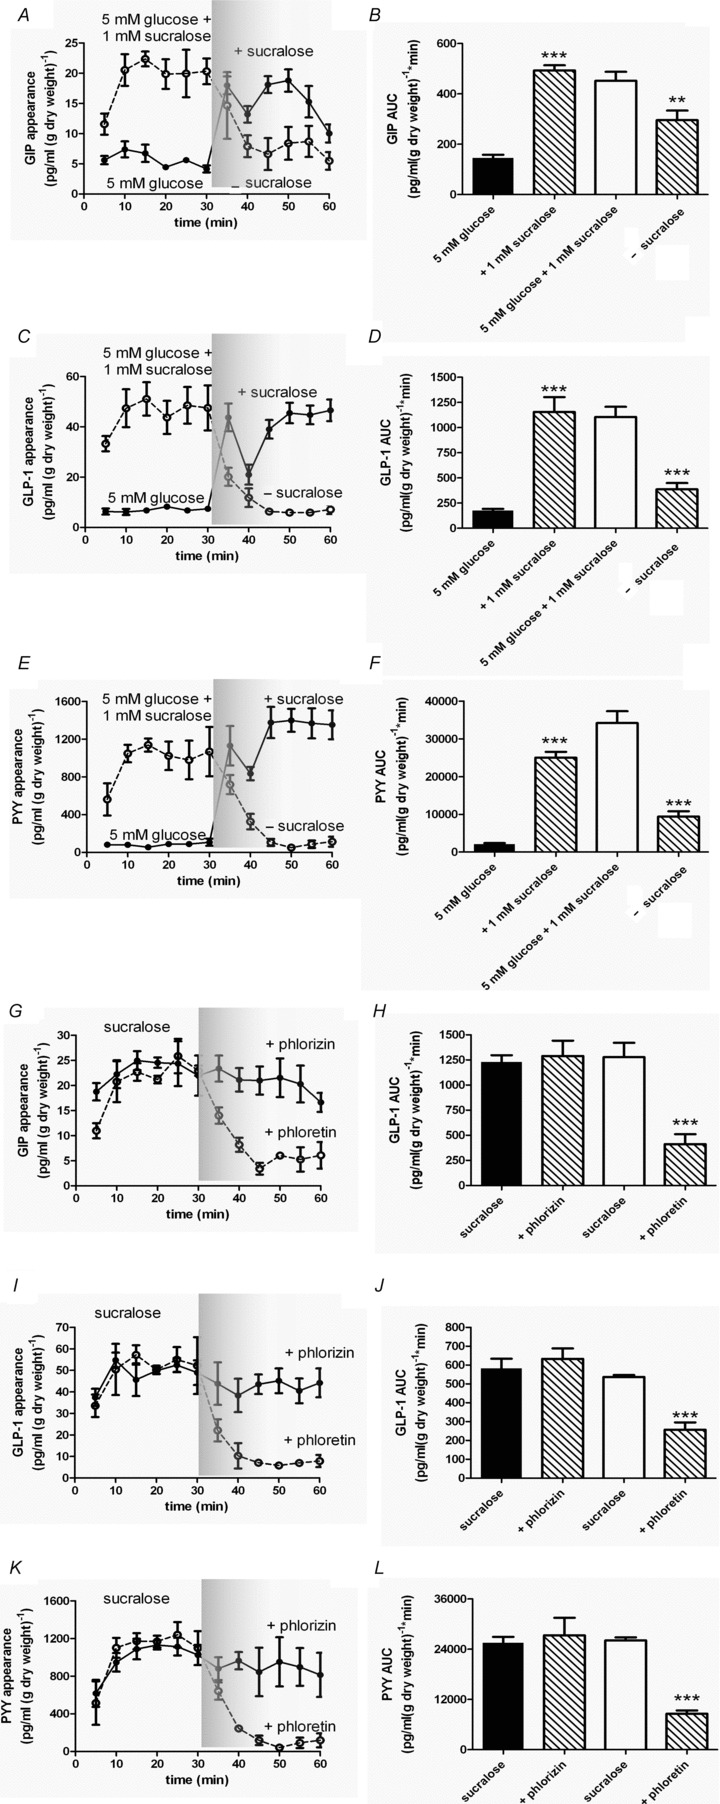
A–F, rat small intestine was perfused with glucose (5 mm; •) in KHB. At t= 30 min, sucralose (1 mm) was introduced. In a separate series of experiments rat small intestine was perfused with glucose (5 mm) containing sucralose (1 mm; ○) in KHB. At t= 30 min, sucralose was removed. Samples were analysed for GIP, GLP-1 and PYY. AUC was calculated for t= 0–30 min and t= 30–60 min for GIP, GLP-1 and PYY. Significance was determined using Student's paired t test vs. the control period (t= 0–30 min) where **P < 0.01 and ***P < 0.001. G–L, rat small intestine was perfused with glucose (5 mm) + sucralose (1 mm) in KHB. At t= 30 min, phlorein (0.5 mm; ○) or phloridzin (0.5 mm; •) was added. Samples were analysed for GIP, GLP-1 and PYY. AUC was calculated for t= 0–30 min and t= 30–60 min for GIP, GLP-1 and PYY. Significance was determined using Student's paired t test vs. the control period (t= 0–30 min) where ***P < 0.001.
Table 2.
The effect of sucralose and inhibitors of SGLT1 and GLUT2 on glucose absorption and fluid transport
| [Glucose] (mm) | Glucose rate (mm (g dry weight)−1 min−1) | Fluid rate (μl (g dry weight)−1 min−1) | |
|---|---|---|---|
| Glucose | 5 | 11.8 ± 2..3 | 217.9 ± 5.3 |
| Sucralose | 5 | 31.9 ± 6.8*** | 259.7 ± 34.8 |
| Sucralose + phloretin | 50 | 15.8 ± 5.4§§§ | 216.5 ± 19.3 |
| Sucralose + phloridzin | 100 | 35.8 ± 7.6 | 264.8 ± 26.5 |
Significance was determined using paired or unpaired Students t test as appropriate vs. 5 mm glucose where ***P < 0.05; or sucralose where §§§P < 0.05.
The secretion of GIP, GLP-1 and PYY stimulated by either lipid, OEA (10 μm in the presence of URB597 for maximal stimulation), dipeptide glycylsarcosine (pH 6.8 for maximal stimulation) or the bile acid taurocholate was also significantly inhibited by phloretin (Fig. 4). In parallel, the rate of glucose absorption in the presence of lipid, dipeptide or bile acid was increased 2-fold, which again was phloretin sensitive (Table 3–5).
Figure 4. Gut peptide secretion stimulated by OEA, glycylsarcosine or taurocholate is blocked by inhibition of GLUT2.
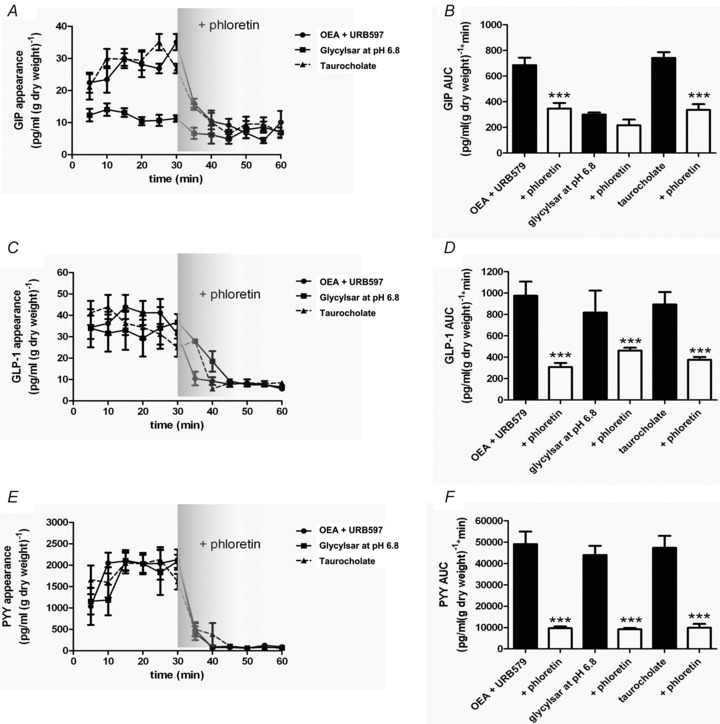
Rat small intestine was perfused with glucose (5 mm) and OEA (10 μm) + URB597 (10 μm; •), or glycylsarcosine (5 mm) at pH 6.8 (▪) or taurocholate (50 mm; ▴) in KHB. Phloretin (0.5 mm) was added at 30 min. Samples were analysed for GIP, GLP-1 and PYY. AUC was calculated for t= 0–30 min and t= 30–60 min for GIP, GLP-1 and PYY. Significance was determined using Student's paired t test vs. the control period (t= 0–30 min) where ***P < 0.001.
Table 3.
The effect of OEA and GLUT2 inhibition on glucose absorption and fluid transport
| [Glucose] (mm) | Glucose rate (mm (g dry weight)−1 min−1) | Fluid rate (μl (g dry weight)−1 min−1) | |
|---|---|---|---|
| Glucose | 5 | 12.4 ± 3.7 | 223.7 ± 4.7 |
| OEA | 5 | 25.9 ± 13.7** | 267.5 ± 32.5 |
| OEA + phloretin | 50 | 11.5 ± 4.8§§§ | 216.5 ± 19.3 |
Experiments were performed in the presence of URB597. Significance was determined using Student's paired or unpaired t test as appropriate vs. 5 mm glucose where **P < 0.01; or OEA where §§§P < 0.001.
Table 5.
The effect of taurocholate and GLUT2 inhibition on glucose absorption and fluid transport
| [Glucose] (mm) | Glucose rate (mm (g dry weight)−1 min−1) | Fluid rate (μl (g dry weight)−1 min−1) | |
|---|---|---|---|
| Glucose | 5 | 12.1 ± 2.8 | 226.8 ± 13.7 |
| Taurocholate | 5 | 26.8 ± 6.7** | 267.5 ± 32.5 |
| Taurocholate + phloretin | 50 | 11.3 ± 4.9§§§ | 201.5 ± 13.7 |
Significance was determined using Student's paired or unpaired t test as appropriate vs. 5 mm glucose where **P < 0.01; or taurocholate where §§§P < 0.001.
Table 4.
The effect of glycylsarcosine and GLUT2 inhibition on glucose absorption and fluid transport
| [Glucose] (mm) | Glucose rate (mm (g dry weight)−1 min−1) | Fluid rate (μl (g dry weight)−1 min−1) | |
|---|---|---|---|
| Glucose | 5 | 13.7 ± 5.9 | 209.7 ± 6.1 |
| Glycylsarcosine | 5 | 26.7 ± 5.6** | 267.5 ± 32.5 |
| Glycylsarcosine + phloretin | 50 | 11.5 ± 4.8§§§ | 216.5 ± 19.3 |
Experiments were performed at pH 6.8 to achieve maximum glycylsarcosine stimulation of gut peptide secretion. Significance was determined using Student's paired or unpaired t test as appropriate vs. 5 mm glucose where **P < 0.01; or glycylsarconsine where §§§P < 0.001.
Intestinal K+ATP-sensitive channels modulate gut peptide secretion
To prevent membrane depolarisation by SGLT1, we included 0.5 mm phloridzin in the perfusate buffer. Under basal conditions, closure of K+ATP channels by tolbutamide (500 μm) stimulated GIP, GLP-1 and PYY secretion (Fig. 5). In a separate set of experiments, the perfusate was switched to one containing both 100 mm glucose (+0.5 mm phloridzin) and 340 μm diazoxide, a K+ATP-channel opener. Diazoxide significantly impaired the secretion of GIP, GLP-1 and PYY stimulated by glucose (Fig. 5).
Figure 5. K+ATP-sensitive channels regulate GIP, GLP-1 and PYY secretion.
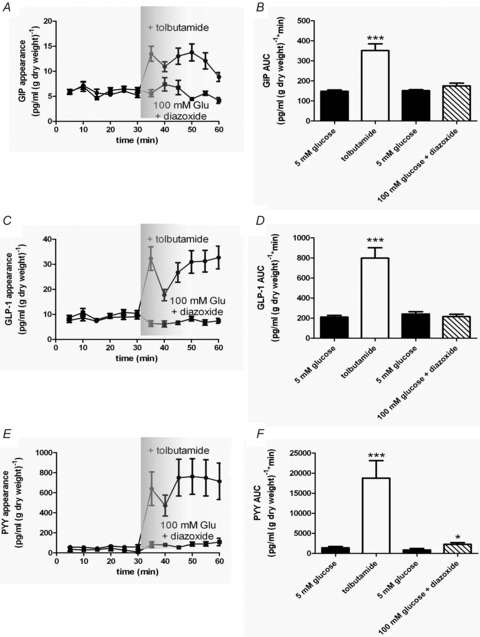
Rat small intestine was perfused with glucose (5 mm) + phloridzin (0.5 mm) in KHB. At t= 30 min, tobutamide (500 μm; •) or diazoxide (340 μm; ▪) was added. Samples were analysed for GIP, GLP-1 and PYY. AUC was calculated for t= 0–30 min and t= 30–60 min for GIP, GLP-1 and PYY. Significance was determined using Student's paired t test vs. t= 0–30 min where *P < 0.05 and ***P < 0.001.
l-Amino acids modulate K- and L-cell activity
The l-amino acids glutamine (Gln), phenylalanine (Phe), tryptophan (Trp), asparagine (Asn) and arginine (Arg) (10 mm) stimulated GIP, GLP-1 and PYY secretion from isolated loops of rat small intestine (Fig. 6). Importantly, the KHB used throughout our experiments contained 1.25 mm Ca2+.
Figure 6. Calhex 231 antagonises gut peptide secretion stimulated by l-amino acids.
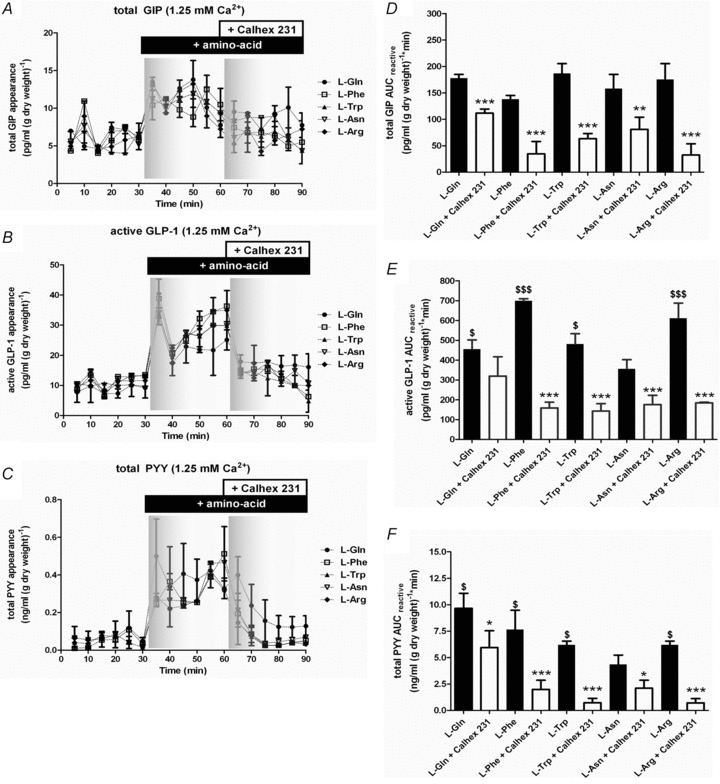
Rat small intestine was perfused with KHB ± 1.25 mm Ca2+. At 30 min, 10 mm Gln (•), Phe (□), Trp (▴), Asn (▿) or Arg (◆) was introduced. At 60 min, Calhex 231 (10 μm) was introduced. Samples were analysed for GIP, GLP-1 and PYY content. The AUCreactive was calculated for t= 30–60 and 60–90 min periods. Student's paired t tests were used to determine significance between the experimental periods where **P < 0.01 and ***P < 0.001.
l-Amino acids modulate K- and L-cell activity by CasR
Within 5 min, GIP, GLP-1 and PYY secretion was observed in response to l-amino acids. There appeared no significant difference between the ability of each amino acid to stimulate total GIP secretion at 10 mm. In the absence of extracellular Ca2+, GIP secretion was completely abolished (data not shown). The CasR antagonist Calhex 231 was used to determine whether CasR contributed to GIP secretion mediated by l-amino acids. In the absence of extracellular Ca2+, Calhex 231 did not have any effect on basal GIP secretion (data not shown). However, in the presence of extracellular Ca2+, Calhex 231 was able to inhibit l-amino acid-stimulated GIP secretion (Fig. 6A). Calhex 231 had the largest inhibitory effect on GIP secretion mediated by Arg. In contrast, Calhex 231 inhibited GIP secretion by Gln just 37%. The potency of the l-amino acids to stimulate active GLP-1 secretion was Phe > Arg > Gln ∼ Trp > Asn. There was no amino acid-induced stimulation of GLP-1 in the absence of extracellular Ca2+, and no effect of the CasR antagonist Calhex 231 (data not shown). Calhex 231 significantly inhibited Phe-, Trp- and Arg-stimulated GLP-1 secretion by ∼70% in the presence of extracellular Ca2+ (Fig. 6B). CasR activation did not appear to contribute to Gln-stimulated GLP-1 secretion (Fig. 6B). Again, Calhex 231 had no effect on total PYY secretion in the absence of extracellular Ca2+ (data not shown), but inhibited amino acid-induced total PYY secretion in the presence of extracellular Ca2+ (Fig. 6C). Since Phe and Trp were the most sensitive to inhibition of CasR with Calhex 231, we investigated the effect of the specific CasR agonist, NPS R-685, on Phe- and Trp-stimulated gut peptide release (Fig. 7). Treatment with NPS R-685 (20 μm), following elevation of Phe-, Trp- and Gln-stimulated gut peptide secretion, augmented secretion to a maximum level implying that under physiological extracellular Ca2+levels, CasR could contribute towards generation of GIP, GLP-1 and PYY secretion.
Figure 7. NPS R-568 agonism of gut peptide secretion stimulated by l-amino acids.
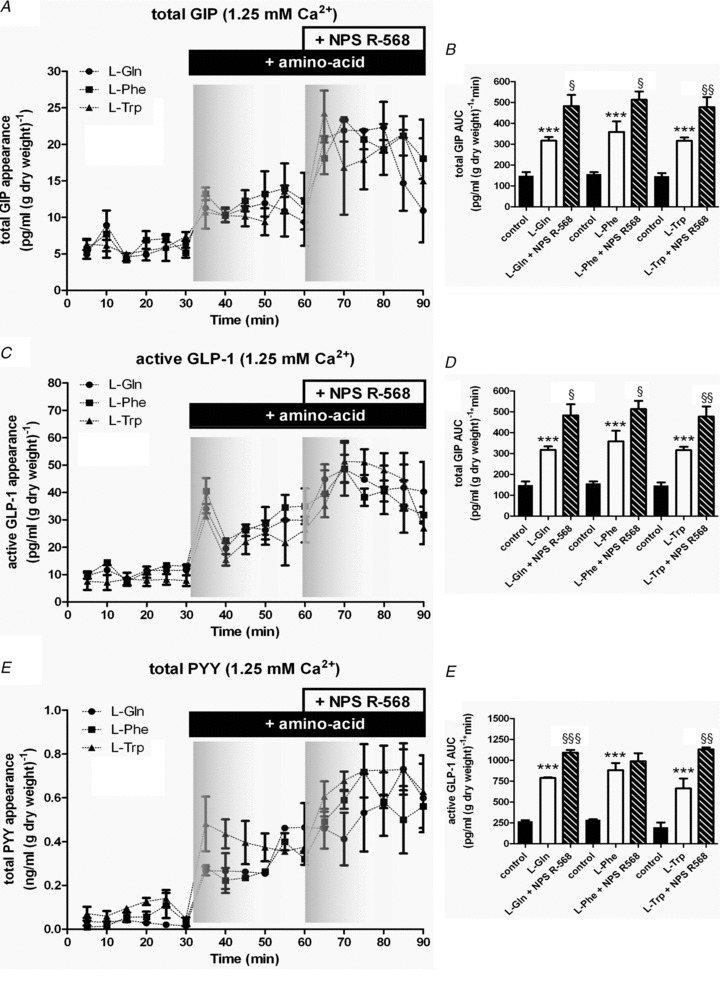
Rat small intestine was perfused with KHB containing KHB ± 1.25 mm Ca2+.At 30 min, 10 mm Gln (•), Phe (▪) or Trp (▴) was introduced. At 60 min, NPS R-568 was added into the perfusate. Samples were analysed for GIP, GLP-1 and PYY content. The AUC for t= 0–30, 30–60 and 60–90 min periods were calculated. Student's paired t tests were used to determine significance between the t= 0–30 and t= 30–60 min where **P < 0.01 and ***P < 0.001, and the t= 30–60 and t= 60–90 min periods where §P < 0.05, §§P < 0.01 and §§§P < 0.001
Extracellular Ca2+ increases the potency of phenylalanine to stimulate K- and L-cell activity
We went on to investigate the effect of extracellular Ca2+ on Phe-stimulated gut peptide release because Phe was deemed to be most sensitive to CasR activity. We perfused isolated loops of rat small intestine with 10 mm Phe and without Phe (control) for 90 min (Fig. 8) in a Ca2+-deplete buffer. We took advantage of the fact that CasR is relatively insensitive to desensitisation following repeated exposure to agonist (Huang & Miller, 2007) and cumulatively increased the extracellular Ca2+ concentration in 0.1, 0.3, 1, 3 to 10 mm steps every 15 min. In the absence of extracellular Ca2+, gut peptide secretion could not be stimulated by Phe (data not shown). Cumulative additions of extracellular Ca2+ stimulated GIP, GLP-1 and PYY secretion. The EC50 values generated for extracellular Ca2+ were 3.5, 2.5 and 2.7 mm for GIP, GLP-1 and PYY, respectively. In the presence of 10 mm Phe, peptide secretion by extracellular Ca2+ was significantly increased. Above a threshold concentration >0.3 mm, Phe-induced secretion of GIP, GLP-1 and PYY was augmented by increasing the extracellular Ca2+ concentration. The EC50 values for extracellular Ca2+ in the presence of 10 mm Phe were decreased to 2.3, 1.8 and 1.3 mm for GIP, GLP-1 and PYY, respectively. This implies that extracellular Ca2+ increased the potency of l-Phe for gut peptide secretion.
Figure 8. l-Phe increases the potency of extracellular Ca2+-stimulated gut peptide secretion.
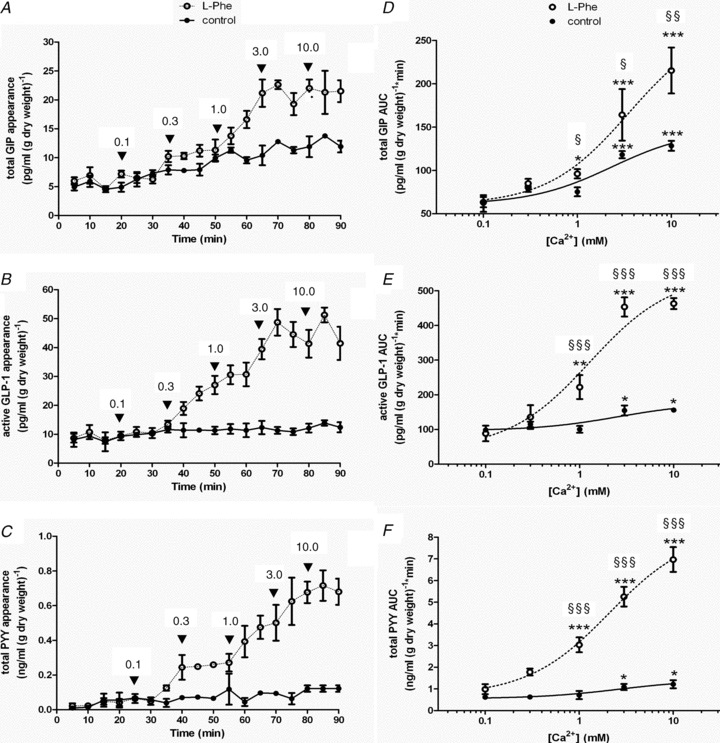
A, rat small intestine was perfused with KHB deplete of Ca2+± 10 mm Phe (+Phe, ○, and –Phe, •). At 20 min, Ca2+ was re-introduced cumulatively into the perfusate every 15 min. Samples were analysed for GIP, GLP-1 and PYY content. A–C depict the time courses for the perfusions; D–F show extracellular Ca2+–gut peptide response relationships using the calculated AUC following each Ca2+ addition. Student's paired t tests were used to determine significance between additions where *P < 0.05, **P < 0.01 and ***P < 0.001. Student's unpaired t tests were used to determine significance between control and l-Phe where §P < 0.05, §§P < 0.01 and §§§P < 0.001
Discussion
Measurement of K- and L-cell activity in isolated loops of rat small intestine
For the first time, we show that K- and L-cell activity can be examined in isolated loops of rat small intestine to obtain measurable quantities of GIP, GLP-1 and PYY. The profile of GLP-1 and PYY release parallels studies performed using alternative vascular intestinal perfusion and in vivo perfusion techniques (Dumoulin et al. 1995). In the presence of 100 mm glucose, phloridzin inhibited GIP, GLP-1 and PYY secretion by approximately 45%; the remainder was sensitive to the GLUT2 inhibitors phloretin and cytochalasin B, indicating that in addition to SGLT1, GLUT2 has an equally important role. Fluid absorption increased in response to higher glucose concentrations. However, elevated fluid absorption was not significantly inhibited in the presence of phloridzin, phloretin or cytochalasin B. This effect has previously been reported in rabbit small intestine, where there was no effect of phloridzin on water transport when the tissue had previously been exposed to glucose (Naftalin et al. 1986), most probably due to the residual glucose present in the submucosal fluid. Similarly, in our intestinal preparation there is no clearance from the serosal side where residual glucose is likely to accumulate.
SGLT1 and GLUT2
Oral glucose stimulates GLP-1 secretion whilst elevated blood glucose does not, suggesting that detection originates from the apical side. GIP, GLP-1 and PYY secretion was sensitive to phloridzin which inhibited ∼45% of the secretory response. The remaining secretory response was completely abolished by phloretin or cytochalasin B suggesting that a significant component is regulated by GLUT2. We are confident that apical GLUT2 is targeted by luminal phloretin and luminal cytochalasin B. We were unable to detect phloretin, or its conjugated metabolites, in the samples obtained from the serosal side, indicating that during the time scale of our perfusion experiments, phloretin did not access the basolateral side. Furthermore, we are not aware that luminal cytochalasin B can traverse the epithelium.
GIP and GLP-1 are stimulators of insulin release. Insulin secretion is characterised by two distinct phases, the first occurring within minutes of β-cell stimulation and a second prolonged release. This phenomenon was also observed for glucose stimulation of GIP, GLP-1 and PYY in this study (Fig. 1), with the first peak occurring within 5 min. It is interesting to note that mice lacking SGLT1 still exhibit significant elevation of insulin 13 min post gavage with glucose (2 mg (kg body weight)−1) without stimulation of GIP and GLP-1 secretion in response to glucose (Gorboulev et al. 2012). It is difficult to draw firm conclusions towards the contribution that SGLT1 makes towards gut peptide secretion and whether the absence of SGLT1 directly caused the reduction in GIP and GLP-1 observed in the SGLT1−/− mice, particularly when the effect of SGLT1 knockout on the total amount of gut peptide was not measured and when in the supplementary information of the same paper, isolated primary epithelial cell cultures from the SGLT1+/− and SGLT1−/− mice show equivalent GIP and GLP-1 secretion when challenged with glucose (Gorboulev et al. 2012). Without a full time course, one can only take a snap shot of the gut peptide response which could potentially mask any effect of GLUT2. For example, if one were to sample from Fig. 1C at 10 min post glucose challenge (t= 40 min), the erroneous conclusion that glucose was without effect would be drawn. It is interesting to note that in the same SGLT1−/− mouse study, glucose did not increase active GLP-1 in either wild type or knockout mice 13 min post gavage presumably because of the short half-life of GLP-1 and that only total plasma GLP-1 at 5 min post glucose was elevated, in which the proportion of active GLP-1 was unknown (Gorboulev et al. 2012).
The ability of GLUT2 to act as a sugar sensor is not a new idea (Thorens, 2001). Pancreatic β-cells fail to secrete insulin when GLUT2 is replaced with other GLUT proteins that afford equivalent glucose flux kinetics (Hughes et al. 1993; Newgard & McGarry, 1995). The time scale of gut peptide secretion observed in the studies presented here is in keeping with those of apical GLUT2 insertion (e.g. the t1/2 being in the order of minutes) (Gouyon et al. 2003; Shepherd et al. 2004; Kellett & Brot-Laroche, 2005; Mace et al. 2007a,b; Morgan et al. 2007). Sugar transporters detected in taste receptor cells of the lingual epithelium that are morphologically similar to IECs include GLUT2 where GLUT2-containing vesicles have been observed below the apical membrane (Merigo et al. 2011; Yee et al. 2011). In addition, transcripts for K+ATP channel subunits Kir6.2 and SUR1, and glucokinase, are also present in GLUTag cells and purified L-cells (Reimann & Gribble, 2002), implying that glucose entry through GLUT2 and its subsequent metabolism in IECs can influence membrane depolarisation.
GLUT2-null mice exhibit diminished GLP-1 secretion in response to a glucose challenge (Cani et al. 2007). In addition, intestinal GLP-1 content in those GLUT2-null mice was significantly reduced (Cani et al. 2007). In the present study, inhibition of GLUT2 inhibited GIP, GLP-1 and PYY secretion mediated by a diverse range of secretagogues indicating a fundamental role in the gut peptide secretory mechanism. In the presence of the SGLT1 inhibitor phloridzin, we observed that the small intestine was sensitive to tolbutamide, suggesting that GIP, GLP-1 and PYY secretion is modulated by K+ATP-sensitive channels and consistent with reports showing K+ATP-sensitive channels are expressed in purified L-cells (Reimann & Gribble, 2002).
Phloretin has been shown to affect both Ca2+ and K+ATP-sensitive channels (Olsen et al. 2007). We found similar data with cytochalasin B (Fig. 1C), which to our knowledge, does not affect either Ca2+ or K+ATP-sensitive channels so we are confident that phloretin is selectively targeting GLUT2. Neither phloretin, nor cytochalasin B inhibitied l-amino acid-induced gut peptide secretion.
A gut peptide response to sucralose in the presence of glucose
Artificial sweeteners have been shown to increase gut peptide release (Steinert et al. 2011). They have also been shown to increase glucose absorption across the rat small intestine through the insertion of GLUT2 into the apical membrane (Mace et al. 2007a, 2009). In the present study, sweet taste receptor proteins expressed in absorptive enterocytes and enteroendocrine cells (Mace et al. 2007a, 2009; Kaji et al. 2009) responded to sucralose with GIP, GLP-1 and PYY secretion and enhanced glucose absorption. Gut peptide secretion stimulated by sucralose is consistent with recent evidence showing activation of the sweet taste receptor leads to gut peptide secretion (Gerspach et al. 2011; Steinert et al. 2011). In support, knockout mice for Tas1R3 or the G protein αgustducin also exhibit impaired glucose-stimulated GLP-1 secretion in vivo (Margolskee et al. 2007). Indeed, one possible alternative explanation of the Tas1R3 or the αgustducin protein knockout mice data could be that reductions in taste receptor proteins would compromise apical GLUT2 levels to consequently impair GLP-1 secretion (Margolskee et al. 2007).
It appears evident from the literature that intestinal responses to sucralose emerge when sucralose is co-dosed with glucose (Mace et al. 2007a). In primary rodent intestinal cells, sucralose induced secretion of GLP-1 in the presence of 10 mm glucose (Reimann et al. 2008). Higher concentrations of sucralose (20 mm) were required to elicit a response, most probably due to desensitisation of the sweet taste receptor following culture in medium containing 25 mm glucose (Reimann et al. 2008). Since GLUT2 and therefore glucose is necessary to observe a response to sucralose, it appears that gut peptide secretion in response to sucralose is glucose dependent. Potentially, activation of sweet taste receptors with sucralose synergises with glucose.
Conditions that impede GLUT2 targeting to the apical membrane including stress (Shepherd et al. 2004; Boudry et al. 2007), Ca2+ depletion (Morgan et al. 2007; Mace et al. 2007b, 2009), glucose concentration (Shepherd et al. 2004; Mace et al. 2007a,b; Grefner et al. 2010) and SGLT1 knockout (Gorboulev et al. 2012) will hinder attempts to observe glucose-dependent gut peptide secretion, which may have contributed to the current conflict in the literature regarding the ability of intestinal sweet taste receptor activity to modulate gut peptide secretion.
CasR is involved in l-amino acid stimulation of K- and L-cell activity
Depletion of extracellular Ca2+ diminished secretion of GIP, GLP-1 and PYY in response to l-amino acids. The specific CasR agonist, R-476, potentiated amino acid-dependent gut peptide secretion, whilst the inhibitor, Calhex, inhibited gut peptide responses. Our data show that enteroendocrine-expressed CasR is functionally active and physiologically important in mediating a response to l-amino acids. The partial inhibition by Calhex of the Gln-mediated response is not surprising since it has previously been reported that Gln stimulates GLP-1 secretion from primary murine L-cells via elevating intracellular Ca2+, which is augmented further by increasing cAMP levels.
These data show that CasR provides a link between amino acids in the lumen of the gastrointestinal tract and the stimulation of gut peptides, GIP, GLP-1 and PYY. Consistent with this hypothesis, purified murine L-cells contain transcripts for CasR (Reimann et al. 2004). Whether apical or basolateral CasR activity mediates the effects of l-amino acids is unknown. However, activation of CasR in enteroendocrine G-cells and I-cells stimulates the secretion of gastrin and cholecystokinin (CCK), respectively (Ray et al. 1997; Buchan et al. 2001; Bevilacqua et al. 2005; Ceglia et al. 2009; Feng et al. 2010; MacLeod, 2011). The data presented here show that CasR detects l-amino acids within the concentration ranges found in the diet (Adibi & Mercer, 1973; Adibi et al. 1973; Feldman & Grossman, 1980).
EC50 values for extracellular Ca2+ in the presence of Phe were close to the reported level of free ionised and bioavailable Ca2+ in human plasma (1.5 mm) so that Phe-induced gut peptide secretion is likely to be sensitive to variations in extracellular Ca2+ that correspond to physiological levels observed under normal conditions. Furthermore, Phe increased the sensitivity of this response, and the EC50 decreased for peptide secretion. These data indicate that l-amino acids can affect CasR activity and suggest that the prevailing extracellular Ca2+concentration may determine the magnitude of a gut peptide secretory response. It was evident, at least for Gln, that the interaction between l-amino acids and CasR was not solely responsible for mediating secretion of the gut peptides examined. In vitro, Gln-induced GLP-1 secretion is mediated by both Ca2+ and cAMP signalling pathways (Reimann et al. 2004; Tolhurst et al. 2011).
Conclusion
In conclusion, we propose that GLUT2 regulates K- and L-cell gut peptide responses to a diverse set of secretagogues. Our current working model is described in Fig. 9. It is clear that CasR participates in K- and L-cell gut peptide responses to l-amino acids. Other receptor proteins including Tas1R2+Tas1R3, Tas1R1+Tas1R3 and GPRc6A receptors are likely to coordinate a vast network of signal integration to culminate in a coordinated gut peptide response.
Figure 9. Proposed working model.
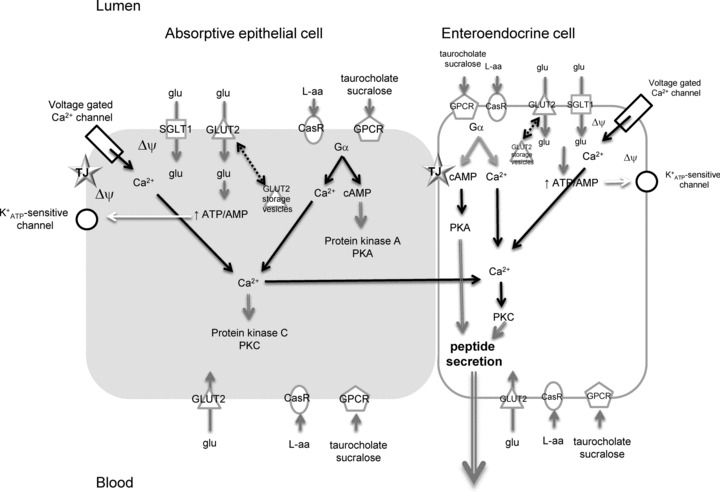
Absorptive epithelial cells and EECs share common signalling elements initiating gut peptide secretion, namely SGLT1, GLUT2, CasR, GPCRs, voltage-gated Ca2+ and K+ATP-sensitive channels. Glucose (glu) can stimulate gut peptide secretion by (1) Na+-coupled glucose transport via SGLT1 to directly depolarise the membrane (ΔΨ), opening voltage-gated Ca2+ channels or (2) transport of glucose into cells via GLUT2 leads to increased metabolism and closure of K+ATP-sensitive channels located close to the tight junction (TJ). This generates depolarisation of the membrane. A rise in intracellular Ca2+ results with gut peptide secretion from EECs.
Acknowledgments
All authors were employees of Prosidion Ltd at the time the experiments were performed.
Glossary
- CasR
calcium-sensing receptor
- CCK
cholecystokinin
- GIP
gluco-insulinotropic peptide
- GLP-1
glucagon-like peptide-1
- GLUT2
facilitative glucose transporter 2
- GPCR
G protein-coupled receptor
- IEC
intestinal enteroendocrine cell
- OEA
oleoylethanolamide
- PYY
peptide tyrosine tyrosine
- SGLT1
sodium-dependent glucose cotransporter 1
- Tas1R1+Tas1R3
amino acid taste receptor
- Tas1R2+Tas1R3
sweet taste receptor
Author contributions
O.J.M., M.S. and S.P. were responsible for the conception & design of the experiments, collection, analysis & interpretation of the data and writing the article. All authors approved the final version.
References
- Adibi SA, Mercer DW. Protein digestion in human intestine as reflected in luminal, mucosal, and plasma amino acid concentrations after meals. J Clin Invest. 1973;52:1586–1594. doi: 10.1172/JCI107335. [DOI] [PMC free article] [PubMed] [Google Scholar]
- Adibi SA, Modesto TA, Morse EL, Amin PM. Amino acid levels in plasma, liver, and skeletal muscle during protein deprivation. Am J Physiol. 1973;225:408–414. doi: 10.1152/ajplegacy.1973.225.2.408. [DOI] [PubMed] [Google Scholar]
- Ait-Omar A, Monteiro-Sepulveda M, Poitou C, Le Gall M, Cotillard A, Gilet J, et al. GLUT2 accumulation in enterocyte apical and intracellular membranes: a study in morbidly obese human subjects and ob/ob and high fat-fed mice. Diabetes. 2011;60:2598–2607. doi: 10.2337/db10-1740. [DOI] [PMC free article] [PubMed] [Google Scholar]
- Au A, Gupta A, Schembri P, Cheeseman CI. Rapid insertion of GLUT2 into the rat jejunal brush-border membrane promoted by glucagon-like peptide 2. Biochem J. 2002;367:247–254. doi: 10.1042/BJ20020393. [DOI] [PMC free article] [PubMed] [Google Scholar]
- Auchere D, Tardivel S, Gounelle JC, Lacour B. Stimulation of ileal transport of calcium by sorbitol in in situ perfused loop in rats (in French) Gastroenterol Clin Biol. 1997;21:960–966. [PubMed] [Google Scholar]
- Bevilacqua M, Dominguez LJ, Righini V, Valdes V, Toscano R, Sangaletti O, et al. Increased gastrin and calcitonin secretion after oral calcium or peptones administration in patients with hypercalciuria: a clue to an alteration in calcium-sensing receptor activity. J Clin Endocrinol Metab. 2005;90:1489–1494. doi: 10.1210/jc.2004-0045. [DOI] [PubMed] [Google Scholar]
- Boudry G, Cheeseman CI, Perdue MH. Psychological stress impairs Na+-dependent glucose absorption and increases GLUT2 expression in the rat jejunal brush-border membrane. Am J Physiol Regul Integr Comp Physiol. 2007;292:R862–R867. doi: 10.1152/ajpregu.00655.2006. [DOI] [PubMed] [Google Scholar]
- Bronk JR, Hastewell JG. The transport and metabolism of naturally occurring pyrimidine nucleosides by isolated rat jejunum. J Physiol. 1988;395:349–361. doi: 10.1113/jphysiol.1988.sp016923. [DOI] [PMC free article] [PubMed] [Google Scholar]
- Bronk JR, Lister N, Lynch S. Absorption of 5-fluorouracil and related pyrimidines in rat small intestine. Clin Sci (Lond) 1987;72:705–716. doi: 10.1042/cs0720705. [DOI] [PubMed] [Google Scholar]
- Bronk JR, Lister N, Shaw MI. Transport and metabolism of 6-thioguanine and 6-mercaptopurine in mouse small intestine. Clin Sci (Lond) 1988;74:629–638. doi: 10.1042/cs0740629. [DOI] [PubMed] [Google Scholar]
- Buchan AM, Squires PE, Ring M, Meloche RM. Mechanism of action of the calcium-sensing receptor in human antral gastrin cells. Gastroenterology. 2001;120:1128–1139. doi: 10.1053/gast.2001.23246. [DOI] [PubMed] [Google Scholar]
- Busque SM, Kerstetter JE, Geibel JP, Insogna K. L-type amino acids stimulate gastric acid secretion by activation of the calcium-sensing receptor in parietal cells. Am J Physiol Gastrointest Liver Physiol. 2005;289:G664–G669. doi: 10.1152/ajpgi.00096.2005. [DOI] [PubMed] [Google Scholar]
- Cani PD, Holst JJ, Drucker DJ, Delzenne NM, Thorens B, Burcelin R, Knauf C. GLUT2 and the incretin receptors are involved in glucose induced incretin secretion. Mol Cell Endocrinol. 2007;276:18–23. doi: 10.1016/j.mce.2007.06.003. [DOI] [PubMed] [Google Scholar]
- Ceglia L, Harris SS, Rasmussen HM, Dawson-Hughes B. Activation of the calcium sensing receptor stimulates gastrin and gastric acid secretion in healthy participants. Osteoporos Int. 2009;20:71–78. doi: 10.1007/s00198-008-0637-8. [DOI] [PMC free article] [PubMed] [Google Scholar]
- Chang CH, Chey WY, Sun Q, Leiter A, Chang TM. Characterization of the release of cholecystokinin from a murine neuroendocrine tumor cell line, STC-1. Biochim Biophys Acta. 1994;1221:339–347. doi: 10.1016/0167-4889(94)90259-3. [DOI] [PubMed] [Google Scholar]
- Conigrave AD, Quinn SJ, Brown EM. L-amino acid sensing by the extracellular Ca2+-sensing receptor. Proc Natl Acad Sci U S A. 2000;97:4814–4819. doi: 10.1073/pnas.97.9.4814. [DOI] [PMC free article] [PubMed] [Google Scholar]
- Dufner MM, Kirchhoff P, Remy C, Hafner P, Muller MK, Cheng SX, et al. The calcium-sensing receptor acts as a modulator of gastric acid secretion in freshly isolated human gastric glands. Am J Physiol Gastrointest Liver Physiol. 2005;289:G1084–G1090. doi: 10.1152/ajpgi.00571.2004. [DOI] [PubMed] [Google Scholar]
- Dumoulin V, Dakka T, Plaisancie P, Chayvialle JA, Cuber JC. Regulation of glucagon-like peptide-1-(7–36) amide, peptide YY, and neurotensin secretion by neurotransmitters and gut hormones in the isolated vascularly perfused rat ileum. Endocrinology. 1995;136:5182–5188. doi: 10.1210/endo.136.11.7588257. [DOI] [PubMed] [Google Scholar]
- Feldman EJ, Grossman MI. Liver extract and its free amino acids equally stimulate gastric acid secretion. Am J Physiol Gastrointest Liver Physiol. 1980;239:G493–G496. doi: 10.1152/ajpgi.1980.239.6.G493. [DOI] [PubMed] [Google Scholar]
- Feng J, Petersen CD, Coy DH, Jiang JK, Thomas CJ, Pollak MR, Wank SA. Calcium-sensing receptor is a physiologic multimodal chemosensor regulating gastric G-cell growth and gastrin secretion. Proc Natl Acad Sci U S A. 2010;107:17791–17796. doi: 10.1073/pnas.1009078107. [DOI] [PMC free article] [PubMed] [Google Scholar]
- Fisher RB, Gardner ML. A kinetic approach to the study of absorption of solutes by isolated perfused small intestine. J Physiol. 1974;241:211–234. doi: 10.1113/jphysiol.1974.sp010650. [DOI] [PMC free article] [PubMed] [Google Scholar]
- Gardner ML, Plumb JA. Release of dipeptide hydrolase activities from rat small intestine perfused in vitro and in vivo. Clin Sci (Lond) 1979;57:529–534. doi: 10.1042/cs0570529. [DOI] [PubMed] [Google Scholar]
- Gerspach AC, Steinert RE, Schonenberger L, Graber-Maier A, Beglinger C. The role of the gut sweet taste receptor in regulating GLP-1, PYY, and CCK release in humans. Am J Physiol Endocrinol Metab. 2011;301:E317–E325. doi: 10.1152/ajpendo.00077.2011. [DOI] [PubMed] [Google Scholar]
- Gorboulev V, Schurmann A, Vallon V, Kipp H, Jaschke A, Klessen D, et al. Na+-D-glucose cotransporter SGLT1 is pivotal for intestinal glucose absorption and glucose-dependent incretin secretion. Diabetes. 2012;61:187–196. doi: 10.2337/db11-1029. [DOI] [PMC free article] [PubMed] [Google Scholar]
- Gouyon F, Caillaud L, Carriere V, Klein C, Dalet V, Citadelle D, et al. Simple-sugar meals target GLUT2 at enterocyte apical membranes to improve sugar absorption: a study in GLUT2-null mice. J Physiol. 2003;552:823–832. doi: 10.1113/jphysiol.2003.049247. [DOI] [PMC free article] [PubMed] [Google Scholar]
- Grefner NM, Gromova LV, Gruzdkov AA, Komissarchik I. Comparative analysis of SGLT1 and GLUT2 transporter distribution in rat small intestine enterocytes and Caco2 cells during hexose absorption (in Russian) Tsitologiia. 2010;52:580–587. [PubMed] [Google Scholar]
- Helliwell PA, Kellett GL. The active and passive components of glucose absorption in rat jejunum under low and high perfusion stress. J Physiol. 2002;544:579–589. doi: 10.1113/jphysiol.2002.028209. [DOI] [PMC free article] [PubMed] [Google Scholar]
- Huang C, Miller RT. The calcium-sensing receptor and its interacting proteins. J Cell Mol Med. 2007;11:923–34. doi: 10.1111/j.1582-4934.2007.00114.x. [DOI] [PMC free article] [PubMed] [Google Scholar]
- Hughes SD, Quaade C, Johnson JH, Ferber S, Newgard CB. Transfection of AtT-20ins cells with GLUT-2 but not GLUT-1 confers glucose-stimulated insulin secretion. Relationship to glucose metabolism. J Biol Chem. 1993;268:15205–15212. [PubMed] [Google Scholar]
- Kaji I, Karaki S, Fukami Y, Terasaki M, Kuwahara A. Secretory effects of a luminal bitter tastant and expressions of bitter taste receptors, T2Rs, in the human and rat large intestine. Am J Physiol Gastrointest Liver Physiol. 2009;296:G971–G981. doi: 10.1152/ajpgi.90514.2008. [DOI] [PubMed] [Google Scholar]
- Kellett GL, Brot-Laroche E. Apical GLUT2: a major pathway of intestinal sugar absorption. Diabetes. 2005;54:3056–3062. doi: 10.2337/diabetes.54.10.3056. [DOI] [PubMed] [Google Scholar]
- Kellett GL, Helliwell The diffusive component of intestinal glucose absorption is mediated by the glucose-induced recruitment of GLUT2 to the brush-border membrane. Biochem J. 2000;2000:155–162. [PMC free article] [PubMed] [Google Scholar]
- Koop I, Buchan AM. Cholecystokinin release from isolated canine epithelial cells in short-term culture. Gastroenterology. 1992;102:28–34. doi: 10.1016/0016-5085(92)91780-8. [DOI] [PubMed] [Google Scholar]
- Lister N, Bailey PD, Collier ID, Boyd CA, Bronk JR. The influence of luminal pH on transport of neutral and charged dipeptides by rat small intestine, in vitro. Biochim Biophys Acta. 1997;1324:245–250. doi: 10.1016/s0005-2736(96)00230-1. [DOI] [PubMed] [Google Scholar]
- Lister N, Sykes AP, Bailey PD, Boyd CA, Bronk JR. Dipeptide transport and hydrolysis in isolated loops of rat small intestine: effects of stereospecificity. J Physiol. 1995;484:173–182. doi: 10.1113/jphysiol.1995.sp020656. [DOI] [PMC free article] [PubMed] [Google Scholar]
- Mace OJ, Affleck J, Patel N, Kellett GL. Sweet taste receptors in rat small intestine stimulate glucose absorption through apical GLUT2. J Physiol. 2007a;582:379–392. doi: 10.1113/jphysiol.2007.130906. [DOI] [PMC free article] [PubMed] [Google Scholar]
- Mace OJ, Lister N, Morgan E, Shepherd E, Affleck J, Helliwell P, et al. An energy supply network of nutrient absorption coordinated by calcium and T1R taste receptors in rat small intestine. J Physiol. 2009;587:195–210. doi: 10.1113/jphysiol.2008.159616. [DOI] [PMC free article] [PubMed] [Google Scholar]
- Mace OJ, Morgan EL, Affleck JA, Lister N, Kellett GL. Calcium absorption by Cav1.3 induces terminal web myosin II phosphorylation and apical GLUT2 insertion in rat intestine. J Physiol. 2007b;580:605–616. doi: 10.1113/jphysiol.2006.124784. [DOI] [PMC free article] [PubMed] [Google Scholar]
- MacLeod RJ. A new role for the extracellular calcium-sensing receptor demonstrated by using CCK-eGFP BAC mice. Am J Physiol Gastrointest Liver Physiol. 2011;300:G526–G527. doi: 10.1152/ajpgi.00029.2011. [DOI] [PubMed] [Google Scholar]
- Margolskee RF, Dyer J, Kokrashvili Z, Salmon KS, Ilegems E, Daly K, et al. T1R3 and gustducin in gut sense sugars to regulate expression of Na+-glucose cotransporter 1. Proc Natl Acad Sci U S A. 2007;104:15075–15080. doi: 10.1073/pnas.0706678104. [DOI] [PMC free article] [PubMed] [Google Scholar]
- Merigo F, Benati D, Cristofoletti M, Osculati F, Sbarbati A. Glucose transporters are expressed in taste receptor cells. J Anat. 2011;219:243–252. doi: 10.1111/j.1469-7580.2011.01385.x. [DOI] [PMC free article] [PubMed] [Google Scholar]
- Morgan EL, Mace OJ, Affleck J, Kellett GL. Apical GLUT2 and Cav1.3: regulation of rat intestinal glucose and calcium absorption. J Physiol. 2007;580:593–604. doi: 10.1113/jphysiol.2006.124768. [DOI] [PMC free article] [PubMed] [Google Scholar]
- Naftalin RJ, Tripathi S. The roles of paracellular and transcellular pathways and submuncosal space in isotonic water absorption by rabbit ileum. J Physiol. 1986;370:409–432. doi: 10.1113/jphysiol.1986.sp015942. [DOI] [PMC free article] [PubMed] [Google Scholar]
- Newgard CB, McGarry JD. Metabolic coupling factors in pancreatic beta-cell signal transduction. Annu Rev Biochem. 1995;64:689–719. doi: 10.1146/annurev.bi.64.070195.003353. [DOI] [PubMed] [Google Scholar]
- Olson ML, Kargacin ME, Ward CA, Kargacin GJ. Effects of phloretin and phloridzin on Ca2+ handling, the action potential, and ion currents in rat ventricular myocytes. J PHarmacol Exp Ther. 2007;321:921–9. doi: 10.1124/jpet.107.121111. [DOI] [PubMed] [Google Scholar]
- Oya M, Suzuki H, Watanabe Y, Sato M, Tsuboi T. Amino acid taste receptor regulates insulin secretion in pancreatic beta-cell line MIN6 cells. Genes Cells. 2011;16:608–616. doi: 10.1111/j.1365-2443.2011.01509.x. [DOI] [PubMed] [Google Scholar]
- Parker HE, Reimann F, Gribble FM. Molecular mechanisms underlying nutrient-stimulated incretin secretion. Expert Rev Mol Med. 2010;12:e1. doi: 10.1017/S146239940900132X. [DOI] [PubMed] [Google Scholar]
- Ray JM, Squires PE, Curtis SB, Meloche MR, Buchan AM. Expression of the calcium-sensing receptor on human antral gastrin cells in culture. J Clin Invest. 1997;99:2328–2333. doi: 10.1172/JCI119413. [DOI] [PMC free article] [PubMed] [Google Scholar]
- Reimann F, Gribble FM. Glucose-sensing in glucagon-like peptide-1-secreting cells. Diabetes. 2002;51:2757–2763. doi: 10.2337/diabetes.51.9.2757. [DOI] [PubMed] [Google Scholar]
- Reimann F, Habib AM, Tolhurst G, Parker HE, Rogers GJ, Gribble FM. Glucose sensing in L cells: a primary cell study. Cell Metab. 2008;8:532–539. doi: 10.1016/j.cmet.2008.11.002. [DOI] [PMC free article] [PubMed] [Google Scholar]
- Reimann F, Williams L, da Silva Xavier G, Rutter GA, Gribble FM. Glutamine potently stimulates glucagon-like peptide-1 secretion from GLUTag cells. Diabetologia. 2004;47:1592–1601. doi: 10.1007/s00125-004-1498-0. [DOI] [PubMed] [Google Scholar]
- Shepherd EJ, Helliwell PA, Mace OJ, Morgan EL, Patel N, Kellett GL. Stress and glucocorticoid inhibit apical GLUT2-trafficking and intestinal glucose absorption in rat small intestine. J Physiol. 2004;560:281–290. doi: 10.1113/jphysiol.2004.072447. [DOI] [PMC free article] [PubMed] [Google Scholar]
- Steinert RE, Gerspach AC, Gutmann H, Asarian L, Drewe J, Beglinger C. The functional involvement of gut-expressed sweet taste receptors in glucose- stimulated secretion of glucagon-like peptide-1 (GLP-1) and peptide YY (PYY) Clin Nutr. 2011;30:524–532. doi: 10.1016/j.clnu.2011.01.007. [DOI] [PubMed] [Google Scholar]
- Thorens B. GLUT2 in pancreatic and extra-pancreatic gluco-detection (review) Mol Membr Biol. 2001;18:265–273. doi: 10.1080/09687680110100995. [DOI] [PubMed] [Google Scholar]
- Tobin V, Le Gall M, Fioramonti X, Stolarczyk E, Blazquez AG, Klein C, et al. Insulin internalizes GLUT2 in the enterocytes of healthy but not insulin-resistant mice. Diabetes. 2008;57:555–562. doi: 10.2337/db07-0928. [DOI] [PubMed] [Google Scholar]
- Tolhurst G, Reimann F, Gribble FM. Nutritional regulation of glucagon-like peptide-1 secretion. J Physiol. 2009;587:27–32. doi: 10.1113/jphysiol.2008.164012. [DOI] [PMC free article] [PubMed] [Google Scholar]
- Tolhurst G, Zheng Y, Parker HE, Habib AM, Reimann F, Gribble FM. Glutamine triggers and potentiates glucagon-like peptide-1 secretion by raising cytosolic Ca2+ and cAMP. Endocrinology. 2011;152:405–413. doi: 10.1210/en.2010-0956. [DOI] [PMC free article] [PubMed] [Google Scholar]
- Wang Y, Chandra R, Samsa LA, Gooch B, Fee BE, Cook JM, Vigna SR, Grant AO, Liddle RA. Amino acids stimulate cholechstokinin release through the Ca2+-sensing receptor. Am J Physiol Gastrointest Liver Physiol. 2011;300:G528–37. doi: 10.1152/ajpgi.00387.2010. [DOI] [PMC free article] [PubMed] [Google Scholar]
- Wei N, Liu R, Ou Y, Li X, Qiang O, Guo W, Tang CW. Effects of octreotide of glucose transporter type 2 expression in obese rat small intestine. World J Gastro. 2011;17:4434–4439. doi: 10.3748/wjg.v17.i39.4434. [DOI] [PMC free article] [PubMed] [Google Scholar]
- Yee KK, Sukumaran SK, Kotha R, Gilbertson TA, Margolskee RF. Glucose transporters and ATP-gated K+ (KATP) metabolic sensors are present in type 1 taste receptor 3 (T1r3)-expressing taste cells. Proc Natl Acad Sci U S A. 2011;108:5431–5436. doi: 10.1073/pnas.1100495108. [DOI] [PMC free article] [PubMed] [Google Scholar]
- Zheng Y, Scow JS, Duenes JA, Sarr MG. Mechanisms of glucose uptake in intestinal cell lines: role of GLUT2. Surgery. 2012;151:13–25. doi: 10.1016/j.surg.2011.07.010. [DOI] [PMC free article] [PubMed] [Google Scholar]