Abstract
Objective
To investigate the molecular mechanism underlying T-bet mediated anti-neoplastic effects of cytokine induced killer (CIK) cells.
Methods
Lymphocytes isolated from peripheral blood of leukemic children were induced with γ- interferon (IFN-γ), CD3McAb and interluki-2 (IL-2), and co-cultured with dendritic cells (DCs) to generate DC-CIK cells. The morphology and immunophenotype of these cells were determined by a light microscopy and flow cytometry, respectively. IL-2 and IFN-γ levels released by DC-CIK cells were quantified by ELISA. Cytotoxicity of DC-CIK cells against leukemia cell lines was measured by MTT assay. FCM was used to detect CD4+CD25+Treg cells, while RT-PCR and Western blot were used to determine mRNA and protein expressions of Foxp3 and GATA3 in DC-CIK cells treated with T-bet monoclonal antibody.
Findings
Induced DC-CIK cells were regular, round and transparent with variable cell volume and cellular aggregation. The main effector cells in this population were CD3+CD8+ cells and CD3+CD56+ cells. We demonstrated a time dependent increase in IL-2 and IFN-γ levels after induction. DC-CIK cells were cytotoxic to B95 cells, Jhhan cells and M07e cells, with the highest cytotoxicity towards B95 cells. Treatment with mouse anti-human T-bet monoclonal antibody resulted in an increase in the proportion of CD4+CD25+Treg cells and elevation of Foxp3 and GATA3 mRNA and protein levels.
Conclusion
DC-CIK cells induced with cytokines were strongly cytotoxic towards a number of cancer cell lines. Foxp3 and GATA3 were implicated in the T-bet mediated anti-neoplastic effects of DC-CIK cells via activation of the Th1 pathway and suppression of the Th2 and Treg pathways.
Keywords: Cytokine Induced Killer Cells, Cytotoxicity, Foxp3, GATA3
Introduction
Cytokine-induced killer (CIK) cells consist of a peripheral blood mononuclear cell-derived heterogeneous cell population which has been treated with different cytokines (CD3McAb, IL-2, IFN-γ, IL-1α) for a period of time. These cells possess potent anti-neoplastic activity similar to T lymphocytes, and also exhibit non-MHC-restricted cytotoxicity similar to NK cells[1–3]. Co-culture of dendritic cells (DCs) and CIK cells has been shown to generate DC-CIK cells which are characterized by rapid proliferation, high cytotoxic activity and fewer side effects in clinical practice[4, 5].
T-bet, a transcription factor that controls IFN-γ expression in Th1 cells[6], plays a very important role in the development of Th1 cells through activation of IFN-γ gene. GATA-3, a transcription factor that controls IL-4 expression in Th2 cells[7], also plays a positive role in the development of Th2 cells through activation of IL-4 gene. Foxp3, a transcription inhibitor[8], plays a considerable role in the development of CD4+CD25+Treg cells through increasing IL-10, TGF-β and other immunosuppressive cytokines. The immune balance between Th1, Th2 and Treg cells along with an appropriate immune response from these three cell populations plays an important role during cancer therapy. The immune response of DC-CIK cells was previously reported to be mediated by Th1 cells[9]. The anti-neoplastic effects of DC-CIK cells are directly and indirectly regulated by a number of cytokines. In this study, we investigated the molecular mechanisms underlying the anti-neoplastic effects of DC-CIK cells.
Subjects and Methods
Tetrazolium bromide (MTT) was purchased from Sigma (USA). Fetal bovine serum (FBS) and RPMI-1640 medium was from Gibco, USA. Trizol and the RT-PCR kit were from Wuhan Feiling, China. Mouse anti-human T-bet monoclonal antibody was from Wuhan Boster. Rabbit anti-Foxp3 polyclonal antibody, rabbit anti-GATA3 polyclonal antibody, and rabbit anti-GAPDH polyclonal antibody were from Cell Signaling, USA. Appropriate secondary antibody and the ECL kit were from Pierce, USA. Protein molecular weight markers were purchased from Fermentas, USA. Mouse anti-human CD3 and CD25 conjugated to FITC, mouse anti-human CD8, CD56, CD19 and CD4 conjugated to PE and appropriate isotype control antibodies were purchased from Becton, Dickinson and Company Biosciences, USA.
Acute B-lymphoblastic leukemia cell line (B95), acute T-lymphoblastic leukemia cell line (Jhhan) and megakaryocytic leukemia cell line (M07e) were kindly provided by Professor Mo Yang, Hong Kong University. The B95, Jhhan and M07e cells were cultured in RPMI 1640 medium supplemented with 10% FBS. Cells were maintained at 370C in a humidified atmosphere of 5% CO2. Cells in the logarithmic growth phase were harvested and cell viability was greater than 95%.
Generation of DC-CIK cells: Bone marrow mononuclear cells obtained from leukemic children were grown in DC base media supplemented with 1000 U/ml GM-CSF, 1000 U/ml IL-4 and 10 μg/L TNF-α. Cells were maintained at 370C in a humidified atmosphere of 5% CO2 for 10 days, resulting in the induction of DCs in this cell population. Peripheral blood mononuclear cells (PBMCs) were obtained from leukemic children by Ficoll gradient centrifugation as previously described[1] and cell density was adjusted to 1×10⁹ cells/L. Co-culture of DCs and PBMCs was performed in RPMI 1640 medium supplemented with 10% FBS. On the first day of culture, 1×10⁶ U/L IFN-γ was added. Cells were then incubated for 24 h before the addition of, 3×10⁵ U/L rIL-2 and 50 μg/ml CD3McAb. Medium was replenished every 4 days with fresh medium containing rhIL-2, and CD3McAb. Cells were harvested after 10 days of culture and cell density was adjusted to 2×10⁸ cells/L.
Immunophenotype analysis of DC-CIK cells: After 10 days of culture, DC-CIK cells were harvested, washed and centrifuged. Cell density was adjusted to 1×10⁵ cells/ml. The DC-CIK cells were blocked with 2% human immunoglobulins (2µl/100 µl cells) for 15 min. Cells were incubated with 25 µL fluorescein-conjugated CD3, CD8, CD56, CD19 or isotype IgG for 30 min. The cells were then washed, centrifuged and re-suspended in 1 ml PAB before subjecting them to flow cytometry.
Quantitation of IL-2 and IFN-γ in DC-CIK cells: Ten days after induction, DC-CIK cells were harvested, seeded in 96-well plates at a density of 1×10⁶/200 µL and incubated for 24 h. IL-2 and IFN-γ levels in the supernatant were detected using an ELISA assay according to the manufacturer's instructions.
Detection of cytotoxicity of DC-CIK cells by MTT assay: Ten days after induction, DC-CIK cells were harvested and used as effector cells. B95 cells, Jhhan cells and Mo7e cells were used as target cells. Effector cells and target cells were added to 96-well plates at a ratio of 10:1 and 20:1 respectively. In addition, effector cells or target cells alone were used as controls. Cells were incubated for 24 h at 370C in a humidified atmosphere of 5% CO2. The MTT assay was performed to evaluate cell viability, and optical density (OD) was read at 570 nm. Assays were performed in triplicate.
Cytotoxic activity(%)=[1-(ODE + T-ODE)/ODT] ×100% E: effector cells alone, T: target cells alone, E + T: effector cells + target cells
Experimental Groups: Ten days after induction, DC-CIK cells were harvested and treated with 1, 5 or 10 μg/ml mouse anti-human T-bet monoclonal antibody. Cells were divided into the following groups: 1) Blank group (control), 2) B95 cells; negative control group, 3) B95 cells plus DC-CIK cells, 4) treatment group 1: B95 cells plus DC-CIK cells plus 1 μg/ml mouse anti-human T-bet monoclonal antibody; 5) treatment group 2: B95 cells plus DC-CIK cells plus 5 μg/ml mouse anti-human T-bet monoclonal antibody, 6) treatment group 3: B95 cells plus DC-CIK cells plus 10 μg/ml mouse anti-human T-bet monoclonal antibody. Cells were incubated for 24 h and subjected to flow cytometry, RT-PCR and Western Blot.
Detection of CD4 + CD25 + Treg cells by FCM: A total of 2×10⁶ cells from each group was incubated with PE-conjugated mouse anti-human CD4 antibody (l μL) and FITC-conjugated mouse anti-human CD25 antibody (l μL) at 40C for 30 min in the dark. The cells were then washed twice, resuspended in 1 mL of fixative solution and incubated in the dark at 40C for 30 min before washing them twice again. Isotype control antibody was added to the control group and cells were washed twice. The lymphocyte subsets and proportion of CD4+CD25+Treg cells were determined by flow cytometry.
Detection of mRNA expression of Foxp3 and GATA3 by reverse transcription-polymerase chain reaction (RT-PCR):
RNA extraction: Total RNA was extracted from cells in the different groups using TRIZOL according to the manufacturer's recom-mendations. Integrity of the RNA samples was determined by agarose gel electrophoresis.
Reverse transcription-polymerase chain reaction (RT-PCR): Two-step RT-PCR was performed using a PCR kit from Takara (USA) according to the manufacturer's recommenddations. The target genes were Foxp3 and GATA-3, and the internal reference was β-actin. Primers were designed using the Primer 5.0 software and synthesized by Sangon Biotech Co. Primer sequences are displayed in Table 1. The amplified products were separated on 1.5% agarose gels and analyzed using a gel imaging analysis system. The density of each band was normalized to that of β-actin.
Table 1.
Primers and amplification conditions for RT-PCR
| gene | Primers | Tm | cycles | product size |
|---|---|---|---|---|
| β-actin | S ATA GCC GGT GTG CAG AGC TAG | 50°C | 35 | 415bp |
| A:GTG CAC GCG AGA GGT TGA GA | ||||
| Foxp3 | S: TCA CCT ACG CCA CGC TCA T | 50°C | 35 | 215bp |
| A: ACT CAG CGC TGT GGC GGA TG | ||||
| GATA3 | S:CGC CGC CGA ACT GAA GTG ACT | 50°C | 35 | 150bp |
| A:CAA AGG TGA ACG AGT GGA GT |
Detection of protein expression of Foxp3 and GATA3 by Western blot:
Preparation of total protein: Cells in the different treatment groups were washed thrice with ice cold PBS and harvested in lysis buffer (5×10⁶ cells/50 μL of lysis buffer) containing 0.5 mol/L Tris-HCL (pH 8.0), 0.15 mol/L NaCl, 0.02% sodium azide, 0.1% SDS, 100 mg/L phenylmethylsulphonyl fluoride (PMSF), 1 mg/L aprotinin, 1% Nonidet P-40 (NP-40) and 0.5% sodium deoxycholate. The lysates were centrifuged at 12,000 rpm/s for 20 min at 40C and protein concentration in the supernatant was determined by the Bradford method. The lysates were aliquoted and stored at -80°C.
Western Blotting: Protein lysates were separated on SDS-PAGE and transferred onto PVDF membranes. The membranes were blocked with 5% non-fat milk in TBST for 3 h and then incubated overnight with rabbit anti-Foxp3 (1:2000 dilution) or GATA3 (1:2000 dilution) at 4°C. The membranes were washed and incubated with horseradish peroxidase conjugated IgG for 2 h at room temperature. Rabbit anti-GAPDH primary antibody (1:1000 dilution) was used as an internal reference. Membranes were washed and color was developed using the ECL kit according to the manufacturer's instructions. The integral absorbance (IA) of bands from each protein was analyzed by GELW4D software (IA=mean IA×area). The relative expression of each protein was calculated as follows: relative expression = IA target protein/IA GAPDH.
Statistical analysis was performed with SPSS 13.0 software, and data were expressed as means ± standard deviation (SD). Comparisons between two groups or between multiple groups were performed with one way analysis of variance and t test, respectively. A value of P<0.05 was considered statistically significant.
Findings
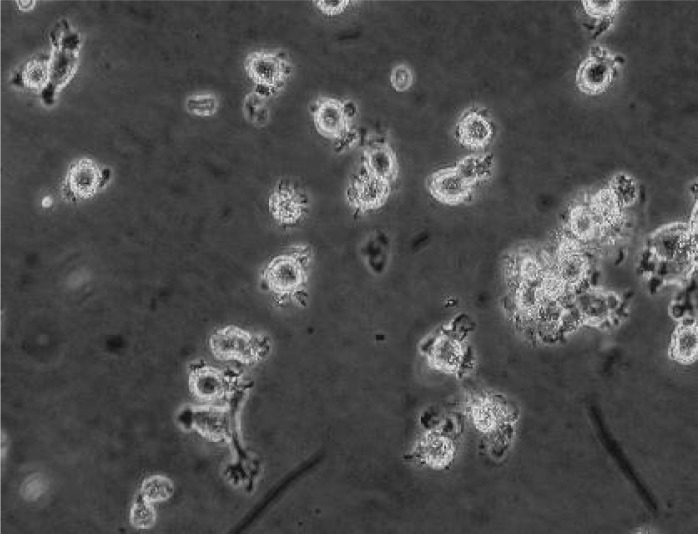
Morphology of DC-CIK cells under a light microscope: After induction, DC-CIK cells appeared regular, round and transparent and exhibited suspension growth. The cells were variable in size and many cells formed clusters (Fig. 1).
Fig. 1.
DC-CIK cells after 10 days of induction (phase contrast microscope: ×200)
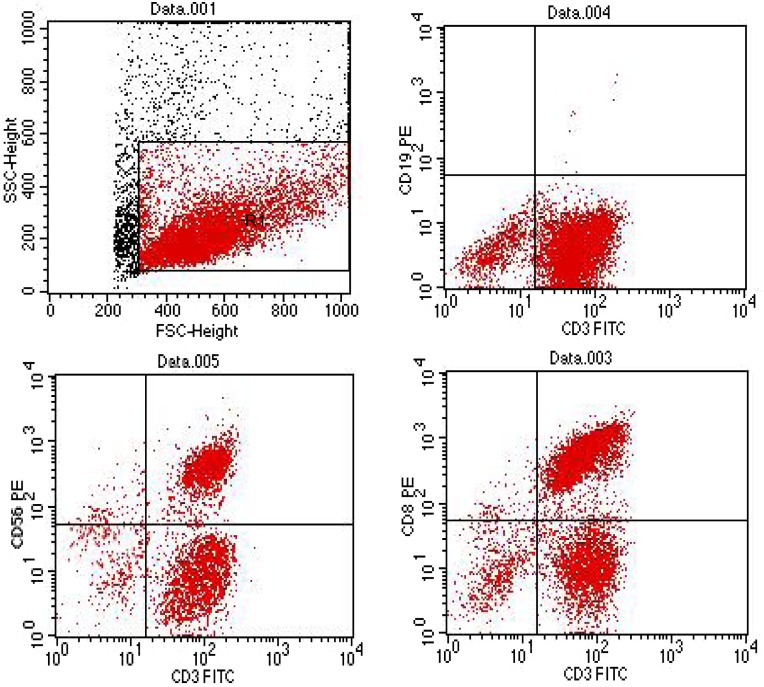
Immunophenotype of DC-CIK cells: DC-CIK cells were heterogenous in composition. We demonstrated a decrease in the number of CD3+CD19+ cells (P<0.05) accompanied by an increase in the number of CD3+CD56+ cells (P<0.05). The percentage of CD3+CD8+ cells was markedly elevated (P<0.05) (Fig. 2).
Fig. 2.
Immunophenotype of DC-CIK cells by flow cytometery
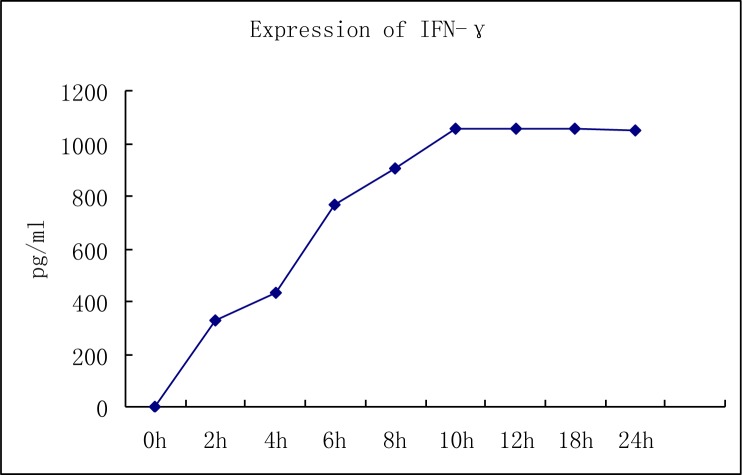
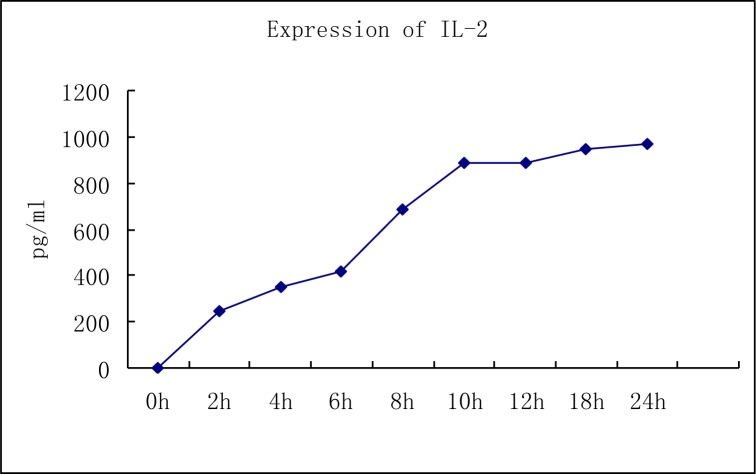
Levels of IL-2 and IFN-γ in DC-CIK cells: We used ELISA to show that the levels of IL-2 and IFN-γ in the supernatant of DC-CIK cells exhibited a significant increase in a time dependent manner. The levels of IFN-γ in the supernatant of DC-CIK cells (1×10⁶) increased gradually from 325 pg/ml at 2 hours after induction to a maximal level of 1058 pg/ml at 24 h after induction. There was also a gradual increase in IL-2 levels from 245 pg/ml at 2 h of induction to a maximal level of 970 pg/ml after 24 h of induction (Fig. 3 and 4).
Fig. 3.
Quantitation of IFN-γ in DC-CIK cells
Fig. 4.
Quantitation of IL-2 in DC-CIK cells
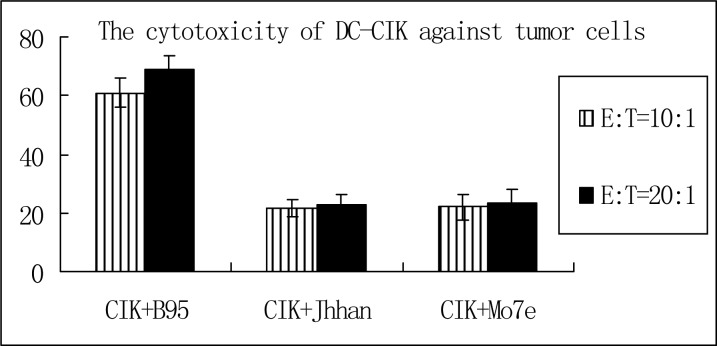
Cytotoxicity of DC-CIK cells: Using the MTT assay, we showed that DC-CIK cells had the highest cytotoxic activity against B95 cells. The cytotoxic activity of DC-CIK cells against B95 cells was higher than 60% when the ratios of effector cells to target cells were 10:1 or 20:1. At these ratios, the cytotoxic activity of DC-CIK cells against Jhhan cells was 21.51% and 22.54%, respectively, while cytotoxic activity against M07e cells was 22.17% and 23.42%, respectively (Table 2 and Fig. 5).
Table 2.
Cytotoxicity of dendritic cells Cytokine-induced killer cells against different cancer cell lines [Mean (SD)%]
| Group | Cytotoxicity | |
|---|---|---|
| Effector/target cell ratio10:1 | Effector/target cell ratio20:1 | |
| Acute B-lymphoblastic leukemia cell line (B95) | 61.02 (5.24) | 68.78 (4.92) |
| Acute T-lymphoblastic leukemia cell line (Jhhan) | 21.51 (3.05) | 22.54 (3.57) |
| megakaryocytic leukemia cell line (M07e) | 22.17 (4.37) | 23.42 (4.83) |
SD: Standard Deviation
Fig. 5.
Cytotoxic activity of DC-CIK cells against different types of cancer cells (E: effect cell T: target cell)
Determination of CD4+CD25+T reg cells in the different treatment groups: We found a significant increase in the proportion of CD4+T cells in the three treatment groups (t=4.89, P<0.05; t=5.28, P<0.05 and t=4.68, P<0.05, respectively) when compared with the negative control group. There was also a significantly higher number of CD4+ CD25+ T reg cells in the three treatment groups when compared with the negative control group (t=3.79, P<0.05; t=4.66, P<0.05 and t=5.74, P<0.05, respectively) (Table 3).
Table 3.
Proportion of CD4+CD25+ Treg cells in different groups [mean (SD),%)
| CD4+T | CD4+ CD25+Treg | |
|---|---|---|
| blank control | 22.56 (1.68) | 2.29 (0.91) |
| Negative control | 23.39 (2.41) | 2.67 (0.76) |
| Treatment group 1 | 36.82 (3.63)* | 6.83 (1.03)* |
| Treatment group 2 | 40.26 (2.54)* | 7.05 (0.69)* |
| Treatment group 3 | 45.25 (3.23)* | 7.89 (1.25)* |
P<0.05 vs negative control group; SD: Standard Deviation
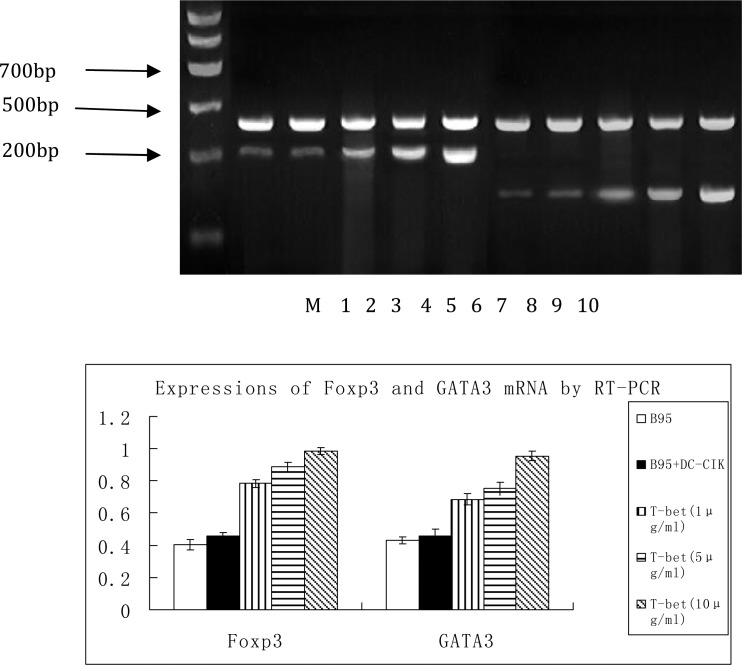
Determination of Foxp3 and GATA3 mRNA expression in the different treatment groups: We demonstrated a baseline expression of Foxp3 (215 bp) and GATA3 (150 bp) mRNA in the negative control group. Treatment with mouse anti-human T-bet monoclonal antibody resulted in a significant increase in the mRNA expression levels of Foxp3 (t=4.894, P<0.05; t=5.639, P<0.05 and t=4.752, P<0.05, respectively) and GATA3 (t=4.491, P<0.05; t=5.298, P<0.05; t=5.056, P<0.05, respectively) in the three treatment groups when compared with the negative control group (Fig. 6).
Fig. 6.
mRNA expression of Foxp3 and GATA3 in DC-CIK cells
M marker; 1. mRNA expression of Foxp3 in the blank control group; 2. mRNA expression of Foxp3 in the negative control group; 3. mRNA expression of Foxp3 in treatment group 1; 4. mRNA expression of Foxp3 in treatment group 2; 5. mRNA expression of Foxp3 in treatment group 3; 6. mRNA expression of GATA3 in the blank control group; 7. mRNA expression of GATA3 in the negative control group; 8. mRNA expression of GATA3 in treatment group 1; 9. mRNA expression of GATA3 in treatment group 2; 10. mRNA expression of GATA3 in treatment group 3.
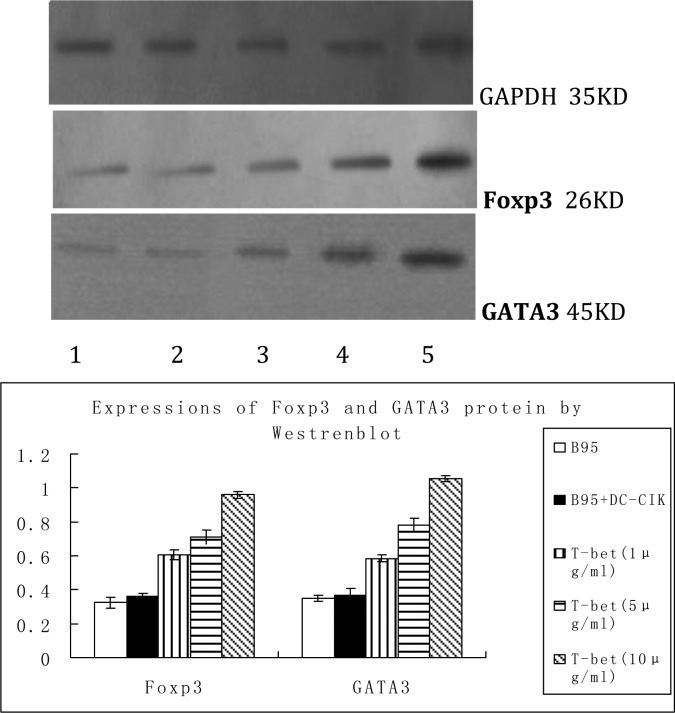
Protein expressions of Foxp3 and GATA3: We demonstrated a baseline expression of Foxp3 (26 kDa) and GATA3 (45kDa) in the negative control group. Treatment with mouse anti-human T-bet monoclonal antibody resulted in a significant increase in the protein expresson levels of Foxp3 (t=3.836, P<0.05; t=4.463, P<0.05; t=5.495, P<0.05, respectively) and GATA3 (t=4.077, P<0.05; t=3.899, P<0.05; t=4.384, P<0.05, respectively) in the three treatment groups when compared with the negative control group (Fig. 7).
Fig. 7.
Protein expression of Foxp3 and GATA3
1. blank control group; 2. negative control group; 3. treatment group 1; 4. treatment group 2; 5. treatment group 3
Discussion
Adoptive immunotherapy is a useful strategy used in the treatment of various tumors. It is performed by isolation of potential immune cells from cancer patients and treating them with a number of immunocytokines, resulting in increased numbers as well as enhanced activation and improved functioning of these immune cells. These cells, which are transfused back to the patients, recognize abnormal cells (malignant cells and virus-infected cells) and bring about 1) direct killing of such abnormal cells by the treated cells or 2) indirect killing in which immune effector cells are involved. Since their discovery in the 1970s, lymphokine-activated killer (LAK) cells, tumor-infiltrating lymphocytes (TILs) and CD3 McAb-activated killer (CD3-AK) cells have been sparingly used in clinical practice due to poor amplification efficiency and weak cytotoxicity. T lymphocytes are the main effector cells which target cancer cells in humans. Tumor-specific T lymphocyte cell numbers and their activity are the major determinants of anti-neoplastic immunity. DC-CIK cells constitute a novel heterogenous cell population, with anti-neoplastic properties similar to T lymphocytes and have been used in adoptive immunotherapy for cancers. The classical induction of DC-CIK cells was first described in 1991[1] and they have been shown to exert non-MHC-restricted cytotoxicity similar to NK cells[10, 11]. DC-CIK cells are less dependent on IL-2 and have a higher proliferative activity and more potent cytotoxic activity when compared with LAK cells, making it possible to avoid the severe side effects caused by IL-2[1]. While a majority of DC-CIK cells express T lymphocyte markers such as TCRα/β, TCRγ/δ, CD3, CD4 and CD8, a fraction of these cells express the marker for NK cells[12, 13].
In the present study, we demonstrated that the main effector cells in the DC-CIK cell population were CD3+CD8+ cells and CD3+ CD56+ cells. Our data showed that the levels of IFN-γ and IL-2 released by DC-CIK cells increased in a time-dependent manner. This suggests that DC-CIK cells continuously secrete IL-2 and IFN-γ, which are critical in promoting Th0 to Th2 shift, during the process of maturing. It is also possible that these cytokines activate DC-CIK and stimulate the production of Th1 lymphocytes with a specific immune response against cancer cells.
Our data demonstrated that DC-CIK cells exerted cytotoxic effects on different cancer cells, with the highest cytotoxic activity against B95 cells. The cytotoxic activity against B95 cells was greater than 60% when the ratios of effector cells to target cells were 10:1 and 20:1. However, increasing the ratio of effector cells to target cells had no effect on the cytotoxic activity of DC-CIK cells against Jhhan cells and M07e cells, suggesting differences in the anti-neoplastic activity of DC-CIK against different types of cancer cells. It will be interesting to investigate the mechanism underlying such differences.
Our data confirmed these studies and demonstrated the T-bet-mediated in vitro anti-neoplastic effects of DC-CIK. We also used flow cytometry to show that blocking the pathway with T-bet monoclonal antibody resulted in a higher proportion of CD4+CD25+Treg cells when compared with the negative control group. These data suggested that CD4+CD25+Treg cells were involved in the T-bet mediated down-stream pathway. In addition, we demonstrated that T-bet monoclonal antibody treatment resulted in higher levels of Foxp3 and GATA3 when compared with the negative control group, suggesting that Foxp3 and GATA3 were involved in the T-bet mediated down-stream mechanism.
The immune balance between Th1 and Th2 cells along with an appropriate immune response from these two cell populations play an important role during cancer therapy. The immune response of DC-CIK cells was previously reported to be mediated by Th1 cells. While T-bet is the major regulator promoting Th1 cell differentiation, GATA3 is the critical regulator facilitating Th2 cell differentiation. The CD4+CD25+Treg cell population consists of a group of novel regulatory cells which exert a negative regulatory effect on the immune response and play a role in immune regulation by Th1 cells and Th2 cells[6, 8]. Foxp3 plays a key role in regulating the differentiation of CD4+ CD25+ Treg cells[7, 14].
We showed that T-bet treatment resulted in an increased expression of Foxp3, GATA3 and CD4+ CD25+Treg. These findings suggested that blocking the Th1 pathway could result in an increase in the number of Treg cells and Th2 cells and implied that the anti-neoplastic effects of DC-CIK cells were mediated through activation of the Th1 pathway and suppression of Treg and the Th2 pathway. We propose the following pathway to explain the mechanism underlying the anti-neoplastic effects of DC-CIK cells: (1) The T-bet pathway, together with the first signal, promotes the proliferation and activation of lymphocytes, leading to a shift from a Th0 response to a Th1 response along with an inhibition of the shift from Th0 response to Treg and Th2 response. These effects are accompanied by increased production of IL-2 and IFN-γ (Th1 cytokines), which promotes the secretion of cytoplasmic granules containing BLT esterase. Cytoplasmic granules penetrate the target cells, resulting in exocytosis and cell lysis. (2) DC-CIK cells secrete a large number of cytotoxic cytoplasmic granules which are cytolytic to target cells. (3) Activated DC-CIK cells secrete a number of cytokines including IFN-γ, IL-2 and TNF, which directly attack cancer cells, but also have an indirect effect by regulating the immune response. DC-CIK cells in culture have been reported to induce apoptosis of cancer cells via the expression of FasL. The binding of FasL to cancer cells was shown to counteract the resistance to apoptosis induced by the Fas-FasL interaction in cancer cells. In addition, the interaction between FasL and cancer cells exerted an anti-neoplastic effect via induction of apoptosis[15].
Limitations and Applications: Further research in vivo would provide additional evidence to support our conclusion. The study should discuss other killing-tumor methods of cytokine-induced killer cell, such as Fas-FasL method.
Conclusion
In summary, our results demonstrated the cytotoxic effects of cytokine induced killer cells. Foxp3 and GATA3 played a role in the T-bet mediated anti-neoplastic effects of DC-CIK cells, characterized by activation of the Th1 pathway and suppression of the Th2 and Treg pathways. Our results provide a theoretical basis for adoptive immunotherapy for leukemia and can help elucidate potential new molecular mechanisms underlying cancer immunotherapy.
Acknowledgment
The study including human and animals was approved by the Ethics Committee of the Wuhan University. Informed consent was obtained from all patients before participation in this study.
Conflict of Interest
None
References
- 1.Schmidt-Wolf IGH, Negrin RS, Kiem H, et al. Use of a SCID mouse/human lymphoma model to evaluate cytokine-induced killer with potent antitumor cell activity. J Exp Med. 1991;174(1):139–49. doi: 10.1084/jem.174.1.139. [DOI] [PMC free article] [PubMed] [Google Scholar]
- 2.Kim HM, Lim J, Park SK, et al. Antitumor activity of cytokine-induced killer cells against human lung cancer. Int Immunopharmacol. 2007;7(13):1802–7. doi: 10.1016/j.intimp.2007.08.016. [DOI] [PubMed] [Google Scholar]
- 3.Kim HM, Kang JS, Lim J, et al. Antitumor activity of cytokine-induced killer cells in nude mouse xenograft model. Arch Pharm Res. 2009;32(5):781–7. doi: 10.1007/s12272-009-1518-1. [DOI] [PubMed] [Google Scholar]
- 4.Motohashi S, Nakayama T. Clinical applications of natural killer T cell-based immunotherapy for cancer. Cancer Sci. 2008;99(4):638–45. doi: 10.1111/j.1349-7006.2008.00730.x. [DOI] [PMC free article] [PubMed] [Google Scholar]
- 5.Steinman RM, Hemmi H. Dendritic cells: translating innate to adaptive immunity. Curr Top Microbiol Immunol. 2006;311(1):17–58. doi: 10.1007/3-540-32636-7_2. [DOI] [PubMed] [Google Scholar]
- 6.Bachiega TF, Orsatti CL, Pagliarone AC, et al. Th1/Th2 cytokine production by clove-treated mice. Nat Prod Res. 2009;23(16):1552–8. doi: 10.1080/14786410902809328. [DOI] [PubMed] [Google Scholar]
- 7.Li YN, Zhou YF, Shu SN, et al. Effects of acute and chronic murine cytomegalovirus infections on the ratio of regulatory T cells and expression of Th1/Th2 transcription factors T-bet/GATA-3. Zhonghua Yi Xue Za Zhi. 2008;88(42):2999–3002. [PubMed] [Google Scholar]
- 8.Di Ianni M, Del Papa B, Cecchini D, et al. Immunomagnetic isolation of CD4+CD25+FoxP3+ natural T regulatory lymphocytes for clinical applications. Clin Exp Immunol. 2009;156(2):246–53. doi: 10.1111/j.1365-2249.2009.03901.x. [DOI] [PMC free article] [PubMed] [Google Scholar]
- 9.Rutitzky LI, Smith PM, Stadecker MJ. T-bet protects against exacerbation of schistosome egg-induced immunopathology by regulating Th17-mediated inflammation. Eur J Immunol. 2009;39(9):2470–81. doi: 10.1002/eji.200939325. [DOI] [PMC free article] [PubMed] [Google Scholar]
- 10.Motohashi S, Nakayama T. Natural killer T cell-mediated immunotherapy for malignant diseases. Front Biosci. 2009;1(1):108–16. doi: 10.2741/s10. [DOI] [PubMed] [Google Scholar]
- 11.Ayello J, van de Ven C, Cairo E, et al. Characterization of natural killer and natural killer-like T cells derived from ex vivo expanded and activated cord blood mononuclear cells: implications for adoptive cellular immuno-therapy. Exp Hematol. 2009;37(10):1216–29. doi: 10.1016/j.exphem.2009.07.009. [DOI] [PubMed] [Google Scholar]
- 12.Boissel L, Tuncer HH, Betancur M, et al. Umbilical cord mesenchymal stem cells increase expansion of cord blood natural killer cells. Biol Blood Marrow Transplant. 2008;14(9):1031–8. doi: 10.1016/j.bbmt.2008.06.016. [DOI] [PubMed] [Google Scholar]
- 13.Tanaka J, Sugita J, Asanuma S, et al. Increased number of CD16(+)CD56(dim) NK cells in peripheral blood mononuclear cells after allogeneic cord blood transplantation. Hum Immunol. 2009;70(9):701–5. doi: 10.1016/j.humimm.2009.06.002. [DOI] [PubMed] [Google Scholar]
- 14.Di Ianni M, Del Papa B, Cecchini D, et al. Immunomagnetic isolation of CD4+CD25+FoxP3+ natural T regulatory lymphocytes for clinical applications. Clin Exp Immunol. 2009;156(2):246–53. doi: 10.1111/j.1365-2249.2009.03901.x. [DOI] [PMC free article] [PubMed] [Google Scholar]
- 15.Kornacker M, Moldenhauer G, Herbst M, et al. Cytokine-induced killer cells against a utologous CLL: direct cytotoxic effects and induction of immune accessory molecules by interferon-gamma. Int J Cancer. 2006;119(6):1377–82. doi: 10.1002/ijc.21994. [DOI] [PubMed] [Google Scholar]


