Abstract
The technology of musculoskeletal MRI imaging is advancing at a dramatic rate. MR imaging is now done at medium and higher field strengths with more specialized surface coils and with more variable pulse sequences and post processing techniques than ever before. These numerable technical advances are advantageous as they lead to an increased signal to noise ratio and increased variety of soft tissue contrast options. However, at the same time they potentially produce more imaging artifacts when compared with past techniques. Substantial technical advances have considerable clinical challenges in musculoskeletal radiology such as postoperative patient imaging, cartilage mapping, and molecular imaging. In this review, we consider technical advances in hardware and software of musculoskeletal MR imaging along with their clinical applications.
Keywords: Magnetic resonance imaging, high field imaging, phased array coils, metallic implants, isotropic imaging, cartilage mapping
Introduction
Since its introduction in the 1970’s, magnetic resonance imaging (MRI) has revolutionized the diagnosis and treatment of musculoskeletal disorders. MR imaging has proven to be a valuable imaging tool in almost every joint in the body as a result of its ability to assess a wide range of anatomy and pathology ranging from ligamental injuries to articular cartilage lesions (1–3). With its multiplanar capabilities and excellent soft-tissue contrast, MRI has established itself as one of the most promising modalities for noninvasive evaluation of the musculoskeletal system (4, 5).
The annual rate of MRI knee studies has increased by 140% between 1991 and 1995 (6). The rate of arthoplasty procedures has also been projected to substantially increase throughout the next few decades (7). The field of musculoskeletal radiology is constantly advancing as MR imaging applications in the musculoskeletal realm continue to grow enormously. Remarkable advances have taken place in both hardware and software technology that allow for improved visualization of anatomy and pathology. Along with the numerous benefits however, come various new technical challenges that must be considered and understood.
High field imaging
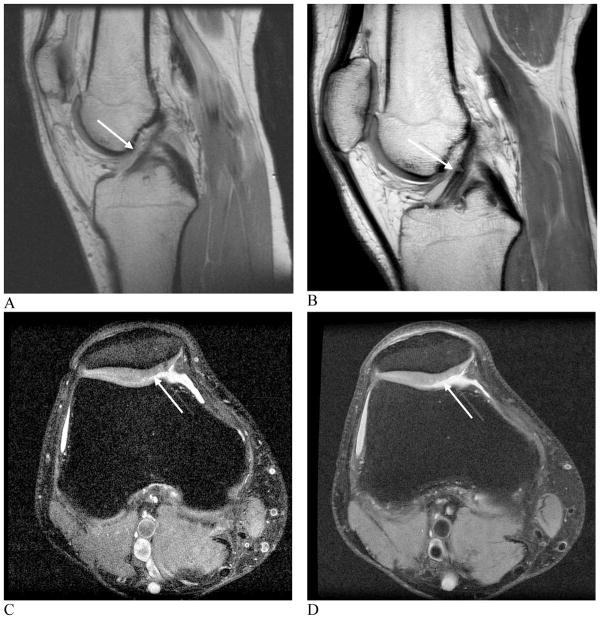
Traditionally, most MR imaging of the musculoskeletal system is done at intermediate field strengths of 1.5T or lower. However, imaging at 3.0T has become increasingly more common for clinical evaluation while other higher field systems are being evaluated in the research realm. Despite initially being used for neurological imaging, availability of specialized coils and numerous studies have confirmed the benefits and abilities of higher field systems in musculoskeletal imaging (8–10). The most valuable benefit includes an improved signal-to-noise (SNR) which can result in increased image resolution and decreased exam time (Fig. 1). However, with the increase to a 3.0 T or higher field strength comes numerous issues that must be considered in order to optimize its intrinsically superior imaging capabilities.
Figure 1. Images showing comparison between 1.5 and 3.0 T field imaging.
A and B, sagittal proton density-weighted images at 1.5 T (A) and 3.0 T (B) of a healthy anterior cruciate ligament. C and D, axial, fast spin echo images at 1.5 T (C) and 3.0 T (D) of a cartilage lesion. Better visualization of the anterior cruciate ligament and cartilage legion is possible at 3.0 T when compared with 1.5 T due to increased SNR (arrows, A, B, C, D).
(Images A and B reproduced with permission of the Seminars in Roentgenology. Images C and D courtesy of S. Reeder, University of Wisconsin -Madison).
While it appears that doubling the field strength from 1.5T to 3.0T should result in double the intrinsic SNR, changes in T1 relaxation times and complexities of coils at higher field strengths generate an SNR increase of slightly less than double. Research done to measure the changes in relaxation times have shown that T1 relaxation times must be increased by 14–20% when moving from 1.5T to 3.0T (9). Increased off-resonance effects may result in higher receiver bandwidth for some sequences, which in turn, reduces SNR.
There are several technical considerations that must be addressed in order to take full advantage of 3.0T and higher field imaging systems. The most prominent issues include: chemical shift, fat saturation and radiofrequency power deposition. Due to the linear relationship between the difference between resonant frequencies of fat and water protons and the field strength, chemical shift displacement artifacts will double in the frequency encoding direction when moving from 1.5T to 3.0T. Doubling the receiver bandwidth is one way to resolve this issue. Doubling the bandwidth not only corrects the chemical shift artifact, but may also allow for an increase in the number of slices acquired, decrease metal artifacts, shorten echo times, and reduce echo spacing. Conversely, doubling the bandwidth decreases the SNR by a factor of √2 because the overall readout window length is shorter (Fig. 2).
Figure 2. Proton density-weighted images of the healthy knee at 3.0 T.
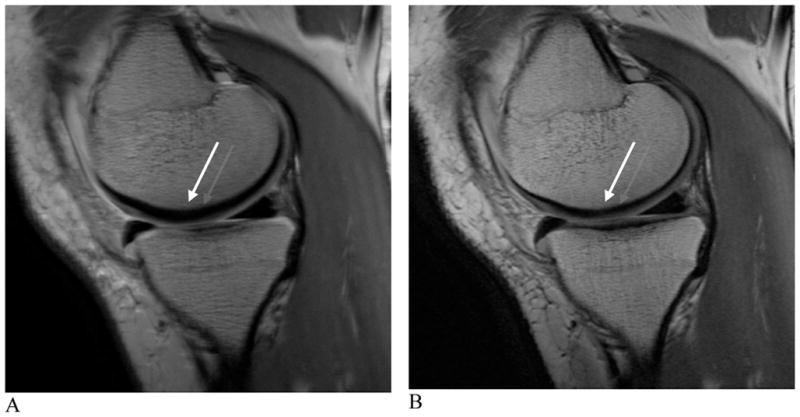
A and B, sagittal images with bandwidths of 15 kHz (A) and 42 kHz (B). An approximate three-fold increase in bandwidth can significantly reduce chemical shift. The anatomy is more easily visualized and much sharper after the bandwidth increase (arrows, A, B).
Due to the chemical shift difference doubling between the fat and water resonance at 3.0T and 1.5T, fat saturation is much easier. The peaks are twice as far apart with a chemical shift of 440 Hz, meaning that the lengths of the fat saturation pulses can be shortened from about 16 msec to 8 msec (11). A notable advantage of this is the ability to acquire more slices at a given TR, bandwidth and slice thickness.
Radiofrequency power deposition is a third technical issue that must be considered, especially in fast spin-echo sequences used in musculoskeletal imaging as they have the potential for high radiofrequency power. Radiofrequency power is proportional to the square of field strength; therefore it will quadruple when field strength is doubled from 1.5T to 3.0T (12, 13). While the overall deposition is dependent upon the number of radiofrequency pulses and amplitude, using rapid imaging sequences with lower flip angles may minimize the deposition. In exam regions with small volumes and transmit receive coils, such as the knee, this complication should be diminished since the radiofrequency power that is deposited is a function of the tissue volume excited (13) (Fig. 3).
Figure 3. T1-weighted fast spin-echo images of the healthy knee at 3.0 T.
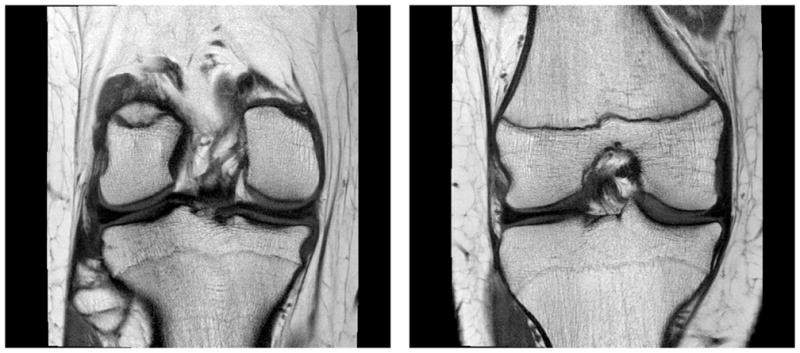
A and B, coronal images with TR/TE = 800/20 ms and echo train length of 4 resulted in an image with 33% of the average radiofrequency power limit compared with multi-slice spin echo. Slight blurring can be visualized due to the use of a short TE and multiple echoes.
While it is much more advantageous to use a localized transmit/receive RF coil than a body coil transmit, if a body coil transmit is used, shortening exam time or lowering the refocusing pulses would help limit SAR. The FDA limitation for the whole body for a 15-minute period for all patients is 4 W/kg and for extremities over a period of 5 minutes the local SAR limit is 12 W/kg (14, 15).
Imaging of the musculoskeletal system at 7.0T is in an early phase, with many technical problems including SAR, chemical shift, and B1 homogeneity (16–18). Routine imaging at 7.0T could provide higher SNR, higher resolution, or more rapid imaging (Fig. 4). Multi channel coils with parallel transmission capability are under development, which promise to improve image quality and lower SAR.
Figure 4.
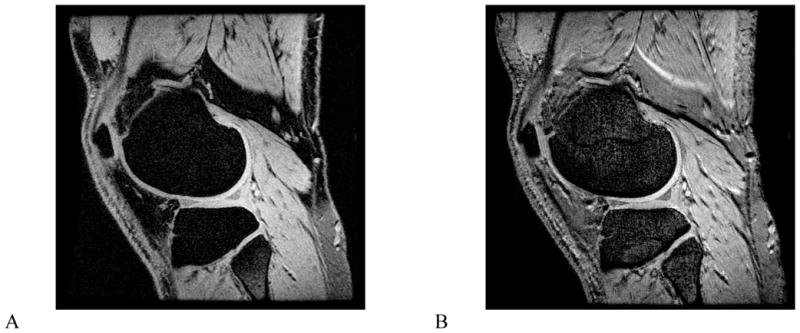
Images from a 7.0T MRI system with a two-channel coil. Fat-suppressed spoiled gradient echo image (A), and fat-suppressed gradient echo image (B). Imaging at 7.0T can improve spatial resolution of decrease examination times. Images courtesy of B. Rutt and M. Saranathan, Stanford University.
Phased array coils/parallel imaging
As technology continues to advance, higher field strength MR imaging systems are being developed to increase signal-to-noise ratio and improve resolution. Often however, tissue/field interactions result due to a higher precession frequency and shorter wavelength, making it difficult to acquire high quality images. Phased array coil technology was originally developed to improve the intensity uniformity of MR images obtained using surface coils and high field imaging, while preserving their inherent gain of signal-to-noise ratio (SNR). Recently, new methods for encoding the MRI signal are being adopted that fall under the generic name of parallel imaging. Parallel imaging methods exploit the spatially-varying sensitivity profiles of the surface coil elements within the array to extend the imaging field of view without adding additional scan time. This strategy allows a net reduction in the amount of time required to obtain the MR image up to a factor related to the number of independent coil channels within the array. Multiple channels are required to process these data independently, and in principle, an eight-channel coil would be able to image eight times as fast, assuming an ideal geometry and low noise. However, practical considerations limit image acceleration to values below the maximum allowed by theory.
The clinical impact of parallel imaging will be considerable for the higher field MRI systems, most commonly, 3T. The use of parallel imaging technology can not only reduce scan time and the number of radiofrequency (RF) pulses required to form an image, but can also be used to shorten the echo time which proves to be a significant improvement, especially for musculoskeletal imaging (Fig. 5). This will be important in limiting the total RF power to regulatory guidelines, particularly for body imaging at 3T. When parallel imaging is employed, image uniformity and SNR both also are compromised as scan times are reduced. Innovative phased array coil designs with up to 32 or more channels have been developed to accommodate parallel imaging methods at higher magnetic fields. The newest MR imaging systems are being offered with the receiver system designed to have the capacity for a highly scalable number of individual RF channels. The maximum number of RF channels that can practically be incorporated into the design of clinical MRI systems is currently a matter of considerable engineering controversy.
Figure 5. Sagittal 3D-FSE images acquired at 3.0T.
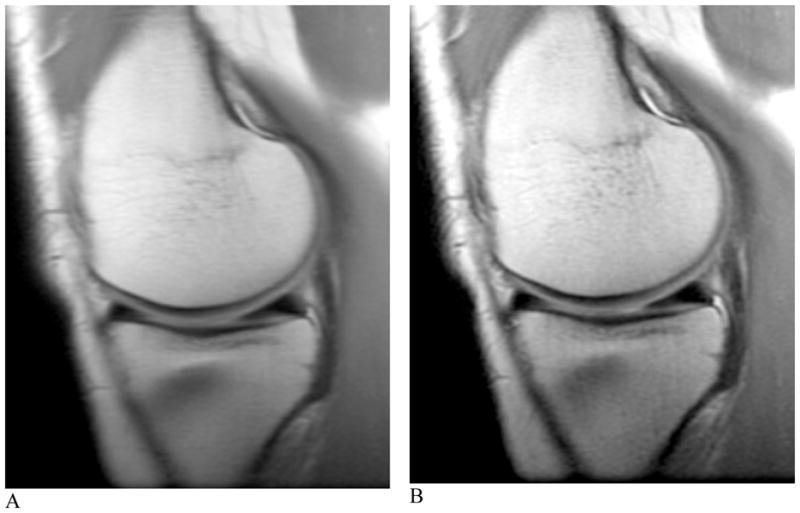
A) Acquired without ARC parallel imaging and ETL 120. B) Acquired with ARC parallel imaging, a net acceleration of 3 and ETL 40. The image acquired and reconstructed with ARC parallel imaging (B) is significantly less blurry however has a lower SNR than (A).
The advent of phased array coils and parallel imaging has increased the feasibility of whole body MR imaging without considerable compromises in spatial resolution. Although whole body MR imaging of the musculoskeletal system is limited to date, it has important applications in the evaluation of musculoskeletal diseases. Resulting from its exquisite soft-tissue contrast, MR imaging provides a more accurate assessment of bone marrow and adjacent soft tissue infiltration and enables the visualization of marrow components (19). These advantages have resulted in the increasing use of whole body MRI as an alternative to multi-modality approaches. Especially useful in the realm of oncologic imaging, whole body MRI enables a more precise evaluation of tumor staging and recurrence. This is of particular importance as it has been observed that up to 40% of skeletal metastases lie outside the FOV used for a routine axial skeleton assessment (20).
Orthopedic hardware imaging
Metallic implants are increasingly more common in the aging population. In 2003 alone, 230,000 hip replacements and 450,000 knee replacements were performed, while an average of 78,000 knee and hip replacement revisions per year are necessary (7). Radiography has traditionally been used in preoperative planning, as it is quick and cheap. However it is not sensitive to soft tissue abnormality. Computed tomography (CT) provides an opportunity to both acquire the cross sectional data needed for postoperative patient monitoring and evaluate painful implants, however CT results in artifacts from beam hardening and is not sensitive to marrow edema. MR imaging has shown the most promising results in imaging orthopedic hardware as it allows for cross sectional imaging and flexible soft-tissue contrast. However, MR imaging is also not ideal, as it suffers from imperfect corrections and susceptibility induced artifacts and voids. Not all implanted metals are MR safe, however this discussion takes into consideration those that are. There are several factors that must be considered in order to fully optimize MRI as a tool for imaging around orthopedic hardware.
A homogenous readout field, relying upon unit of parts-per-million and susceptibility differences, eddy currents and diffusion are fundamental to MR imaging. The issue of susceptibility, the most prominent problem in imaging metal with MR systems, arises since titanium and surgical steel lie several orders of magnitude outside of the range at which MR imaging typically operates (21). Susceptibility differences result in inhomogeneity of the main magnetic field disrupting spatial encoding mechanisms. Simple modifications can be made to slightly improve imaging around metal. Gradient-echo imaging of soft-tissue adjacent to metal is nearly impossible since the local field inhomogeneity results in rapid dephasing causing signal voids. Spin-echo imaging is the preferred technique because of its rephasing effects, however spatially dependent artifacts are still present (22).
Several alternative, more developed techniques have been proposed in attempt to significantly improve MR imaging around metal. Recently, pulse sequences specialized for imaging around orthopedic hardware have been relatively successful in dealing with these artifacts in a research based setting. It is important to note that scans should not be performed with fat saturation, as the field inhomogeneity typically results in failure of fat suppression. When looking for homogenous fat suppression around the hardware, Iterative Decomposition of water and fat with Echo Asymmetry and Least-squares estimation (IDEAL) fast spin-echo imaging has proven more reliable than fat saturation, as slowly to moderately varying field inhomogeneity can be corrected in the reconstruction (23–25). IDEAL is a Dixon-based method for separating water and fat that allows for water-only and fat-only images to be obtained in the presence of the inhomogeneity caused by the hardware. In addition, T1-weighted images after gadolinium with water/fat separation can be acquired. As it requires three acquisitions, IDEAL results in an increase in exam time, which can however, be offset with the use of parallel imaging or protocol modification.
Prepolarized MRI has shown to be an extremely promising technique with which to reduce artifact around hardware. This new, inexpensive approach to MRI consists two electromagnets; one is a homogenous low-field readout magnet while the second is a high-field polarizing magnet that can be somewhat inhomogeneous. This system creates two dynamic magnetic fields: a polarizing field, which creates the sample magnetization and a readout field, which determines the acquisition frequency. As opposed to the traditional single static magnetic field, these dual dynamic magnetic fields provide the advantage of a low field read out which results in shift reduction of about 30 fold (26). Prepolarized MR imaging, although helpful in resolving several of the issues that arise when imaging around metal, is not yet clinically available.
Another method, view angle tilting (VAT) which works on reducing in-plane artifact, allows for substantial reduction of in-plane distortion artifacts, even in regions of rapid field variations. VAT employs the use of a gradient on the slice select axis during readout of equal amplitude to the slice select gradient resulting in nearly perfect reregistration of off-resonance spins (27). However, VAT does nothing to correct distortions in the through-slice direction, although work is being done to improve slice profile distortions (22). It is important to note however, that even with these improvements, RF shielding near certain hardware may still be limiting. Two innovative techniques called Slice Encoding for Metal Artifact Correction (SEMAC) and Multiple-Acquisition with Variable Resonances Image Combination (MAVRIC) have exhibited great potential in correcting metal artifact. The SEMAC technique is achieved by combining the VAT principle with additional phase encoding steps in the slice-dimension to fully resolve slice selective distortions (28).
The MAVRIC technique decreases encoding errors within individual Fourier reconstructions by employing several spectrally unique 3D acquisitions. MAVRIC is dependent upon traditional 3D encoding techniques as it collects several acquisitions at different transmission and reception frequencies to construct an image of the whole implant region. Since MAVRIC does not utilize slice or slab selection gradients, the spins within a MAVRIC sub image experience bandwidths determined only by the spectral properties of the applied RF pulses. The Gaussian refocusing pulses, applied with slight overlap between adjacent sub images, used in MAVRIC produce a flat sum of squares (SOS) spectral response, which allow construction of the composite MAVRIC image (29).
While artifact reduction is quite noticeable, minor residual artifacts are still present in both SEMAC and MAVRIC techniques (Fig. 6). These artifacts result from using different RF pulses and spectral properties as well as a slice-selective gradient in SEMAC. Both techniques have demonstrated compatibility with partial-Fourier techniques and autocalibrated parallel imaging in an effort to decrease exam time (30, 31). Although still primarily in the research stage, both SEMAC and MAVRIC allow visualization of anatomy in close proximity to metallic implants with significantly decreased artifact at reasonable exam times.
Figure 6.
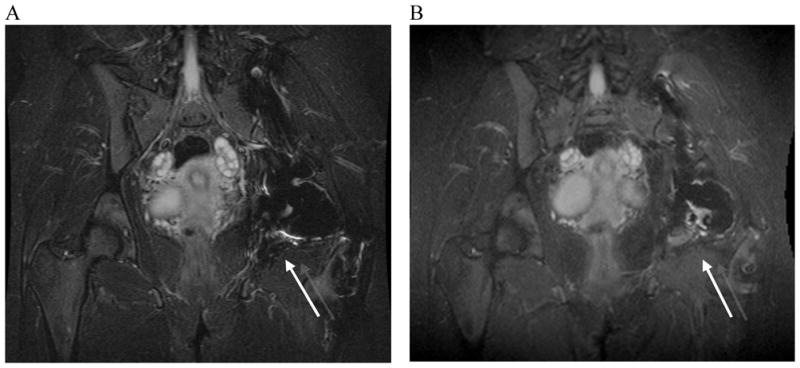
Standard fast spin-echo inversion-recovery and SEMAC inversion recovery images of a patient with a history of chondrosarcoma and total hip replacement. A) 2D-FSE inversion recovery image. B) SEMAC inversion recovery image. The 2D-FSE inversion recovery image (A) shows artifact inferior to total hip replacement (arrow). The SEMAC inversion recovery image (B) shows an area of high signal in the bone marrow (arrow). High signal was suspicious of recurrent tumor.
Direct and Indirect MR Arthrography
MR arthrography is an important alternative to conventional MR imaging particularly in the evaluation of a variety of joint disorders. More commonly, a direct method of MR arthrography is utilized. In this technique, dilute gadolinium is injected directly into the joint of interest under image guidance. Direct MR arthrography is valuable as it distends the joint compartment allowing for better delineation and visualization between tissues. In a similar manner, it allows for detection of abnormal communication between extra-articular soft tissues and joint compartments. Drawbacks of direct MR arthrography primarily include the facts that it is an invasive procedure and that it exposes the patient to radioactivity.
An alternative technique that has been recently gaining support is the indirect MR arthgraphy technique. When image guidance is not accessible or an invasive procedure is contraindicated, indirect MR arthrography is often utilized. In this technique, gadolinium is administered intravenously, rendering a physician and fluoroscopy unnecessary. A higher contrast load is required since it is not injected directly into the joint and either active or passive exercise must be performed after injection and before imaging to allow the contrast to reach the joint of interest. Indirect MR arthrography can be particularly taken advantage of in joints that have less of a capacity for distension as this method allows for considerably less capsular distension when compared with direct MR arthrography. It must be taken into account when using indirect MR arthrography that all components of the joint, rendering the ability to visualize abnormal communication between joint compartments unachievable. In addition, the level of joint enhancement is dependent upon several, often variable aspects including joint volume, intra-articular pressure, blood concentration of contrast, inflammation and permeability, synovial area and delay time post contrast injection (32, 33). Despite the drawbacks of both direct and indirect MR arthrography, these techniques have proven useful in the evaluation of most joints including the shoulder, elbow, wrist, hip, knee and ankle (34–36).
Kinematic imaging
Until recently, most models of joint motion have been developed from external measurements of limb movements using motion capture methods and cadaveric studies (37, 38). These measurements are highly contested; motion capture methods are limited as they are based upon surface anatomy while cadaveric studies fail to replicate in vivo conditions (39). Kinematic MR imaging, which involves obtaining static images of joints at multiple positions, has increasingly been applied to the assessment of joint mechanics (40). Kinematic and similar forms of MR imaging can be crucial to the diagnosis of various pathologies that are associated with particular movements, positions or forces. Challenges encountered with MR imaging of joint kinematics are often physiological and are constrained by the size of the bore and RF coil, which often limit range of motion.
Cine phase-contrast (cine-PC) MRI has been used to characterize the three-dimensional kinematics of certain joints in dynamic conditions (41). However this technique is limited in that it requires a large number of repeated movements (39).
With real-time imaging, subjects can be imaged during dynamic, weight-bearing activities with the acquisition of a time series of single-slice images from only one motion cycle. Real-time MR imaging, as opposed to static or semi-static imaging, can help evaluate the interactions of bony and soft tissue anatomy and the relative positions of each through a certain range of motion.
Studies have demonstrated that real-time MR imaging can measure internal motions of slowly moving joints when 2.0 mm accuracy is adequate (42). Currently, a primary limitation of real-time MR imaging is its inability to acquire kinematic measurements of very fast moving joints. While biplane radiography is capable of obtaining these measurements, it does not acquire the movements of soft tissues and it emits ionizing radiation (42). Several of these new technologies show the potential of MR imaging of joint motion. These developments will greatly assist in the diagnosis, treatment and modeling of the musculoskeletal system.
MR Spectroscopy
As previously mentioned and due to its high contrast resolution, MR imaging is the preferred imaging modality for identification of soft tissue and bony abnormalities. However, despite its high sensitivity for malignancy, MR imaging has a low specificity resulting in the excision or need for biopsy of several indeterminate for further classification or diagnosis (43–45). Although proton MR spectroscopy (MRS) has been primarily applied to other organ systems, its application in the musculoskeletal system has been increasingly studied. With is ability to provide histologic composition noninvasively, it has become one of the preferred methods for malignancy and lesion characterization. Currently, one of the most prominently studied metabolites with MRS in the musculoskeletal system is choline. As a component of the phospholipid metabolism in cell membranes, choline is an indicator of cell membrane turnover, characteristic of malignant lesions (46–48). Recent studies have shown that choline can reliably be identified in large malignant bone and soft tissue tumors and malignant skeletal sarcomas by using a multiecho point-resolved spectroscopic protocol at 1.5 T and a multivoxel technique at 1.5 T respectively (49, 50). However, since choline SNR varies with magnetic field strength, coil type, pulse sequence efficiency, lesion size and distance between the coil and region of interest, much research is being performed to develop more robust techniques of quantifying metabolites like choline (51). Preliminary results have proven the feasibility of such techniques by using water as an internal reference compound to obtain absolute quantifications of choline (51). Although this water referencing method assumes constant water content, it is a promising technique with which choline concentrations can be determined in the musculoskeletal system.
Additional metabolite levels, for example, myocellular lipids are able to be quantified with the use of proton MRS (52). These lipids are stored either extra-myocellularly as subcutaneous or interstitial adipose tissue or intra-myocellularly as droplets in muscle cytoplasm. Evidence shows that extra-myocellular lipids (EMCL) are fairly metabolically inert whereas intra-myocellular lipids (IMCL) are readily mobilized and turned over in a matter of hours (53). Quantification of IMCL can be significant as the droplets are in contact with mitochondria and provide a vast amount of energy during long-term endurance exercise and are negatively correlated with insulin sensitivity (54–56). Since the application of MR spectroscopy upon the musculoskeletal system is relatively recent, further investigation of implementations, methodologies and standardizations are warranted.
Diffusion Tensor Imaging
Diffusion tensor imaging (DTI), which obtains directionality and magnitude measurements of water diffusion, is a more advanced form of diffusion weighted imaging. DTI acquires additional details regarding tissue microstructure by allowing diffusion anisotropy effects to be maximally obtained, characterized and employed. DTI has been applied primarily in the brain and myocardium, however recently, its benefit to musculoskeletal imaging has been a large area of research. To date, DTI has been most advantageous in imaging the fiber orientation and direction of complex muscle fibers as well as imaging the extent of degradation of articular cartilage.
The application of DTI to the musculoskeletal system has also brought about several technical considerations that must be reconciled in order to optimize its use. Principal of these issues, is the relatively short T2 values in the body tissues which constrains SNR. Increasing the number of averages necessary will minimize noise thereby increasing SNR, however this comes at the cost of scan time (39, 57).
Upon optimization, DTI provides precise, noninvasive characterization of muscle fascicle arrangement, which is integral for the comprehension of muscular function and the construction of internal architectural muscular models (39). Along the same lines, and upon the assumption that damaged muscle tissues are disordered as opposed to ordered in healthy muscle tissues, DTI provides an avenue with which to characterize skeletal muscle injury (58). In addition, DTI has proven effective in the assessment of articular cartilage as it has the potential to detect early alterations in the arrangement of collagen fibers (59).
Isotropic imaging
Conventionally, MRI of the musculoskeletal system is performed with two-dimensional (2D) multislice acquisitions. Acquisitions done with fast spin-echo (FSE) are commonly used as they provide excellent visualization of anatomy, as well as pathology, including meniscal tears (60, 61), ligamentous injury (62) and cartilage damage (63). Despite these advantages, 2D-FSE has several drawbacks, the primary of which is that the voxels obtained are anisotropic, resulting in relatively thick slices in comparison to the in-plane resolution leading to partial volume artifact. Anisotropic voxels prevent the images from being reformatted into various oblique planes. As a result of the slice gaps, cartilage volume and other important structure quantifications cannot be performed accurately.
The introduction of a recently developed isotropic three-dimensional (3D) imaging technique by various manufacturers has shown much promise in visualization of anatomy and pathology as well as in cartilage quantification (Table 1). Isotropic imaging eliminates slice gaps and reduces partial-volume artifact by obtaining thin continuous slices (64, 65). The use of isotropic voxels allows images to be reformatted retrospectively into arbitrary planes in order to better visualize oblique anatomy (66). A significant decrease in scan time results as reformats can be manipulated from only one acquisition, as opposed to the multi-plane acquisitions necessary with 2D-FSE. 3D-FSE scans can, however, be limited by blurring; extended echo trains are making this technique more feasible. Although still in the research phase, isotropic imaging of the musculoskeletal system shows promising results (Fig. 6).
Table 1.
Chart displaying sequences from various manufacturers.
The names of 3D-Fast Spin Echo, Steady-State Free-Precession and Gradient Echo sequences listed by manufacturer
| 3D-Fast Spin Echo | Steady-State Free-Precession | Gradient Echo | |
|---|---|---|---|
| General Electric | CUBE | GRASS | SPGR |
| Seimens | SPACE | FISP | FLASH |
| Philips | VISTA | FFE | T1 FFE |
uTE imaging
Ultrashort TE (uTE) imaging is made possible due to the fact that several of the components of human tissue have different T2 values. While tissues such as the liver and white matter have long T2 values, short T2 values ranging from hundreds of microseconds to tens of milliseconds have been recorded in ligaments, tendons, menisci, cortical bone and periostium (67). Conventional T2-weighted imaging techniques do no produce signal from tissues with short T2 values, however signal changes from long T2 spins are highlighted. uTE imaging sequences utilize TEs that are 20–50 times shorter than those utilized in conventional imaging sequences in order to detect signal changes from tissues with short T2s (68–70). Through the use of these very short echo times, uTE is able to acquire a high signal from tissues that would typically produce little to no signal, allowing for visualization of layers and defects of articular cartilage, differentiation between meniscal zones and enhancement of ligamental scar tissue (Fig. 8). It must be noted, however, that scan times can be considerable and slice selection can be challenging. Despite these drawbacks, uTE imaging technology provides a new approach with considerable potential to imaging groups of musculoskeletal tissue.
Figure 8. uTE images of patellar articular cartilage.
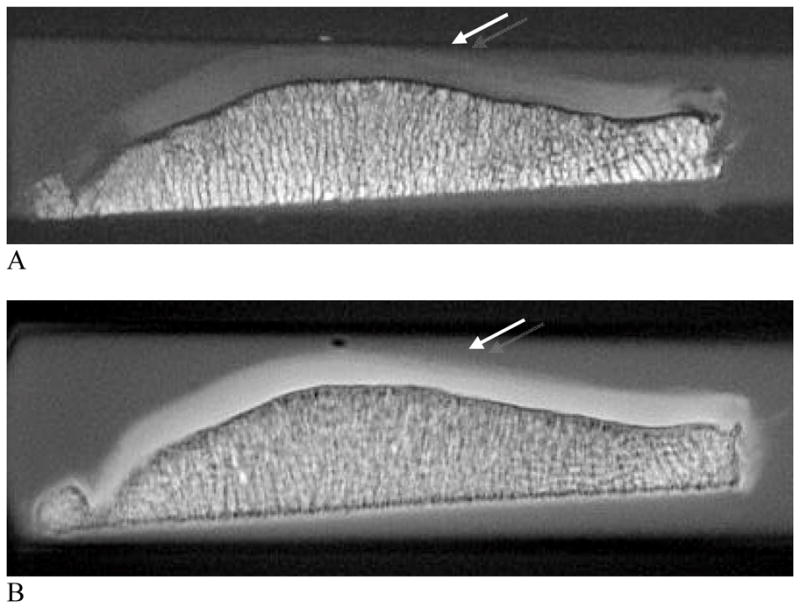
A and B, axial images acquired with TR=500 milliseconds and TE=13.9 microseconds (A) and TR=300 milliseconds and TE=8 microseconds (B). Allowing for direct visualization of short T2 components may result in signal alteration in the superficial cartilage at the median patella ridge showing subchondral bone pathology (arrows, A, B).
(Images courtesy of Christine Chung, UCSD Medical Center, San Diego, CA; Shapiro L, Staroswiecki E, Gold G. Magnetic resonance imaging of the knee: optimizing 3 Tesla imaging. Semin Roentgenol 2010; 45:7-11, reproduced with permission of the Seminars in Roentgenology)
T2 Mapping
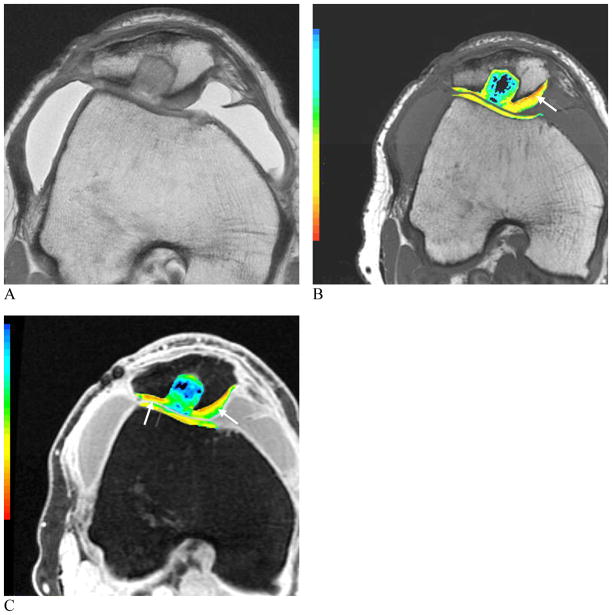
Much research has demonstrated the early physiologic changes of the cartilage matrix that occur in asymptomatic osteoarthritis. The cartilage degeneration that occurs with osteoarthritis is characterized by an increased permeability throughout the cartilage matrix, allowing for greater water quantity and motion. Increased stress is generated throughout the matrix as the hydrodynamic fluid pressure is incapable of sustaining the load support. Resulting from the excessive stress is proteoglycan-collagen matrix degeneration and cartilage tissue loss. It is important to note that T2 relaxation time is dependent upon quantity of proteoglycan-collagen matrix and water in the articular cartilage. It is here that MRI’s sensitivity to biochemical changes in the extracellular environment of the articular cartilage may allow T2 mapping to observe the earliest changes associated with osteoarthritis. Initial studies are promising as they show T2 measures to correlate with proteogylcan-collagen matrix and water changes, content and organization as physiologically displayed in the early stages of osteoarthritis (71–74) (Fig. 9).
Figure 9. Images of a 6-month post synthetic biphasic co-polymer plug repair.
Proton image (A), color T2 map depicting relaxation times (B) and color T1rho map (C). The range of T2 relaxation times is shown in the color scale with larger relaxation times shown in red and shorter relaxation times shown in blue. Early degenerative changes in the cartilage matrix can be seen in the red and orange regions (B). The range of T1rho measurements are shown in the color scale. Regions of proteoglycan loss can be seen in red and orange (C) (arrows, B, C).
(Images courtesy of Hollis Potter, Hospital for Special Surgery, New York, NY; Shapiro L, Staroswiecki E, Gold G. Magnetic resonance imaging of the knee: optimizing 3 Tesla imaging. Semin Roentgenol 2010; 45:7-11, reproduced with permission of the Seminars in Roentgenology)
Technical concerns in selection of the appropriate MR imaging technique must be taken into account when attempting to measure T2 relaxation times (75). A single exponential fit can be adequate for TEs used in conventional imaging. However, a multi spin-echo technique is common used to decrease scan time and signal levels are matched to one or more decaying exponentials, depending upon whether more than one T2 distributions are thought to be within the sample. T2 measurements may also be skewed by imperfect refocusing pulses resulting in regional variation.
T1rho imaging
T1rho imaging, or spin lattice relaxation in the rotating frame, has been demonstrated to be effective in visualizing early changes resulting from osteoarthritis. This new imaging technology is made possible when the magnetization is tipped into the transverse plane and then “spin-locked” by a constant RF field. T1rho is extremely sensitive to changes in the macromolecular environment, which is exactly what occurs in early osteoarthritis. Proteoglycan depletion is one of the earliest biomarkers of osteoarthritis and greatly affects the physio-chemical interactions that exist within the macromolecular content. T1rho, therefore, is a technique with which to examine the slow-moving interactions that occur amongst the static water molecules and their extracellular environment. Difficulties arise at higher field strengths since the effective spin lock frequency is limited by SAR limitations, and ultimately the technique becomes T2-weighted instead of T1rho-weighted (76). As it has been shown effective to acquire valuable biomedical information in low frequency systems, it has been regarded as one of the top imaging tools with which to study early osteoarthritis development (77, 78) (Fig. 8).
Sodium imaging
Similar to T1rho imaging, sodium imaging shows potential in detecting proteoglycan depletion in the early stages of osteoarthritis. This imaging method is made possible by the same MR phenomenon that is displayed in conventional MR imaging, but using sodium rather than hydrogen atoms to generate signal. The atom used, sodium-23 or 23Na, has an odd number of protons or neutrons and consequently it possesses a net nuclear spin. Despite the fact that 23Na is much less prevalent than 1H in the body, concentrations of approximately 320 mM can be found in normal human cartilage. Issues to consider when imaging with 23Na as opposed to 1H include its lower concentration, lower resonant frequency and shorter T2 relaxation times. As a result of these new challenges, longer imaging times and specialized transmit-and-receive coils must be used.
The mentioned adjustments prove worthwhile as the chemical and biological properties of the cartilage matrix, allow 23Na imaging to show early, asymptomatic osteoarthritis by measuring proteoglycan concentration (79, 80). Since positively charged 23Na atoms are attracted to the proteoglycans, which have a fixed negative charge, quantification of sodium concentrations can be attained to illustrate the degree of pathology as proteoglycan depletion occurs. It is important to note, however, that some spatial variation of the concentration of sodium occurs in even healthy cartilage (81). Aside from SAR limits, 23Na imaging benefits considerably from higher field, 3.0T and 7.0T systems. Overall, 23Na imaging has proven to be sensitive to fairly small changes in proteoglycan depletion (82) and provides a strong technique with which to study, diagnose and treat early stage osteoarthritis (Fig. 9).
Conclusion
MR imaging has long been established as the preferred modality for evaluating almost every joint of the musculoskeletal system. Despite its success, advancements and developments are both welcomed and necessary as they continue to revolutionize the field of musculoskeletal imaging. Most of these improvements are extremely beneficial, everything considered, but often require modifications in order to optimize their advantages. Much promising research to resolve outstanding technical considerations is being done in order to allow each new imaging technique to reach its full clinical potential. Advancements in both software and hardware technology have and continue to contribute to the increased indication of MR imaging in clinical musculoskeletal imaging.
Figure 7.
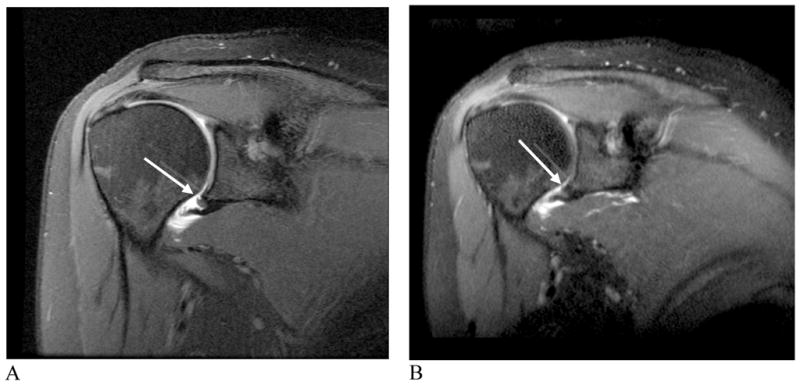
Humeral Avulsion of the Anterioinferior Glenohumeral Ligament. A) Oblique coronal proton density 2D-FSE image with fat saturation. B) Oblique coronal 3D-FSE-Cube image. The shoulder pathology can be seen in any oblique orientation using the isotropic 3D-FSE-Cube acquisition sequence (arrows, A, B).
Figure 10. Image acquired in a healthy volunteer at 3.0 T.
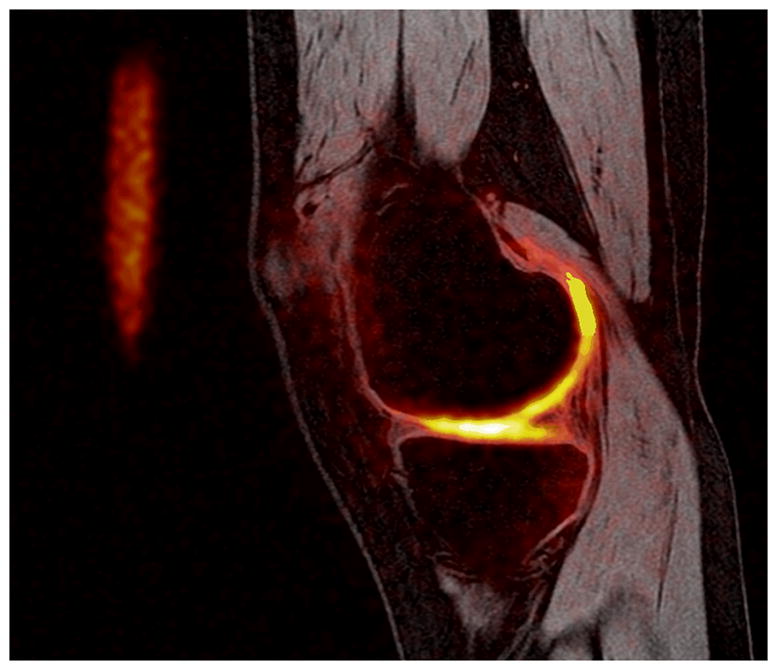
Proton image (spoiled gradient echo) with a sodium image overlay (heat scale). Sodium imaging has the capability to display proteoglycan content; focal areas in which sodium concentration is reduced indicate a decreased proteoglycan content.
Acknowledgments
Supported in part by:
NIH EB 002524, NIH EB 005790, NIH EB 008190, GE Healthcare, Coulter Foundation, SCBT/MR, Stanford University Undergraduate Advising and Research
References
- 1.Ahn JM, El-Khoury GY. Role of magnetic resonance imaging in musculoskeletal trauma. Top Magn Reson Imaging. 2007;18:155–168. doi: 10.1097/RMR.0b013e318093e670. [DOI] [PubMed] [Google Scholar]
- 2.Gold GE, Hargreaves BA, Beaulieu CF. Protocols in sports magnetic resonance imaging. Top Magn Reson Imaging. 2003;14:3–23. doi: 10.1097/00002142-200302000-00002. [DOI] [PubMed] [Google Scholar]
- 3.Mosher TJ. Musculoskeletal imaging at 3T: current techniques and future applications. Magn Reson Imaging Clin N Am. 2006;14:63–76. doi: 10.1016/j.mric.2005.12.002. [DOI] [PubMed] [Google Scholar]
- 4.Kan JH. Major pitfalls in musculoskeletal imaging-MRI. Pediatr Radiol. 2008;38 (Suppl 2):S251–255. doi: 10.1007/s00247-008-0792-2. [DOI] [PubMed] [Google Scholar]
- 5.Standaert CJ, Herring SA. Expert opinion and controversies in musculoskeletal and sports medicine: stingers. Arch Phys Med Rehabil. 2009;90:402–406. doi: 10.1016/j.apmr.2008.09.569. [DOI] [PubMed] [Google Scholar]
- 6.Solomon DH, Katz JN, Carrino JA, et al. Trends in knee magnetic resonance imaging. Med Care. 2003;41:687–692. doi: 10.1097/01.MLR.0000062705.24024.9F. [DOI] [PubMed] [Google Scholar]
- 7.Kurtz S, Mowat F, Ong K, Chan N, Lau E, Halpern M. Prevalence of primary and revision total hip and knee arthroplasty in the United States from 1990 through 2002. J Bone Joint Surg Am. 2005;87:1487–1497. doi: 10.2106/JBJS.D.02441. [DOI] [PubMed] [Google Scholar]
- 8.Craig JG, Go L, Blechinger J, et al. Three-tesla imaging of the knee: initial experience. Skeletal Radiol. 2005;34:453–461. doi: 10.1007/s00256-005-0919-6. [DOI] [PubMed] [Google Scholar]
- 9.Gold GE, Han E, Stainsby J, Wright G, Brittain J, Beaulieu C. Musculoskeletal MRI at 3. 0 T: relaxation times and image contrast. AJR Am J Roentgenol. 2004;183:343–351. doi: 10.2214/ajr.183.2.1830343. [DOI] [PubMed] [Google Scholar]
- 10.Uematsu H, Takahashi M, Dougherty L, Hatabu H. High field body MR imaging: preliminary experiences. Clin Imaging. 2004;28:159–162. doi: 10.1016/S0899-7071(03)00151-7. [DOI] [PubMed] [Google Scholar]
- 11.Collins CM, Smith MB. Signal-to-noise ratio and absorbed power as functions of main magnetic field strength, and definition of “90 degrees” RF pulse for the head in the birdcage coil. Magn Reson Med. 2001;45:684–691. doi: 10.1002/mrm.1091. [DOI] [PubMed] [Google Scholar]
- 12.Brix G, Seebass M, Hellwig G, Griebel J. Estimation of heat transfer and temperature rise in partial-body regions during MR procedures: an analytical approach with respect to safety considerations. Magn Reson Imaging. 2002;20:65–76. doi: 10.1016/s0730-725x(02)00483-6. [DOI] [PubMed] [Google Scholar]
- 13.Shellock FG. Radiofrequency energy-induced heating during MR procedures: a review. J Magn Reson Imaging. 2000;12:30–36. doi: 10.1002/1522-2586(200007)12:1<30::aid-jmri4>3.0.co;2-s. [DOI] [PubMed] [Google Scholar]
- 14.Shellock FG, Crues JV. MR procedures: biologic effects, safety, and patient care. Radiology. 2004;232:635–652. doi: 10.1148/radiol.2323030830. [DOI] [PubMed] [Google Scholar]
- 15.Shellock FG, Spinazzi A. MRI safety update 2008: part 2, screening patients for MRI. AJR Am J Roentgenol. 2008;191:1140–1149. doi: 10.2214/AJR.08.1038.2. [DOI] [PubMed] [Google Scholar]
- 16.Chang G, Friedrich KM, Wang L, et al. MRI of the wrist at 7 tesla using an eight-channel array coil combined with parallel imaging: preliminary results. J Magn Reson Imaging. 2010;31:740–746. doi: 10.1002/jmri.22072. [DOI] [PMC free article] [PubMed] [Google Scholar]
- 17.Banerjee S, Krug R, Carballido-Gamio J, et al. Rapid in vivo musculoskeletal MR with parallel imaging at 7T. Magn Reson Med. 2008;59:655–660. doi: 10.1002/mrm.21455. [DOI] [PubMed] [Google Scholar]
- 18.Regatte RR, Schweitzer ME. Ultra-high-field MRI of the musculoskeletal system at 7.0T. J Magn Reson Imaging. 2007;25:262–269. doi: 10.1002/jmri.20814. [DOI] [PubMed] [Google Scholar]
- 19.Schmidt GP, Reiser MF, Baur-Melnyk A. Whole-body imaging of the musculoskeletal system: the value of MR imaging. Skeletal Radiol. 2007;36:1109–1119. doi: 10.1007/s00256-007-0323-5. [DOI] [PMC free article] [PubMed] [Google Scholar]
- 20.Krishnamurthy GT, Tubis M, Hiss J, Blahd WH. Distribution pattern of metastatic bone disease. A need for total body skeletal image. JAMA. 1977;237:2504–2506. [PubMed] [Google Scholar]
- 21.Schenck JF. The role of magnetic susceptibility in magnetic resonance imaging: MRI magnetic compatibility of the first and second kinds. Med Phys. 1996;23:815–850. doi: 10.1118/1.597854. [DOI] [PubMed] [Google Scholar]
- 22.Butts K, Pauly JM, Gold GE. Reduction of blurring in view angle tilting MRI. Magn Reson Med. 2005;53:418–424. doi: 10.1002/mrm.20375. [DOI] [PubMed] [Google Scholar]
- 23.Kijowski R, Blankenbaker DG, Woods MA, Shinki K, De Smet AA, Reeder SB. 3. 0-T evaluation of knee cartilage by using three-dimensional IDEAL GRASS imaging: comparison with fast spin-echo imaging. Radiology. 2010;255:117–127. doi: 10.1148/radiol.09091011. [DOI] [PubMed] [Google Scholar]
- 24.Chen CA, Lu W, John CT, et al. Multiecho IDEAL gradient-echo water-fat separation for rapid assessment of cartilage volume at 1. 5 T: initial experience. Radiology. 2009;252:561–567. doi: 10.1148/radiol.2522081424. [DOI] [PMC free article] [PubMed] [Google Scholar]
- 25.Gold GE, Reeder SB, Yu H, et al. Articular cartilage of the knee: rapid three-dimensional MR imaging at 3. 0 T with IDEAL balanced steady-state free precession--initial experience. Radiology. 2006;240:546–551. doi: 10.1148/radiol.2402050288. [DOI] [PubMed] [Google Scholar]
- 26.Morgan P, Conolly S, Scott G, Macovski A. A readout magnet for prepolarized MRI. Magn Reson Med. 1996;36:527–536. doi: 10.1002/mrm.1910360405. [DOI] [PubMed] [Google Scholar]
- 27.Cho ZH, Kim DJ, Kim YK. Total inhomogeneity correction including chemical shifts and susceptibility by view angle tilting. Med Phys. 1988;15:7–11. doi: 10.1118/1.596162. [DOI] [PubMed] [Google Scholar]
- 28.Lu W, Pauly KB, Gold GE, Pauly JM, Hargreaves BA. SEMAC: Slice Encoding for Metal Artifact Correction in MRI. Magn Reson Med. 2009;62:66–76. doi: 10.1002/mrm.21967. [DOI] [PMC free article] [PubMed] [Google Scholar]
- 29.Koch KM, Lorbiecki JE, Hinks RS, King KF. A multispectral three-dimensional acquisition technique for imaging near metal implants. Magn Reson Med. 2009;61:381–390. doi: 10.1002/mrm.21856. [DOI] [PubMed] [Google Scholar]
- 30.Chen W, Beatty P, Koch KM, Brau AJ. Parallel MRI Near Metallic Implants. 17th Annual Meeting of the ISMRM; Honolulu, HI. 2009. p. 2783. [Google Scholar]
- 31.Lu W, Pauly KB, Gold GE, Pauly JM, Hargreaves BA. Accellerated Slice-Encoding for Metal Artifact Correction. 17th Annual ISMRM; Honolulu, HI. 2009. p. 258. [Google Scholar]
- 32.Cerezal L, Llopis E, Canga A, Rolon A. MR arthrography of the ankle: indications and technique. Radiol Clin North Am. 2008;46:973–994. v. doi: 10.1016/j.rcl.2008.09.002. [DOI] [PubMed] [Google Scholar]
- 33.Morrison WB. Indirect MR arthrography: concepts and controversies. Semin Musculoskelet Radiol. 2005;9:125–134. doi: 10.1055/s-2005-872338. [DOI] [PubMed] [Google Scholar]
- 34.Bergin D, Schweitzer ME. Indirect magnetic resonance arthrography. Skeletal Radiol. 2003;32:551–558. doi: 10.1007/s00256-003-0669-2. [DOI] [PubMed] [Google Scholar]
- 35.Zlatkin MB, Pevsner D, Sanders TG, Hancock CR, Ceballos CE, Herrera MF. Acetabular labral tears and cartilage lesions of the hip: indirect MR arthrographic correlation with arthroscopy--a preliminary study. AJR Am J Roentgenol. 194:709–714. doi: 10.2214/AJR.07.3669. [DOI] [PubMed] [Google Scholar]
- 36.Steinbach LS, Palmer WE, Schweitzer ME. Special focus session. MR arthrography Radiographics. 2002;22:1223–1246. doi: 10.1148/radiographics.22.5.g02se301223. [DOI] [PubMed] [Google Scholar]
- 37.Walker PS, Rovick JS, Robertson DD. The effects of knee brace hinge design and placement on joint mechanics. J Biomech. 1988;21:965–974. doi: 10.1016/0021-9290(88)90135-2. [DOI] [PubMed] [Google Scholar]
- 38.Andriacchi TP, Alexander EJ, Toney MK, Dyrby C, Sum J. A point cluster method for in vivo motion analysis: applied to a study of knee kinematics. J Biomech Eng. 1998;120:743–749. doi: 10.1115/1.2834888. [DOI] [PubMed] [Google Scholar]
- 39.Blemker SS, Asakawa DS, Gold GE, Delp SL. Image-based musculoskeletal modeling: applications, advances, and future opportunities. J Magn Reson Imaging. 2007;25:441–451. doi: 10.1002/jmri.20805. [DOI] [PubMed] [Google Scholar]
- 40.Shellock FG. Functional assessment of the joints using kinematic magnetic resonance imaging. Semin Musculoskelet Radiol. 2003;7:249–276. doi: 10.1055/s-2004-815673. [DOI] [PubMed] [Google Scholar]
- 41.Sheehan FT, Zajac FE, Drace JE. Using cine phase contrast magnetic resonance imaging to non-invasively study in vivo knee dynamics. J Biomech. 1998;31:21–26. doi: 10.1016/s0021-9290(97)00109-7. [DOI] [PubMed] [Google Scholar]
- 42.Draper CE, Santos JM, Kourtis LC, et al. Feasibility of using real-time MRI to measure joint kinematics in 1.5T and open-bore 0. 5T systems. J Magn Reson Imaging. 2008;28:158–166. doi: 10.1002/jmri.21413. [DOI] [PMC free article] [PubMed] [Google Scholar]
- 43.Kransdorf MJ, Jelinek JS, Moser RP, Jr, et al. Soft-tissue masses: diagnosis using MR imaging. AJR Am J Roentgenol. 1989;153:541–547. doi: 10.2214/ajr.153.3.541. [DOI] [PubMed] [Google Scholar]
- 44.Lundorf E, Keller JO, Nielsen OS, Jensen OM, Christensen T. Can magnetic resonance imaging differentiate between benign and malignant conditions in patients with skeletal or soft tissue tumors? Ugeskr Laeger. 1996;158:1518–1520. [PubMed] [Google Scholar]
- 45.Ma LD, Frassica FJ, Scott WW, Jr, Fishman EK, Zerbouni EA. Differentiation of benign and malignant musculoskeletal tumors: potential pitfalls with MR imaging. Radiographics. 1995;15:349–366. doi: 10.1148/radiographics.15.2.7761640. [DOI] [PubMed] [Google Scholar]
- 46.Aboagye EO, Bhujwalla ZM. Malignant transformation alters membrane choline phospholipid metabolism of human mammary epithelial cells. Cancer Res. 1999;59:80–84. [PubMed] [Google Scholar]
- 47.Castillo M, Kwock L, Mukherji SK. Clinical applications of proton MR spectroscopy. AJNR Am J Neuroradiol. 1996;17:1–15. [PMC free article] [PubMed] [Google Scholar]
- 48.Miller BL. A review of chemical issues in 1H NMR spectroscopy: N-acetyl-L-aspartate, creatine and choline. NMR Biomed. 1991;4:47–52. doi: 10.1002/nbm.1940040203. [DOI] [PubMed] [Google Scholar]
- 49.Wang CK, Li CW, Hsieh TJ, Chien SH, Liu GC, Tsai KB. Characterization of bone and soft-tissue tumors with in vivo 1H MR spectroscopy: initial results. Radiology. 2004;232:599–605. doi: 10.1148/radiol.2322031441. [DOI] [PubMed] [Google Scholar]
- 50.Fayad LM, Bluemke DA, McCarthy EF, Weber KL, Barker PB, Jacobs MA. Musculoskeletal tumors: use of proton MR spectroscopic imaging for characterization. J Magn Reson Imaging. 2006;23:23–28. doi: 10.1002/jmri.20448. [DOI] [PubMed] [Google Scholar]
- 51.Fayad LM, Salibi N, Wang X, et al. Quantification of muscle choline concentrations by proton MR spectroscopy at 3 T: technical feasibility. AJR Am J Roentgenol. 194:W73–79. doi: 10.2214/AJR.09.3125. [DOI] [PMC free article] [PubMed] [Google Scholar]
- 52.Boesch C, Slotboom J, Hoppeler H, Kreis R. In vivo determination of intra-myocellular lipids in human muscle by means of localized 1H-MR-spectroscopy. Magn Reson Med. 1997;37:484–493. doi: 10.1002/mrm.1910370403. [DOI] [PubMed] [Google Scholar]
- 53.Kayar SR, Hoppeler H, Howald H, Claassen H, Oberholzer F. Acute effects of endurance exercise on mitochondrial distribution and skeletal muscle morphology. Eur J Appl Physiol Occup Physiol. 1986;54:578–584. doi: 10.1007/BF00943344. [DOI] [PubMed] [Google Scholar]
- 54.Vock R, Hoppeler H, Claassen H, et al. Design of the oxygen and substrate pathways. VI. structural basis of intracellular substrate supply to mitochondria in muscle cells. J Exp Biol. 1996;199:1689–1697. doi: 10.1242/jeb.199.8.1689. [DOI] [PubMed] [Google Scholar]
- 55.Havel RJ, Carlson LA, Ekelund LG, Holmgren A. Turnover Rate and Oxidation of Different Free Fatty Acids in Man during Exercise. J Appl Physiol. 1964;19:613–618. doi: 10.1152/jappl.1964.19.4.613. [DOI] [PubMed] [Google Scholar]
- 56.Weber MA, Krakowski-Roosen H, Hildebrandt W, et al. Assessment of metabolism and microcirculation of healthy skeletal muscles by magnetic resonance and ultrasound techniques. J Neuroimaging. 2007;17:323–331. doi: 10.1111/j.1552-6569.2007.00156.x. [DOI] [PubMed] [Google Scholar]
- 57.Deng X, Farley M, Nieminen MT, Gray M, Burstein D. Diffusion tensor imaging of native and degenerated human articular cartilage. Magn Reson Imaging. 2007;25:168–171. doi: 10.1016/j.mri.2006.10.015. [DOI] [PubMed] [Google Scholar]
- 58.Zaraiskaya T, Kumbhare D, Noseworthy MD. Diffusion tensor imaging in evaluation of human skeletal muscle injury. J Magn Reson Imaging. 2006;24:402–408. doi: 10.1002/jmri.20651. [DOI] [PubMed] [Google Scholar]
- 59.Filidoro L, Dietrich O, Weber J, et al. High-resolution diffusion tensor imaging of human patellar cartilage: feasibility and preliminary findings. Magn Reson Med. 2005;53:993–998. doi: 10.1002/mrm.20469. [DOI] [PubMed] [Google Scholar]
- 60.Jee WH, McCauley TR, Kim JM, et al. Meniscal tear configurations: categorization with MR imaging. AJR Am J Roentgenol. 2003;180:93–97. doi: 10.2214/ajr.180.1.1800093. [DOI] [PubMed] [Google Scholar]
- 61.Schaefer FK, Schaefer PJ, Brossmann J, et al. Value of fat-suppressed PD-weighted TSE-sequences for detection of anterior and posterior cruciate ligament lesions--comparison to arthroscopy. Eur J Radiol. 2006;58:411–415. doi: 10.1016/j.ejrad.2005.12.034. [DOI] [PubMed] [Google Scholar]
- 62.Sonin AH, Pensy RA, Mulligan ME, Hatem S. Grading articular cartilage of the knee using fast spin-echo proton density-weighted MR imaging without fat suppression. AJR Am J Roentgenol. 2002;179:1159–1166. doi: 10.2214/ajr.179.5.1791159. [DOI] [PubMed] [Google Scholar]
- 63.Bredella MA, Tirman PF, Peterfy CG, et al. Accuracy of T2-weighted fast spin-echo MR imaging with fat saturation in detecting cartilage defects in the knee: comparison with arthroscopy in 130 patients. AJR Am J Roentgenol. 1999;172:1073–1080. doi: 10.2214/ajr.172.4.10587150. [DOI] [PubMed] [Google Scholar]
- 64.Gold GE, Busse RF, Beehler C, et al. Isotropic MRI of the knee with 3D fast spin-echo extended echo-train acquisition (XETA): initial experience. AJR Am J Roentgenol. 2007;188:1287–1293. doi: 10.2214/AJR.06.1208. [DOI] [PubMed] [Google Scholar]
- 65.Lichy MP, Wietek BM, Mugler JP, 3rd, et al. Magnetic resonance imaging of the body trunk using a single-slab, 3-dimensional, T2-weighted turbo-spin-echo sequence with high sampling efficiency (SPACE) for high spatial resolution imaging: initial clinical experiences. Invest Radiol. 2005;40:754–760. doi: 10.1097/01.rli.0000185880.92346.9e. [DOI] [PubMed] [Google Scholar]
- 66.Stevens KJ, Busse RF, Han E, et al. Ankle: isotropic MR imaging with 3D-FSE-cube--initial experience in healthy volunteers. Radiology. 2008;249:1026–1033. doi: 10.1148/radiol.2493080227. [DOI] [PMC free article] [PubMed] [Google Scholar]
- 67.Gatehouse PD, Thomas RW, Robson MD, Hamilton G, Herlihy AH, Bydder GM. Magnetic resonance imaging of the knee with ultrashort TE pulse sequences. Magn Reson Imaging. 2004;22:1061–1067. doi: 10.1016/j.mri.2004.08.018. [DOI] [PubMed] [Google Scholar]
- 68.Gatehouse PD, He T, Puri BK, Thomas RD, Resnick D, Bydder GM. Contrast-enhanced MRI of the menisci of the knee using ultrashort echo time (UTE) pulse sequences: imaging of the red and white zones. Br J Radiol. 2004;77:641–647. doi: 10.1259/bjr/31774546. [DOI] [PubMed] [Google Scholar]
- 69.Gold GE, Thedens DR, Pauly JM, et al. MR imaging of articular cartilage of the knee: new methods using ultrashort TEs. AJR Am J Roentgenol. 1998;170:1223–1226. doi: 10.2214/ajr.170.5.9574589. [DOI] [PubMed] [Google Scholar]
- 70.Robson MD, Gatehouse PD, Bydder M, Bydder GM. Magnetic resonance: an introduction to ultrashort TE (UTE) imaging. J Comput Assist Tomogr. 2003;27:825–846. doi: 10.1097/00004728-200311000-00001. [DOI] [PubMed] [Google Scholar]
- 71.Dardzinski BJ, Mosher TJ, Li S, Van Slyke MA, Smith MB. Spatial variation of T2 in human articular cartilage. Radiology. 1997;205:546–550. doi: 10.1148/radiology.205.2.9356643. [DOI] [PubMed] [Google Scholar]
- 72.Mosher TJ, Dardzinski BJ, Smith MB. Human articular cartilage: influence of aging and early symptomatic degeneration on the spatial variation of T2--preliminary findings at 3 T. Radiology. 2000;214:259–266. doi: 10.1148/radiology.214.1.r00ja15259. [DOI] [PubMed] [Google Scholar]
- 73.Mosher TJ, Smith H, Dardzinski BJ, Schmithorst VJ, Smith MB. MR imaging and T2 mapping of femoral cartilage: in vivo determination of the magic angle effect. AJR Am J Roentgenol. 2001;177:665–669. doi: 10.2214/ajr.177.3.1770665. [DOI] [PubMed] [Google Scholar]
- 74.Poon CS, Henkelman RM. Practical T2 quantitation for clinical applications. J Magn Reson Imaging. 1992;2:541–553. doi: 10.1002/jmri.1880020512. [DOI] [PubMed] [Google Scholar]
- 75.Smith HE, Mosher TJ, Dardzinski BJ, et al. Spatial variation in cartilage T2 of the knee. J Magn Reson Imaging. 2001;14:50–55. doi: 10.1002/jmri.1150. [DOI] [PubMed] [Google Scholar]
- 76.Santyr GE, Fairbanks EJ, Kelcz F, Sorenson JA. Off-resonance spin locking for MR imaging. Magn Reson Med. 1994;32:43–51. doi: 10.1002/mrm.1910320107. [DOI] [PubMed] [Google Scholar]
- 77.Akella SV, Regatte RR, Gougoutas AJ, et al. Proteoglycan-induced changes in T1rho-relaxation of articular cartilage at 4T. Magn Reson Med. 2001;46:419–423. doi: 10.1002/mrm.1208. [DOI] [PubMed] [Google Scholar]
- 78.Li X, Han ET, Ma CB, Link TM, Newitt DC, Majumdar S. In vivo 3T spiral imaging based multi-slice T(1rho) mapping of knee cartilage in osteoarthritis. Magn Reson Med. 2005;54:929–936. doi: 10.1002/mrm.20609. [DOI] [PubMed] [Google Scholar]
- 79.Shapiro EM, Borthakur A, Dandora R, Kriss A, Leigh JS, Reddy R. Sodium visibility and quantitation in intact bovine articular cartilage using high field (23)Na MRI and MRS. J Magn Reson. 2000;142:24–31. doi: 10.1006/jmre.1999.1932. [DOI] [PubMed] [Google Scholar]
- 80.Shapiro EM, Borthakur A, Gougoutas A, Reddy R. 23Na MRI accurately measures fixed charge density in articular cartilage. Magn Reson Med. 2002;47:284–291. doi: 10.1002/mrm.10054. [DOI] [PMC free article] [PubMed] [Google Scholar]
- 81.Borthakur A, Shapiro EM, Beers J, Kudchodkar S, Kneeland JB, Reddy R. Sensitivity of MRI to proteoglycan depletion in cartilage: comparison of sodium and proton MRI. Osteoarthritis Cartilage. 2000;8:288–293. doi: 10.1053/joca.1999.0303. [DOI] [PubMed] [Google Scholar]
- 82.Gold GE, Koo S, Starosweicki E, Watkins R, Hargreaves BA, Bangerter NK. In Vivo Sodium MRI at 3.0T of Patients with Previous ACL Injury. 17th Annual ISMRM; Honolulu, HI. 2009. p. 3970. [Google Scholar]


