Abstract
Phosphomannomutase/phosphoglucomutase contributes to infectivity of Pseudomonas aeruginosa, retains and reorients its intermediate by 180°, and rotates domain 4 to close the deep catalytic cleft. NMR spectra of the backbone of wild-type and S108C-inactivated enzymes were assigned to at least 90%. 13C secondary chemical shifts report excellent agreement of solution and crystallographic structure over the 14 α-helices, C-capping motifs, and 20 of the 22 β-strands. Major and minor NMR peaks implicate substates affecting 28% of assigned residues. These are attributable to the phosphorylation state and possibly to conformational interconversions. S108C substitution of the phosphoryl donor and acceptor slowed transformation of the glucose-1-phosphate substrate by impairment of kcat. Addition of the glucose-1,6-bisphosphate intermediate accelerated this reaction by 2 – 3 orders of magnitude, somewhat bypassing the defect and apparently relieving substrate inhibition. The S108C mutation perturbs the NMR spectra and electron density map around the catalytic cleft, while preserving the secondary structure in solution. Diminished peak heights and faster 15N relaxation are suggestive of line broadening and millisecond fluctuations within four loops that can contact phosphosugars. 15N NMR relaxation and peak heights suggest that domain 4 reorients slightly faster in solution than domains 1 to 3, and with a different principal axis of diffusion. This adds to the crystallographic evidence for domain 4 rotations in the enzyme, which were previously suggested to couple to reorientation of intermediate, substrate binding, and product release.
Keywords: triple resonance NMR, 15N NMR relaxation, rotational diffusion, enzyme catalysis, domain motion, crystal structure, principal component analysis
INTRODUCTION
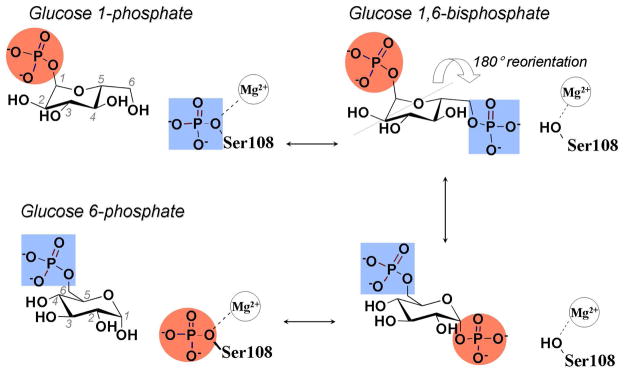
α-D-phosphohexomutases from bacteria to humans catalyze reversible phosphoryl transfer across sugar substrates.1, 2 The enzyme phosphomannomutase/phosphoglucomutase (PMM/PGM) from the opportunistic human pathogen Pseuodomonas aeruginosa converts phosphorylation between the 1- and 6-positions of either mannose or glucose. The reaction proceeds between hexose-1-phosphate, its phosphorylation to hexose-1,6-bisphosphate, and rephosphorylation of the enzyme to generate the hexose-6-phosphate (Figure 1).3 Retention of the bisphosphorylated intermediate during catalysis was demonstrated by isotope trapping.1, 3, 4 That, together with the opposite orientations of glucose-1-phosphate (G1P) and glucose-6-phosphate (G6P) in crystal structures5 and conservation of Ser108 required for activity6 and implicated in donating and accepting the phosphoryl group,3 strongly suggests the reorientation of the glucose-1,6-bisphosphate (G1,6P) intermediate by 180° on the enzyme. Moreover, the G1,6P bound forms either G1P or G6P 14 to 15 times more often than this intermediate dissociates.4 Crystallography confirmed the proposed roles of Ser108 and provided insights on how the intermediate reorients by 180° in the active site.5, 7
Figure 1.
Steps of transformation of G1P to G6P by α-D-phosphohexomutases. The reversible catalysis proceeds via the G1,6P intermediate that reorients by 180° on enzyme. A red circle marks the phosphoryl group transferred from the 1-position to Ser108 of P. aeruginosa PMM/PGM. Not depicted is the infrequent dissociation of G1,6P.
In P. aeruginosa, the glucose-1-phosphate (G1P) product is used in biosynthesis of the nucleotide-activated UDP-D-glucose and dTDP-L-rhamnose precursors of the lipopolysaccharide (LPS) core required for virulence.8 dTDP-L-rhamnose is also a precursor of rhamnolipids which are surfactants associated with biofilms of P. aeruginosa.9 The mannose-1-phosphate product is used in biosynthesis of the GDP-D-mannose precursor to the LPS A-band10 and the alginate capsule11 that protects the bacterial communities from antibiotics and phagocytosis.12 PMM/PGM is a potential target for antibiotic development since P. aeruginosa infections accompany cystic fibrosis12, 13 and severe chronic obstructive pulmonary disease.14 Since the related rabbit PGM has a 6000-fold preference for glucose over mannose phosphosugars15 while bacterial PMM/PGM enzymes have specificity for both, mannose-like compounds were suggested as a potential strategy for inhibiting only bacterial enzymes.5
Bacterial PMM/PGM comprises four mixed α/β domains encompassing a deep and positively charged catalytic cleft.16 The first three domains share a common fold of a 4-stranded β-sheet between two helices.16 Domain 4 is topologically distinct and is classified as a member of the TATA-box binding protein-like superfamily.17 Upon binding a phosphosugar ligand such as G1P, G6P, or xylose-1-phosphate (X1P), domain 4 (D4) closes inward to narrow the catalytic cleft, indicating that D4 can reorient.5, 7, 18 (X1P is an inhibitor and analog of G1P that lacks C6 and the O6 hydroxyl, rendering it incapable of the phosphoryl transfer.) Binding of the hexose substrate or the accompanying conformational change is rate-limiting for PMM/PGM.4 A network of hydrogen bonds between the ligand and several loops in the active site, combined with favorable electrostatics, position the bound ligand deep in the pocket.5, 7 During the multi-step reaction, partial opening of the catalytic cleft by rotation of D4 might facilitate the requisite 180° flip of the G1,6P or mannose-1,6-bisphosphate (M1,6P) intermediate,7 which is retained in the active site presumably with the aid of the electrostatic field.7, 16
NMR in solution can in principle address issues like the rotational diffusion of domains, protein fold, transformation of substrate, consequences of a key mutation, internal dynamics, heterogeneity, protein stability, and phosphosugar binding. The first six of these topics are addressed in part in the work herein. We removed the key phosphoryl donor and acceptor by S108C substitution in an effort to simplify future study of ligand binding, with the hope of preventing chemical transformation while retaining coordination of the divalent cation in the active site. Despite the challenging 51 kDa size, assignments of the backbone NMR peaks of wt PMM/PGM as well as effects of S108C substitution of the key phosphoryl donor/acceptor have been achieved. NMR in solution suggests: (i) detectably greater mobility of D4 than D1 – D3 as rigid bodies (by 15N NMR relaxation R2/R1, ηxy and NMR peak heights), (ii) the presence of conformational substates affecting a quarter of residues (in TROSY-resolved spectra), and (iii) potential mobility in milliseconds of 4 loops that interact with phosphosugar ligands (based on 15N relaxation and peak heights). NMR and crystallography indicate perturbations due to the S108C substitution to be distributed around the catalytic cleft. The ability of G1,6P to partially restore the catalytic defect from the S108C substitution suggests alternative means of phosphoryl transfer between the enzyme and hexose. Thus, this active site cleft displays evidence of resilience to a strategic mutation and adjustable shaping of the cleft as D4 reorients.
EXPERIMENTAL PROCEDURES
Protein Expression, Isotopic Enrichment, and Purification
The S108C mutation of P. aeruginosa PMM/PGM was constructed in pET3a using the QuikChange mutagenesis kit (Stratagene) and verified by DNA sequencing. For expression of uniformly 2H/15N/13C–labeled PMM/PGM, E. coli BL21(DE3) cells were transformed with either a pET14b or pET3a expression plasmid, corresponding to either the (His)6-tagged or untagged protein, respectively. Starter cultures grown overnight were centrifuged, the cell pellet added to 30 mL of fresh M9 minimal medium containing 15NH4Cl, 13C glucose (Sigma-Isotec), 0.1 mg/L carbenicillin, and 5% (v/v) 13C/15N Celtone (Cambridge Isotope Labs), and grown to an OD600 of 0.6–0.8. The cell pellet from this culture was added to 200 mL of the same media prepared in D2O, grown to an OD600 of 0.6–0.8, and then added to 1 L of the same medium, resulting in a D2O concentration of 93% (v/v). Cells were grown to an OD600 of 0.6–0.8, induced by adding IPTG to 0.4 mM, and grown at 37°C for 4–6 hours until harvested. Cell pellets were stored at −80°C.
Purification of (His)6-tagged samples was performed as described19 with modifications. The cells were lysed by French press in buffer for equilibrating the Ni2+ column (20 mM sodium phosphate, pH 7.8, 300 mM NaCl containing 14 mM β-mercaptoethanol, 2 mM MgSO4, 2 mM CaCl2, 0.5 mM PMSF, 0.5 mM TLCK and 10 ug/mL DNase). The thiol reductant was present to keep the one exposed and six buried cysteine sulfhydryls reduced. The supernatant was treated with protamine sulfate (5 mg/g of cell pellet), centrifuged, and then mixed with Ni2+ affinity resin (Sigma, His-Select). Protein was eluted using buffer with 250 mM imidazole (pH 7.8) added. The purified protein was dialyzed against 20 mM phosphate (pH 7.4) into successively lower salt concentrations of 300, 200, and 100 mM NaCl, then into 50 mM MOPS (pH 7.4) at 50 and 25 mM NaCl, and finally into 50 mM MOPS (pH 7.4) with 1 mM MgCl2. Dephosphorylation of a sample was achieved by overnight incubation with glucosamine-1-phosphate at 6.25:1 molar excess over enzyme at 4°C (Lee and Beamer, unpublished), followed by thorough dialysis in 50 mM MOPS, pH 7.4, 1 mM MgCl2.
Untagged protein was purified as described,3 with cell lysis by French press. This protein was also dialyzed into 50 mM MOPS (pH 7.4) either with or without 1 mM MgCl2. Protein solutions were concentrated to 40–75 mg/mL as determined by Bradford assay. A typical yield from 1 L of culture was 70 – 100 mg purified protein.
NMR Spectra and Assignment
NMR spectra were acquired with a Bruker Avance III 800 MHz spectrometer with TCI cryoprobe. PMM/PGM samples were 0.6 to 1.5 mM in the pH 7.4 buffer above. HNCA, HN(CO)CA, HNCO, HN(CA)CO, HNCACB, and HN(CO)CACB triple resonance spectra at 37°C exploited TROSY line sharpening20 for sensitivity and resolution.21, 22 1H and 13C peak assignments were referenced directly to DSS and indirectly to 15N.23 NMR spectra were processed with NMRPipe24 or TopSpin and interpreted with Sparky.25 Sequence placement of peak assignments exploited residue-specific information from seq_prob,26 MARS,27 and SAGA.28 In cases where corresponding amide peaks from different triple resonance spectra were not recognized by SAGA as matching, the generic spin system was manually edited into the .gs file. This maximized successful SAGA assignments and confirmation of spin systems.
Structural Information from NMR
Secondary structure propensities were derived from 13Cα and 13Cβ shifts from random coil, scaled from +1.2 to −1.2, and averaged over a sliding 5-residue window.29 This SSP algorithm has the advantage of simplifying secondary structural trends by normalizing the scales of 13C chemical shift changes to a uniform scale shared by all types of amino acids, which otherwise differ in size of changes.29
The CS23D webserver30 was used to build a model of the free state of PMM/PGM refined by assigned chemical shifts. The final refinement step of CS23D was modified to allow the chemical shifts to drive refinement and to prevent collapse of D4 against D1. That is, the knowledge-based potential was turned off and secondary structure was loosely restrained to 1 Å RMSD from the starting model.
15N NMR relaxation
15N T1, T2, and {1H}15N steady-state NOE relaxation were measured on the 800 MHz NMR spectrometer using TROSY-T1, TROSY-T2, and NOE-TROSY pulse sequences, respectively, with enhanced 1H resolution and sensitivity.31 The T1 and T2 series were each run with the various relaxation periods collected in an interleaved fashion. T1 relaxation periods were 0.05, 0.21, 0.49, 0.85, and 1.3 s. T2 relaxation periods were 0, 16, 32, and 48 ms. Saturated and unsaturated {1H}15N NOE spectra were collected in an interleaved manner. Three replicate pairs of them were collected. 6 s was used for either 1H saturation or recovery in the unsaturated reference spectra. Rate constants ηxy of 15N DD-CSA transverse cross-correlated relaxation were measured as described32 on the Bruker 800 MHz system.
Mean R2/R1 (=T1/T2) and mean ηxy were used to estimate apparent rotational correlation times τc after trimming off the highest 10% and lowest 10% of values that can be subject to internal motions. τc was estimated from trimmed mean T1/T2 using the relationship 33:
| (1) |
Trimmed means of ηxy were used to estimate τc from spectral density relationships of the TRACT approach.34 In order to model the orientation properties of rotational diffusion, the trimmed 15N R2 and R1 relaxation rates were fitted to the coordinates of the free state of wt PMM/PGM (PDB ID 1K35) using TENSOR2.35 F-testing was used to identify the simplest model of diffusion that is statistically adequate.
Phosphoryl Transfer across Glucose
Both 1D 1H and 13C spectra were used to monitor transformation of 13C-labeled G1P (Cambridge Isotope Labs, Andover, MA) to G6P by 33 μM PMM/PGM at 27°C and pH 7.3. Initial reaction conditions were 400 μM G1P, 1 mM MgSO4, 1 mM DTT, 33.3 mM Tris-d11 and 16.7 mM MOPS (pH 7.3), with the addition of G1,6P to 0.66 μM. 1 mM DTT was previously found necessary for optimal activity.3 The relative concentrations of G1P and G6P were derived by integrating the 1H NMR peak of the α-anomeric proton of each, which lie at 5.44 ppm and 5.22 ppm, respectively. (The β-anomeric peak overlaps the suppressed water region.) 13C NMR finding of 1.67-fold more β-anomer present was used in determining total [G6P] formed. That is, in 1H spectra [G6P] total = (1.67 + 1)[G6P]α-anomer.
Enzymatic progress curves and initial velocities were monitored in the direction of G6P formation using an assay coupled with glucose 6-phosphate dehydrogenase that reduces NAD+ to NADH detected by its absorbance at 340 nm.3 The reactions were run at 25°C in 50 mM MOPS, pH 7.4, with 1 mM DTT, 1.5 mM MgSO4, 0.9 mM NAD+, 1–1.5 μM G1,6P, and 100–200 nM (5–10 μg/ml) PMM/PGM.
Mass Spectrometry
Enzyme samples were diluted in 3/97/0.1 (v/v/v) acetonitrile/water/88% formic acid and analyzed by NanoLC-Nanospray QTOF MS (Agilent 6520A MS) (with mass error < 5 ppm) in the positive ion mode. Fractionation employed an Agilent SPQ 105 Intact Protein Chip with a Zorbax C8 trap column. Spectral deconvolution used maximum entropy implemented with Agilent Mass Hunter software.
Circular Dichroism
Protein samples were dialyzed into 10 mM MOPs, pH 7.4. The dialyzate was used as the reference for background subtraction. CD spectra were collected using an Aviv Model 62DS spectrometer over wavelengths from 200 to 250 nm at 25°C in a cuvette of 0.1 cm path length.
Crystallography
The free state of PMM/PGM(S108C) was crystallized as described36 with final solution containing 25% glycerol as cryoprotectant, 0.1 M HEPES, pH 7.5 and 1.4 M K/Na tartrate. X-ray diffraction data were collected using a Rigaku RU H3R rotating anode and R-AXIS IV++ image plate system under cryo-cooling conditions. Data were processed with d*Trek,37 and refinement was performed with REFMAC 5.5.0109.38 The starting model for refinement of the apo-S108C crystals was that of wt apo-PMM/PGM (PDB ID 1K35) without water molecules. Progress of the refinement was monitored by following Rfree; 5% of the data set was set aside for cross-validation prior to refinement. The structure was refined to convergence through iterative cycles of refinement and manual rebuilding with Coot.39 Water molecules were placed automatically with COOT in peaks >3.0 σ in Fo-Fc maps and within reasonable hydrogen bonding distance of oxygen or nitrogen atoms. The data collection and refinement statistics are summarized in Table 1.
Table 1.
Crystallographic data for PMM/PGM(S108C)
| Data Collection | |
| X-ray source | Home |
| Space group | P212121 |
| Unit cell dimensions, Å | a= 70.03, b= 72.81, c= 93.0 |
| λ, Å | 1.54 |
| Resolution, Å | 57.33–2.10 |
| Outermost shell | (2.18–2.10) |
| Unique reflections | 28,767 |
| Redundancy | 4.80 (4.72) |
| Rmerge, % | 6.0 (51.3) |
| I/σ | 11.0 (2.3) |
| Completeness, % | 99.9 (99.9) |
| Refinement Statistics | |
| Resolution, Å | 57.35–2.10 |
| a Rwork/b Rfree | 21.3/25.3 |
| Non-H atoms | 3402 |
| Waters | 116 |
| B value from Wilson plot, Å2 | 46.1 |
| <B>, Å2 | |
| protein atoms | 56.3 |
| waters | 57.4 |
| Phosphate ion | 56.2 |
| rmsd bonds Å/angles ° | 0.012/1.4 |
| Ramachandran 1/2c % | 94.3/4.3 |
Rwork= Σ|Fo-Fc|/Σ|Fc| where Fo and Fc are observed and calculated structure factors, respectively.
Rfree is the R factor calculated from 5% of the reflections not included in refinement. No σ-cutoff of the data was used.
Most favored and allowed regions.
Statistics of Conformational Change
Multivariate statistics were performed to recognize patterns of conformational change in crystal structures. Principal component analysis (PCA) of the covariance in coordinates40 was implemented with the ProDy package.41 PCA was applied to twelve structures of P. aeruginosa PMM/PGM comprising three open and unbound structures (PDB IDs 1K35, 1K2Y, and 3C04), half-closed enzyme bound to G1,6P (PDB ID 2FKF), and eight closed, ligand-bound structures (PDB IDs 1P5D, 1P5G, 1PCJ, 1PCM, 2H5A, 2H4L, 2FKM, and 3BKQ). Only Cα coordinates were used, thereby avoiding complication by point mutations or missing side chain coordinates. The directions and relative amplitudes of statistical change in Cα coordinates were displayed for the main modes (principal components or PCs) using the NMWiz plugin for VMD.41
RESULTS
Assignments of Triple Resonance NMR Spectra
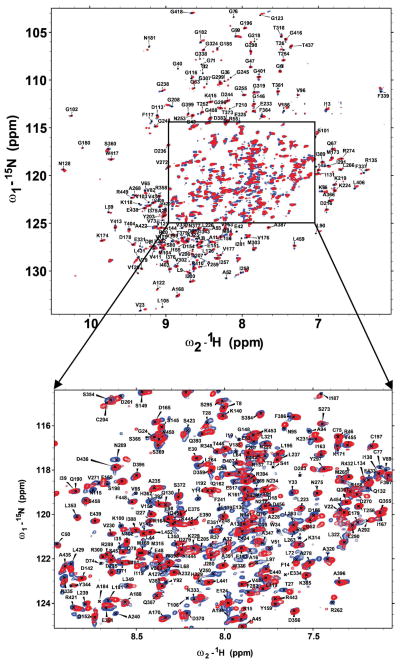
The amide peaks of PMM/PGM TROSY spectra are sufficiently resolved at 800 MHz to permit sequential assignments despite the crowding and overlap in the central region (Figure 2). Assignment of backbone NMR peaks of 2H/13C/15N-labeled PMM/PGM with His tag commenced using 800 MHz TROSY-enhanced HNCA, HN(CO)CA, HNCO, HN(CA)CO, HNCACB, and HN(CO)CACB spectra of proven utility in assigning larger enzymes.21, 22, 42 Sequential assignments of about 170 amide peaks were obtained with the aid of MARS software.27 Manual interpretation doubled preliminary assignments to 333 amide spin systems. Assignments of D4, which has greater peak heights, were complete at this stage. However, large gaps in assignments remained in D3, as well as many small gaps across D1 and D2. Another sample of 2H/13C/15N-labeled wt PMM/PGM prepared without the His tag and with addition of 1 mM MgCl2 displayed slightly sharper and more peaks, with peak positions unaltered. A battery of triple resonance spectra of this 1 mM sample (lacking an HN(CO)CACB) supported manual assignments that reached 403 of 437 potentially assignable amide spin systems. A battery of the same five TROSY-enhanced triple resonance spectra was collected on a 0.75 mM sample of 2H/13C/15N-enriched, S108C-substituted PMM/PGM in 1 mM MgCl2. Manual peak assignments started from those of wt enzyme.
Figure 2.
Annotated TROSY spectra of wt PMM/PGM (red) and PMM/PGM(S108C) (blue) at 800 MHz, 37 °C, and pH 7.4 using perdeuterated samples.
The accuracy of the peak assignments was confirmed by applying SAGA automation developed for larger proteins.28 This confirmed 401 of the prior triple resonance spin systems of wt enzyme, adjusted peak assignments of two spin systems, and identified a few new assignments. Most of the resonances that remain unlabeled in Figure 2 lack triple resonance correlations needed to assign them. Peak assignments of the termini, short stretches between prolines, and loops especially in D3 with presumed line broadening remain in doubt. In the case of PMM/PGM(S108C), SAGA confirmed the peak assignments of 372 residues, corrected the chemical shifts of five more, and assigned 16 additional spin systems. Pivotal to successful assignments by SAGA was the completeness of its assembly of generic spin systems (GSs) from the lists of peaks picked from the triple resonance spectra. Several dozen expected GSs failed in part or in full to reach SAGA’s step of assigning peaks. At least part of the omissions stemmed from SAGA curation of peak lists failing to match triple resonance peaks to the corresponding peak in the HN(CO)CA reference list. This resulted in “rungs” (13C peaks for sequential connection) missing from GSs. Manual grouping of triple resonance peaks into about 100 GSs filled in the critical omissions. Upon adding the hand-assembled GSs and removing incomplete GSs having 4 or more missing rungs, completion of assignments by SAGA became excellent. Among 437 potential amide spin systems, 407 (93%) of wt PMM/PGM and 393 (90%) of PMM/PGM(S108C) were assigned and confirmed (Figure 2).
Structural Correlates of NMR Secondary Shifts
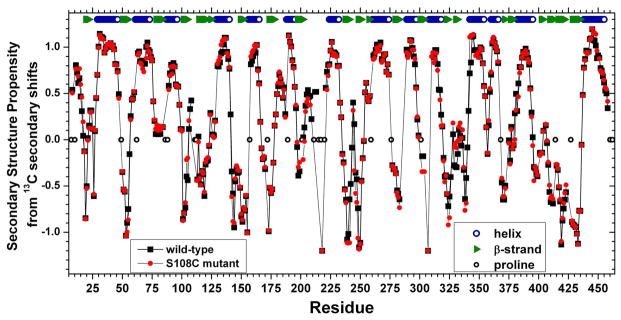
13Cα and 13Cβ secondary chemical shifts can be normalized in order to highlight secondary structure propensity (SSP).29 Across 20 of the 22 β-strands, SSP values were ≤ 0.15 (Figure 3). High SSP values of 0.57 to 1.2 show excellent correspondence with the locations of the 14 α-helices in crystal structures (Figure 3). In three helices, the C-terminal residue has a lower SSP value of 0.40 at Glu233, 0.27 at Thr318, and 0.03 at Asp395. Each of these plus Tyr297 with SSP of 0.57 is the C-cap position of the hydrophobic C-capping motif distinguishing that helix. Using established nomenclature,43 the helix ending at Glu233 has a C4′ → C3 n (type V or non-Gly Schellman) cap. The helix ending at Thr318 has a C″ → C3/C′ Gly (type IV or Schellman) cap. The helix ending at Asp395 has C3′ → C3/C′ n (type Va or non-Gly Schellman) cap. The helix ending at Tyr297 has the less common C4′ → C3 Gly (type VIb) cap.
Figure 3.
Secondary structure propensities (SSP) from 13Cα and 13Cβ secondary chemical shifts. SSP values are indicated for wt enzyme (black squares) and S108C-substituted enzyme (red circles). The values were calculated over a sliding window of five residues, avoiding glycine and each residue prior to proline.29 13C referencing was to DSS. The locations of secondary structure in crystal structures16 is marked at top for comparison with SSP trends in solution.
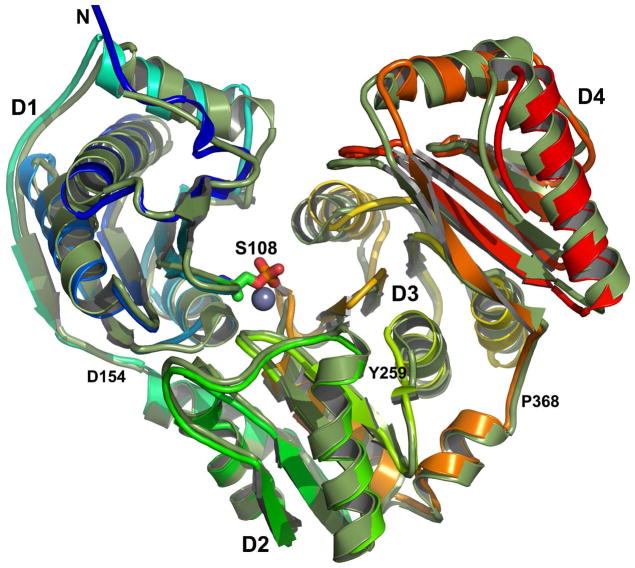
The assigned NMR chemical shifts were used to refine a homology model from a torsion-based genetic algorithm with modifications to refinement listed in Experimental Procedures.30 The model is superimposed with the crystal structure of the free state of PMM (PDB code 1K35) in Figure 4 with a backbone RMSD of 1.29 Å. All 14 helices and 22 β-strands are present in the NMR-refined model and correspond well in location with those of the crystal structure, except for a few β-strands in D1–D3 that appear to be longer in the NMR-refined model. As the structural information from 13Cα and 13Cβ NMR secondary chemical shifts is localized to the backbone, it cannot itself define the relative orientation of the domains. Superposing each domain individually between the solution model and the crystallographic coordinates yielded backbone RMSD values of 0.60 Å for D1 (residues 9–154), 0.38 Å for D2 (residues 155–258), 1.01 Å for D3 (residues 259–367), and 0.62 for D4 (residues 368–463).
Figure 4.
NMR chemical shift-refined homology model of PMM/PGM superimposed upon the crystal structure. The solution NMR-enhanced model is colored the spectrum of the rainbow from blue at the N-terminus to red at the C-terminus. The crystal structure of the free state (PDB accession code 1K35)16 is green. The side chain of phosphoSer108 is drawn at the base of the catalytic cleft where its Oγ is one ligand of the metal ion16 (gray and presumed to be zinc). Loop junctions between domains are marked with residue numbers.
NMR Evidence of Substates
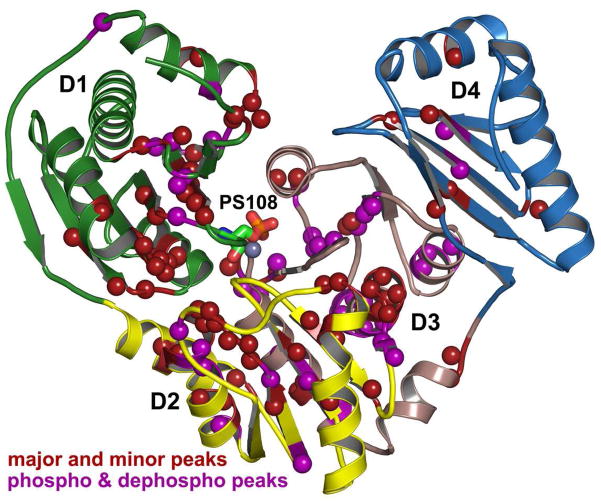
About 115 amide groups of wt or S108C-substituted PMM/PGM have two recognizable peaks in 800 MHz TROSY and triple resonance spectra. These residues are distributed throughout D1 – D3 and on the face of D4 adjacent to D3 (Figure 5). Key active site residues able to contact bound ligand such as Arg20, Lys118, and Arg247 are affected. Three residues (Leu266, Val272, and Ser273) of the central helix of D3 each have three peaks resolved, while Asn128 of D1 facing D3 has four. Examples are depicted in Figure S1. Chemical shift differences between major and minor peaks are given in Figure S2. The minor peak is always smaller in TROSY spectra. However, for about 28 residues of wt PMM/PGM the minor peak dominates triple resonance (Figure S1) and 15N relaxation spectra, suggesting that it relaxes more slowly than its fast-relaxing major counterpart.
Figure 5.
Residues with major and minor peaks, suggesting substates. Residues with two amide correlations resolved are marked with spheres. Purple spheres mark amide groups where the minor peak represents the dephosphorylated wt enzyme; see Figure S2 of Supporting Information. Dark red spheres mark the other amide groups having major and minor peaks. D1 – D4 are green, yellow, pink-gray, and sky blue in succession.
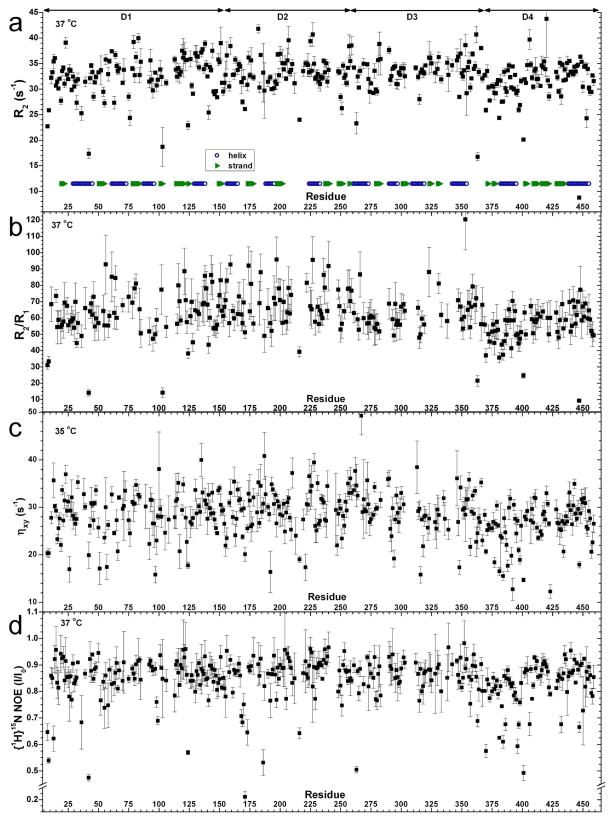
The preparation of wt PMM/PGM in a mostly dephosphorylated state (> 90% based on mass spectra not shown) resulted in the usual major peak of about 43 residues nearly disappearing and being replaced by the usual minor peak (Figure S2). Consequently, the major peak is assigned to the phosphorylated state and the minor peak to the dephosphorylated state for these 43 residues. Though the S108C mutant appears to be completely dephosphorylated (Figure S3), it still has about 114 amide groups with major and minor resonances (Figure S2). Among the 72 amide groups of wt enzyme with two peaks not obviously affected by phosphorylation (Figure S2), about 30% have elevated 15N R2 or R2/R1 evidence of exchange broadening (Figure 7a,b). This suggests the possibility of underlying conformational exchange processes that overlap the millisecond scale for the residues affected.
Figure 7.
15N relaxation of wt PMM/PGM collected at 800 MHz. Shown are R2 = 1/T2 in (a), R2/R1 in (b), transverse cross-correlation rate ηxy in (c), and {1H}15N steady-state NOE difference plotted as Isaturated/Inon-saturated in (d). The uncertainties in (a–c) are errors in fitting. The uncertainties in (d) are the standard deviations of triplicate measurements.
Domain 4 Mobility
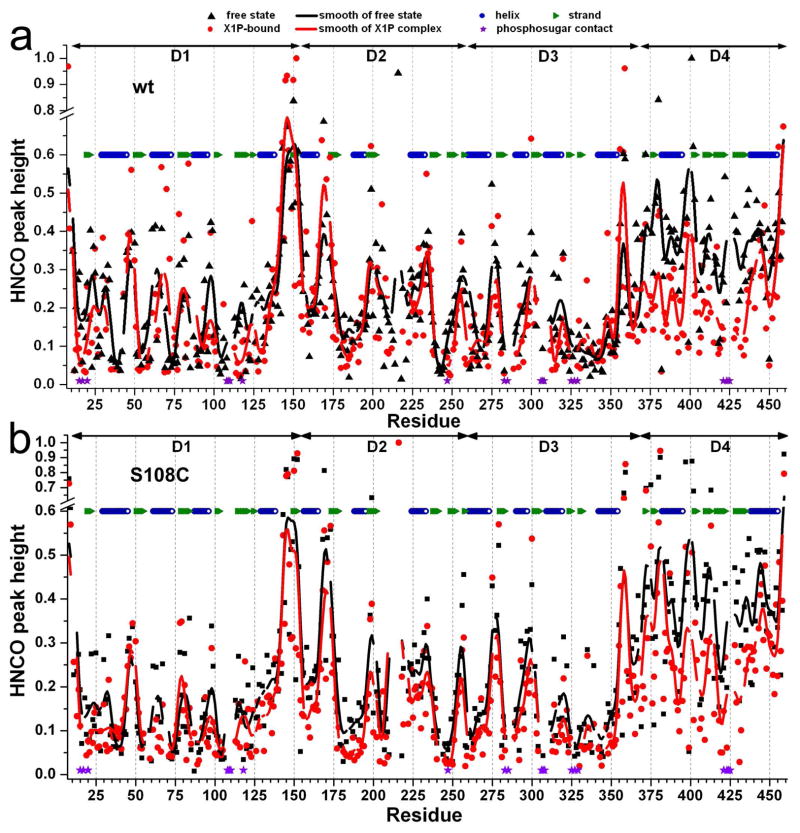
Relative mobility of domains of larger proteins can be judged qualitatively by peak heights of TROSY-enhanced triple resonance spectra, which are sensitive to correlation times of overall rotational diffusion, as well as to faster, localized dynamics.44 D4, on the whole, has greater peak heights than the other domains. In TROSY-enhanced HNCO spectra, peak heights from D4 average 2.1-fold higher than D1 – D3 for wt PMM/PGM (Figure 6a) and 2.25-fold higher for PMM/PGM(S108C) (Figure 6b). This suggests that D4 rotationally reorients as a rigid body more quickly than do D1 – D3.
Figure 6.
NMR evidence of mobility of D4 and loops. Peak heights of TROSY-enhanced HNCO spectra, normalized to the tallest peaks, are plotted for wt PMM/PGM (a) or PMM/PGM(S108C) (b), both before (black) and after saturating addition of X1P to 5-fold molar excess (red). Domain boundaries are marked at top. Curves indicate smoothing by 3-point fast Fourier transformation that filtered out extremes in peak heights. Sequence positions that contact phosphosugars are marked by purple stars.
15N NMR relaxation was measured in order to examine this hypothesis further. 15N relaxation parameters R2, R2/R1, ηxy, and {1H}15N NOE each are decreased starting immediately after the D3-D4 hinge residue Pro368 through the first third of D4 (Figure 7). 15N R2/R1 and ηxy parameters are favored for analyzing hydrodynamics.33–35. The R2/R1 and ηxy averages over the first third of D4 are 78% and 82%, respectively, of their averages over D1 – D3. Part of these decreases can be attributed to localized motions in the first third of D4 as pointed out below. Over the remaining two-thirds of D4, R2/R1 averages 91% of the D1 – D3 average and ηxy averages 95% of its D1 – D3 average (Figure 7b,c). The trimmed mean R2/R1 of 64.0 for D1 – D3 implies an apparent rotational correlation time τc of about 19.0 ns using equation 1 while the trimmed mean R2/R1 of 56.0 for all of D4 implies a τc of about 17.8 nanoseconds, which is 6.7% shorter. Fits of the same sets of 15N R2 and R1 relaxation rates using TENSOR2 35 also place τc at 19.0 nanoseconds for D1–D3 and 17.8 nanoseconds for D4. At the lower temperature of 35°C, trimmed mean 15N ηxy values (Figure 7c) interpreted by the TRACT method 34 suggest apparent τc of D1 – D3 of 21.2 nanoseconds and τc of D4 of 19.0 nanoseconds, which is 10% shorter. At 37 °C, PMM/PGM(S108C) displays similar τc 20.3 nanoseconds for D1 to D3 and 18.8 nanoseconds for D4 based on 15N ηxy values shown in Figure S6. These correlation times imply that each sample was a monomer in which D4 appeared to reorient rotationally 6 to 10% faster than D1 – D3.
The diffusion tensors of D1 – D3 and D4 were simulated in TENSOR2 35 using the trimmed 15N R2 and R1 values (from Figure 7). F-testing established that the simplest statistically adequate diffusion tensors have the axial symmetry of prolate ellipsoids. The best fit to D1 – D3 has D||/D⊥ of 1.14. The best fit to D4 has D||/D⊥ of 1.24. Notably, the direction of the principal axis of diffusion for D1 – D3 (D|| or Dz) differs from that of D4 by roughly 55°, which is beyond experimental uncertainty (Figure S7). This bolsters the line shape evidence for partial independence in the rotational diffusion of D4.
Saturating addition of X1P decreased average peak heights of D4, which are 1.3-fold higher than those of D1 – D3 for wt enzyme (Figure 6a) and 1.95-fold greater for S108C-substituted enzyme (Figure 6b). The higher overall peak heights of D4 remaining with X1P bound raise the question of whether D4 still reorients more quickly in the inhibitor complex, in a subtle but detectable fashion, particularly with PMM/PGM(S108C). The possible nature and significance of the rotation of D4 is considered in Discussion.
Mobile Loops
Mobility within the domains is also suggested by locally varying NMR peak heights and 15N relaxation. Greater peak heights, consistent with internal motions within nanoseconds, map to a number of locations including loops and surface locations of the enzyme (Figure 6). The most obvious of the rapidly mobile loops apparent from tall peaks are distant from the active site. Two of these flank the boundary defined between D1 and D2, encompassing a loop and final β-strand of D1 (Asp142 to Asp154) and a loop following the first helix of D2 (Ala168 to Met173) (Figure 6). Another rapidly mobile loop is found just after the final helix of D3. Highly flexible loops terminate both ends of the first helix of D4 (Figure 6). These latter three loops are near the “hinge” region, a noted site of conformational change at the juncture of D3 and D4 around Pro368.7, 45 All five of these loops have instances of below average 15N R2 and ηxy values that confirm the peak height evidence of fast motions within nanoseconds (Figure 7a,c). These loops, except for Asp142 – 154, also have low {1H}15N NOE values (Figure 7d) that further suggest the presence of motions on the scale of picoseconds.
At each loop that can make contacts with phosphosugar ligands,5, 7 residues are found with locally smaller amide peak heights; these are resolved and compared by TROSY-HNCO and marked with purple stars in Figure 6. This includes Arg15, Tyr17*, Arg20, Ser108, Lys118, Arg247, Asp283, Gly307*, Glu325, Ser327, His329*, Arg421, and Ser423 that contact ligands. Each asterisk (*) marks an amide proton that could be subject to the potential broadening mechanism of exchange with the water solvent at 1–5 s-1 (not shown). However, the short or missing peaks of the ten other residues might possibly be attributable to line broadening from fluctuations within milliseconds. This is corroborated in 4 of these loops by 15N exchange broadening at residues 119, 281 – 283, 323, and 420 (Figure 7a,b). Two of the loops that can contact ligands have low 15N ηxy at residues 19 and 423 (Figure 7c) suggesting motions within nanoseconds. Thus, 15N relaxation is suggestive of internal motions at 5 of the loops in this cleft where phosphosugars bind.
Ser108Cys Slowing of Phosphoryl Transfer
Replacement of Ser108, critical to the phosphoryl transfer reactions of PMM/PGM, with cysteine was investigated for its impact upon catalysis, structure of the active site, substrate affinity, and suitability for ligand-binding studies. Even after extensive incubation with G1,6P (the most effective phosphorylating agent for the enzyme), no phosphorylation of PMM/PGM(S108C) was detected (c.f. Figure S3b), consistent with removal of the principal acceptor of a phosphoryl group. The apparent Km for G1P remains similar between wt and S108C-substituted enzymes (Figure S4), implying similar affinity for G1P. The mutation was accompanied by a 24-fold lower apparent catalytic turnover (kcat) and 13-fold lower apparent catalytic efficiency (kcat/Km) (Figure S4).
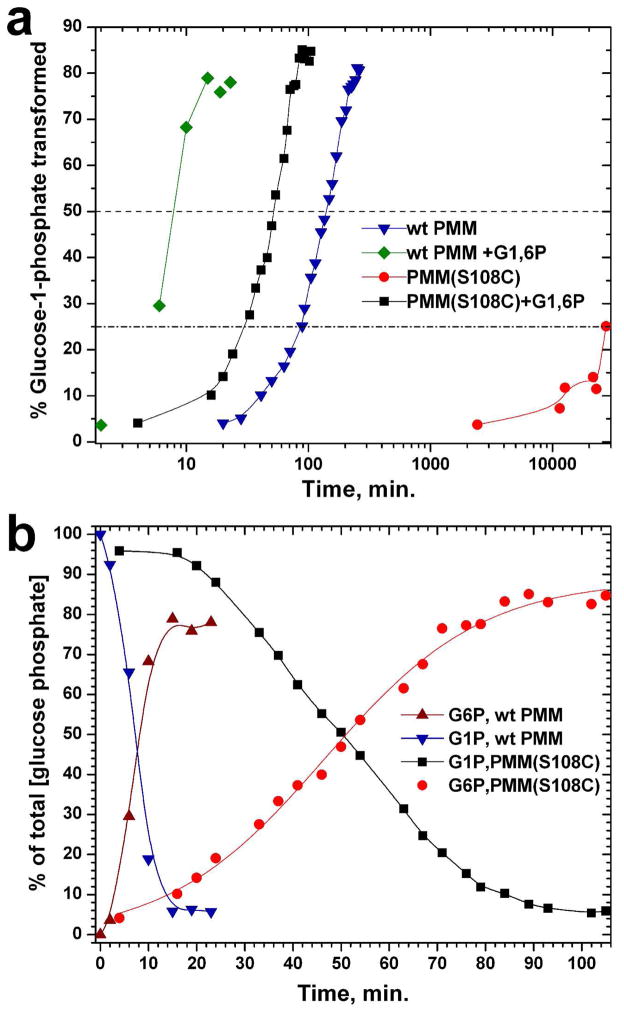
Without the addition of G1,6P, PMM/PGM(S108C) was dramatically slower than wt enzyme in transforming G1P to G6P, as judged from integrating the anomeric peaks in 1H NMR spectra (Figure 8) or 13C NMR spectra. 19 days and 2 hours were required for the mutant enzyme to transform 25% of the glucose phosphate (Figure 8a). In contrast, wt enzyme generated the same amount of G6P in 88 min, which is 310-fold faster. By completion at 260 min, 2.5% of the initial G1P was transformed into the intermediate G1,6P that had escaped wt PMM/PGM. Addition of G1,6P, which efficiently phosphorylates wt enzyme but not the S108C mutant enzyme, substantially accelerated the reactions. PMM/PGM(S108C) then transformed 25% of the G1P to G6P in about 33 min (Figure 8b), roughly 830-fold faster than without activation. Wild type and S108C-substituted enzymes transformed 50% of the G1P to G6P in about 7.2 and 51 minutes, respectively (Figure 8b). Thus, when G1,6P is present for activation and/or relief of substrate inhibition by G1P, the S108C mutant appeared to be slowed only 7-fold relative to wt at high concentrations of G1P and enzyme (Figure 8b). The slowdowns, at both high and low concentrations of the S108C mutant, resemble the 7% level of activity of the previously characterized S108D mutant.19 Pre-incubation of PMM/PGM(S108C) with G1,6P for 3.5 hours prior to addition of substrate G1P failed to shorten the lag phase. Presence of G1,6P activated wt PMM/PGM by 19-fold, consistent with previous observations of a 20-fold activation by G1,6P.3 Adding G1,6P (0.7 – 1.5 μM) together with saturating G1P activated the S108C mutant at least 40-fold more than wt enzyme.
Figure 8.
Time courses of transformation of glucose-1-phosphate by wt and S108C-substituted PMM/PGM, with and without activation by glucose-1,6-bisphosphate. The conditions supported multiple turnovers at 27°C, pH 7.3, with 33 μM enzyme. Initial concentrations were 400 μM G1P and when added 0.66 μM G1,6P. (a) Transformation of G1P to G6P is represented in the semi-log plot. (b) For the G1,6P-activated reactions, disappearance of G1P and appearance of G6P (its α-anomer) are plotted with an expanded view. The relative concentrations of G1P and G6P were derived by integrating the 1H NMR peak of the α-anomeric proton of each. The 13C NMR finding of 1.67-fold more β-anomer present was used in determining total [G6P] formed.
S108C Perturbations of NMR Spectra
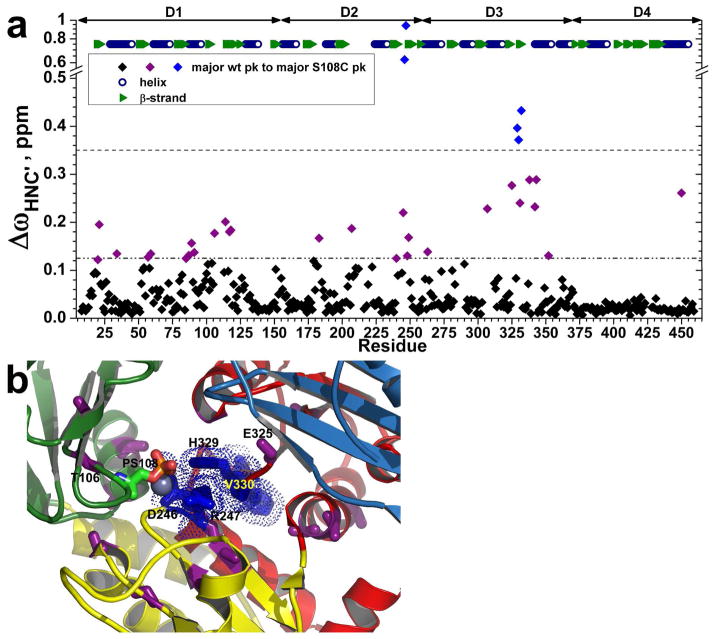
Chemical shift mapping of the effects of the S108C lesion indicated that the 25%-ile of backbone peaks most shifted, i.e. those with ΔωHNC′ ≥ 0.062 ppm, are equally distributed among domains 1, 2, and 3 (Figure 9a). In contrast, chemical shift perturbations are almost absent from D4. Large peak shifts by the S108C mutation (elevated > 3 σ) belong to Asp246 which joins Ser108 Oγ in coordinating the metal, Arg247 and Gly328 each packing with phosphoSer108, His329 packing with them near the phosphate of Ser108 and Val330 and Phe332 just beyond His329 (Figure 9). A second shell of residues with amide resonances shifted by ΔωHNC′ ≥ 0.125 ppm lie around the bottom of the catalytic cleft, i.e. residues 89, 91, 106, and 117 from D1; 179, 183, 240, 248, and 249 from D2; and 262, 263, 269, 281, and 325 from D3 (Figure 9). Accompanying the S108C mutation are cases of smaller NMR peak heights suggestive of line broadening and possible millisecond motion. The following 19 residues within 14 Å of Ser108 (in 1K35.pdb of the free state of wt enzyme) have normalized HNCO peak heights decreased by 40% or more in S108C relative to wt enzyme: 16, 20, 21, 61, 87, 105, 106, 118, 119, 183, 202, 206, 208–210, 246, 248, 307, and 329 (Figure 6). More distant residues with decreased peak heights in the mutant include 9 in D1, 2 in D2, 5 in D3, and 2 in D4. The decreases could reflect broadening from sampling alternative conformers or environments (of unknown chemical shift) in milliseconds.
Figure 9.
Chemical shift perturbations by the S108C mutation. (a) Radial chemical shift changes, calculated as ΔωHNC′ = ((ΔωHn)2 + (ΔωN/6)2 + (ΔωC′/2.4)2)1/2, are plotted for each residue’s main amide peak in PMM/PGM(S108C) relative to the main peak of wt enzyme. The peak positions were measured from TROSY-HNCO spectra (800 MHz, 37°C, and pH 7.4). The larger changes between major peaks in wt and S108C variants are marked on the crystal structure (1K35.pdb) in (b). Residues with ΔωHNC′ > 0.35 ppm are blue with side chains plotted in (b). Residues with 0.35 > ΔωHNC′ > 0.125 ppm are purple with side chains plotted in (b). Domains 1 through 4 are green, yellow, red, and sky blue in succession. PhosphoSer108 is colored by atom type.
S108C Effects on Active Site in Crystal Structure
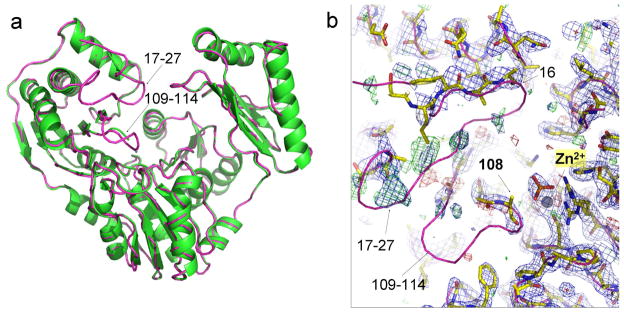
The crystal structure of the apo-form of PMM/PGM(S108C) was determined to 2.1 Å (Table 1). Although quite similar to wt enzyme overall (Cα rmsd 0.39 Å; Figure 10a), some differences were observed that were unexpected relative to the structures of other mutants at residue 108 (S108D or S108A lesions in PDB IDs 2FKF, 2FKM, and 1K2Y)7, 16 and are inconsistent with minimal changes suggested by NMR spectra (Figures 3 and 9a). Poor electron density begins at the Cys108 mutation where the side chain could not be modeled, and disappears entirely for His109 - Tyr114 (Figure 10b). This loop presumably occupies multiple conformations in the crystal of the mutant, leading to the lack of electron density. This result was not anticipated, as cysteine is known to coordinate Zn2+ in many proteins. Despite the loss of this side chain interaction, the zinc ion remains bound at full occupancy in the electron density and retains its Asp242, Asp244, and Asp246 ligands (Figure 10b). A phosphate ion, modeled at half occupancy, fits the electron density and appears to contribute another oxygen ligand for the metal ion, but lacks connectivity to any other residues in the protein (Figure 10b). (No phosphate was added during purification but might have originated during protein expression.) Minor perturbations in PMM/PGM(S108C) are small shifts of backbone atoms near His308 at the beginning of a helix abutting the active site (central background of cleft in Figure 10), and at positions in D4.
Figure 10.
Crystal structure of PMM/PGM(S108C). (a) Its backbone ribbon diagram (green) is superimposed on that of wt enzyme (pink). Disordered segments in D1 are marked with arrows. (b) Electron density maps fitted with yellow sticks show the disordered region of the S108C mutant, again superimposed with the wt structure (pink ribbon) for reference. The 2Fo-Fc map is shown in blue and contoured at 1.0 sigma. The Fo-Fc map is shown in green/red and contoured at 3.0/−3.0 sigma. The metal ion is shown as a gray sphere and the phosphate ion as a stick model.
In the crystal structure, disordered residues are also present nearby at Tyr17 – Leu27 (Figure 10). These regions are linked by hydrogen bonds between β-strands from Asp113 – Asn115 and Arg20 – Val23. NMR, however, suggests that both of these β-strands remain in the S108C mutant enzyme in solution. The SSP values are nearly the same as wt enzyme throughout the entire sequence except for two loops in the active site (Figure 3). 13C NMR chemical shifts suggest that disorder in solution from the S108C lesion may be confined to the regions of Gly107–Asn110 where peaks could not be assigned and Met104–Thr106 and His329–Phe332 where there are small decreases in the size of SSP values (Figure 3). His329 packs near phosphoSer108 (Figure 9b). The medium-sized NMR peak shifts induced by S108C at Gly21, Val23, Tyr114, Phe117, and Lys118 (Figure 9a) lack any significant accompanying change in secondary structure propensity (Figure 3). The CD spectra of wt and S108C mutant enzymes also are very similar (Figure S5). Despite the disorder in the crystal structure where a β-strand was expected within residues 17–27, spectroscopy suggests the secondary structure in solution to be essentially unaffected outside the immediate vicinity of Cys108.
DISCUSSION
Relevance of Domain 4 Mobility to Catalysis
Previous studies of PMM/PGM have established that the G1,6P (or M1,6P) intermediate must reorient by 180° in the active site to regenerate phospho-enzyme and form product (Figure 1).3–5, 7 Isotope trapping experiments indicated that the G1,6P intermediate remains associated with the enzyme to form product 14-fold more frequently than it dissociates during a catalytic cycle.4 Two mutations were found that abolished retention of the intermediate.7 The mechanism for on-enzyme flipping of the intermediate is an ongoing question about α-D-phosphohexomutases.4, 7 Partial opening of the catalytic cleft through rotation of D4 was proposed to facilitate reorientation of the intermediate.4, 7 Association of G1,6P with the phosphate-binding site in D4 was hypothesized to trigger turning of the G1,6P intermediate as D4 rotates.7 Supporting this suggestion is the half-open cleft observed in the crystal structure with G1,6P bound to phosphorylated PMM/PGM, as well as mutagenesis of Arg421 of the phosphate-binding site in D4.7 The strongly electropositive field of the active site16 could retain the bisphosphorylated intermediate when the active site is partly opened for rotation of the intermediate.7 Rotation of D4 has also been regarded as pertinent to substrate binding and rate limitation.4, 7
D4 displays generally greater peak heights in TROSY and triple resonance spectra and slower 15N NMR relaxation compared to D1–D3, both for wt and S108C-substituted PMM/PGM (Figures 6 and 7). This suggests that the reorientation of D4 as a rigid body is perceptibly faster than D1–D3 in the free state of the enzyme in solution. With the X1P inhibitor saturating the active site, detectably higher average peak heights across D4 compared to D1–D3 (Figure 6) suggest the possibility that with X1P bound D4 might still reorient slightly more than D1–D3. 15N relaxation (Figure 7) suggests the rotations of D4 to occur within tens of nanoseconds, based on its rotational correlation time of up to 10% shorter than D1–D3 in the free state. This is four orders of magnitude faster than the fastest catalytic step, which is completed in 10 milliseconds.4 Hence, it is possible that many reorientations of D4 can occur within one catalytic cycle. The proposals of mechanistically significant rotations of D4 of PMM/PGM4, 7 are supported by the NMR evidences for slightly greater mobility of D4 in solution.
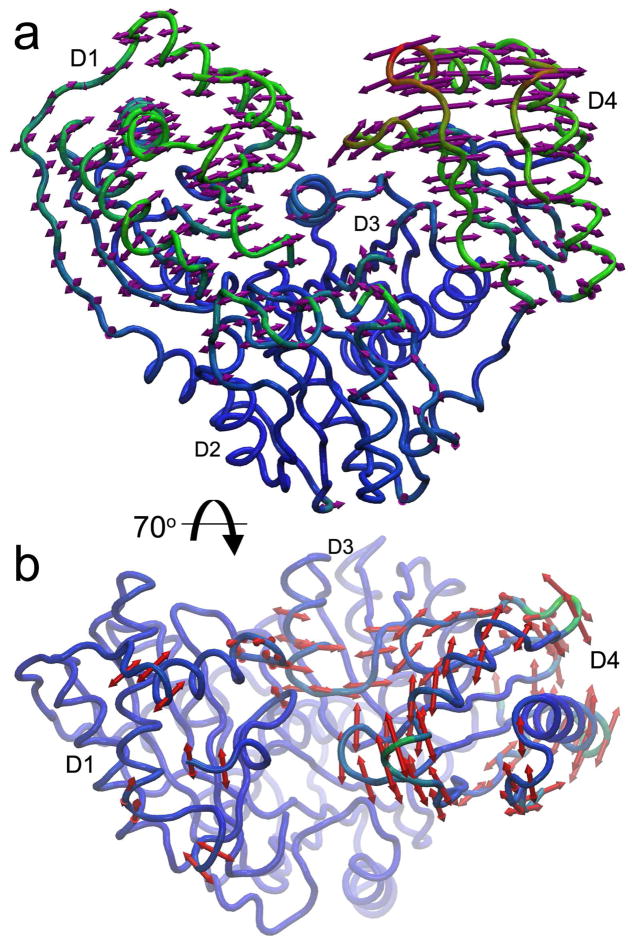
What might rigid body rotations of D4 look like? Principal component analysis (PCA) of crystal structures (ranging from open and unbound conformations to closed, ligand-bound states) points out the most likely mode of rotation of D4 is towards and away from D1, which closes and opens the catalytic cleft (Figure 11a; Movie S1). This large mode (PC1) accounts for about 82% of the statistical variance among the crystal structures. However, there are two additional modes of conformational change between crystal structures. PC2 is a rotation of D4, relative to D3 (via the interdomain hinge at Pro368); this accounts for about 9% of the variance among structures (Figure 11b). PC3 is small amplitude rocking of D4 upon D3 in a direction orthogonal to PC1, accounting for about 4% of the structural variance. The narrow interface between D3 and D4 may allow the minor modes of reorientation of D4 relative to D3, i.e., twisting (PC2) or rocking (PC3) of D4. The reorientation of D4 evidently suffices to open the active site cleft enough for reorientation of G16P or M16P for the reaction to proceed (Figure 1).
Figure 11.
Principal component analysis of conformational changes. Principal components 1 and 2 (PC1, PC2) from PCA of twelve crystal structures of P. aeruginosa PMM/PGM were obtained using ProDy41 and depicted on the half-closed conformation bound to G1,6P intermediate (PDB ID 2FKF). Coloring ranges from blue for minimal RMSD change to green for intermediate change to red for maximal change in Cartesian coordinates. (a) The main rotation (PC1) is D4 towards and away from D1, accompanied by smaller rotation of D1, as indicated by arrows. This mode accounts for ~82% of the variance among the crystallographic coordinates. (b) The second and orthogonal rotation (PC2), seen from a top view, accounts for ~9% of the variance among the crystal structures. It is largely a rotation of D4 upon D3 underneath, accompanied by limited changes in D1 and D3.
Fluctuations in Sugar-Binding Loops
The hypothesis of millisecond fluctuations among active site loops (suggested by smaller NMR peak heights and their presumed broadening; Figure 6) is partly supported by faster 15N relaxation in parts of 4 of the recognition loops, e.g., those containing Lys117 of D1, Asp283 of D3, the sugar-binding loop (Glu325–His329) of D3, and the phospho-binding loop (Arg421–Ser423) of D4. Broadening of the recognition loop containing Gly307 could instead be attributable to rapid exchange with water (not shown). In various crystal structures, two other recognition loops have multiple or varying conformations and/or side chain disorder at Arg15, Tyr17, Arg20, and Arg247. Changes of the hydrogen bonding of the side chain of Glu325 (from neighboring residues in the free state to interactions with ligands in complexes45) is consistent with lower peak heights (Figure 6) and higher 15N relaxation at this loop (Figure 7b). Intrinsic plasticity in some of the recognition loops might accommodate the adjustments of non-covalent interactions with substrates, intermediate, and products that were observed in crystal structures of their complexes with PMM/PGM.5, 7
Two Sources of Substates
The correspondence of the minor TROSY peak of 43 residues to the peak observed in the spectra of dephosphorylated wt PMM/PGM (Figure S2b) assigns them to the dephosphorylated state. The major and minor peaks of about 72 other residues of wt enzyme and about 114 residues of intrinsically dephosphorylated PMM/PGM(S108C) presumably arise from some other unidentified source. These latter minor peaks could suggest alternative conformations of slightly higher free energy than the main conformation. Slow conformational fluctuations that overlap the time scale of milliseconds can be hypothesized for at least 20 amide groups with minor peaks independent of phosphorylation state (Figure S2) and elevated 15N relaxation rates (Figure 7a,b).
S108C Defects
In the absence of G1,6P, PMM/PGM(S108C) generates G6P from G1P exceedingly slowly (Figure 8a). This contrasts with the generation of G6P by wt enzyme within a few hundred milliseconds, and maximal release of G1,6P intermediate in 10 milliseconds.4 The slow turnover by the S108C mutant cannot be attributed to inferior substrate affinity for PMM/PGM(S108C) due to the similarity of its apparent Km for G1P to that of wt enzyme (Figure S4). Upon addition of G1,6P to a reaction mixture, the S108C mutant recovers a significant fraction of wild-type competence in transforming G1P to G6P (Figure 8). This presumably occurs by introducing G1,6P productively to the active site and relieving substrate inhibition. Substrate inhibition by G1P might possibly be enhanced in PMM/PGM(S108C) by its approximately 2-fold greater apparent affinity for G1P (Figure S4). Nonetheless G1,6P still seems to compete favorably with G1P like it does in wt enzyme (Figure 8a). Thus, it appears that a catalytic rate limitation must account for the 310-fold reduction in generation of G6P in the absence of G1,6P. This could result from the lack of phosphorylation of the mutant enzyme. Since pre-incubation of PMM/PGM(S108C) with G1,6P failed either to accumulate detectable phosphorylation or to shorten reaction lag phase (compared to adding it at the start of the reaction), any phosphorylation of the mutant enzyme is not faster than its dephosphorylation. The addition of G1,6P might slightly or transiently phosphorylate an alternative side chain (possibly even Cys108) to an experimentally undetectable level, but sufficient for the activity observed to be 7- to 30-fold slower than wild type (Figures 7 and S4). Alternative side chains for phosphoryl transfer were considered without finding a single essential residue.19 The similarly impaired conversion of G1P to G6P by S108A and S108D mutants19 suggests that they share the same bottleneck.
Though the electron density for residues 17–27 and 113–115 is lost in the crystal of PMM/PGM(S108C) (Figure 10) and chemical shift perturbations of ~0.2 ppm occur at the two β-strands therein (Figure 9a), their NMR secondary structure propensities remain virtually unchanged (Figure 3). This suggests little consequence of the mutation on either the loops or β-strands therein (Ile19 to Val22 and Tyr114 to Val121) in solution. The chemical shift perturbations (Figure 9a) and small changes to secondary structure propensities (Figure 3) agree upon a small effect of the S108C mutation on the nearby sugar-binding loop (Glu325 – His329) in solution. However, these and the other small to medium-sized chemical shift changes surrounding the bottom of the active site in D1 to D3 (purple in Figure 9b) are not accompanied by corresponding changes in the crystal structure, suggesting only subtle effects in solution.
Higher NMR peak heights of D4 in the X1P inhibitor complex with S108C-substituted enzyme (Figure 6) raises the question of whether D4 in this complex retains slightly greater freedom in solution. If so, this could be consistent with the widening of the cleft observed in the crystal structure of the S108A mutant.16 The possibility of the loosening of conformational restraints on D4 by removal of phosphoSer108 might be due to the loss of its electrostatic attraction for the nearest positive charges in D4 (Arg421, Arg432, and Lys385).
Summary
The NMR characterization of multi-domain PMM/PGM is opening opportunities for studying the functional interplay among its domains in solution, vis-à-vis well-established crystallography and enzymology results. Insights from solution NMR and crystallography are proving to be complementary for this system. While the S108C mutation is accompanied by disorder of residues 17–27 in the crystallographic electron density, NMR suggests the β-strand and flanking loops therein probably remain unchanged in solution. In contrast, NMR detects small perturbations of peaks of domains 2 and 3 in the S108C mutant, despite no apparent changes there in the crystal structure. Impaired catalysis by the S108C lesion could simplify future investigations of substrate/product binding when done in the absence of the G1,6P activator. NMR reveals the presence of different states of the enzyme, including phosphorylated and dephosphorylated, affecting a quarter or more of the backbone. 15N NMR relaxation and peak heights are suggestive of (a) slightly greater and different rotational diffusion of domain 4, possibly detectable even with an inhibitor-bound, and (b) millisecond fluctuations affecting at least four ligand-binding loops around the active site. This is consistent with the conformational variability of this domain observed from crystal structures. The lines of evidence for slightly independent mobility of domain 4 in solution corroborates the working hypothesis that domain 4 rotation is important to the multi-step catalysis of PMM/PGM7, a topic promising for further investigation.
Supplementary Material
Acknowledgments
Dale Karr and Andrew Schramm provided protein preparative support. Prof. Tom Mawhinney synthesized the xylose-1-phosphate. We thank Prof. Cristina Furdui for discussion of enzyme kinetics results and Dr. Beverly Dague of the Gehrke Proteomics Center for mass spectra.
Funding
Grants from the National Science Foundation (MCB 0918389), the National Institutes of Health (R03AI074779), and the University of Missouri Research Board supported this work. The University of Missouri and National Institutes of Health grant RR022341 generously supported acquisition of the 800 MHz NMR spectrometer used.
Abbreviations
- CD
circular dichroism
- D1-D4
domain 1 to domain 4
- DD-CSA
dipole-dipole/chemical shift anisotropy
- GS
generic spin system
- G1P
glucose-1-phosphate
- G1, 6P
glucose-1,6-bisphosphate
- G6P
glucose-6-phosphate
- LPS
lipopolysaccharide
- M1, 6P
mannose-1,6-bisphosphate
- PCA
principal component analysis
- PMM/PGM or PMM
phosphomannomutase/phosphoglucomutase
- SSP
secondary structure propensity
- TROSY
transverse relaxation-optimized spectroscopy
- wt
wild-type
- X1P
xylose-1-phosphate
Footnotes
Accession Numbers
The NMR peak assignments have been deposited in the BioMagResBank under accession number 17602 for major and minor peaks of wt PMM/PGM and 17652 for PMM/PGM(S108C). The coordinates of PMM/PGM(S108C) have been deposited at the Rutgers Center for Structural Biology under PDB ID 3RSM.
Seven figures and one movie with this article online: examples of major and minor amide NMR peaks (Figure S1), chemical shift differences between major and minor peaks and between dephospho and phosphorylated enzymes (Figure S2), mass spectra (Figure S3), steady-state enzyme kinetics of wt and S108C-substituted PMM (Figure S4), similarity of CD spectra of wt and S108C mutant enzymes (Figure S5), 15N ηxy relaxation of PMM/PGM(S108C)(Figure S6), the diffusion tensors of D1– D3 and D4 (Figure S7), and crystallographic range of opening of the catalytic cleft derived using PCA (Movie S1). This material is available free of charge via the Internet at http://pubs.acs.org.
References
- 1.Ray WJ, Jr, Roscelli GA. A Kinetic Study of the Phosphoglucomutase Pathway. The Journal of biological chemistry. 1964;239:1228–1236. [PubMed] [Google Scholar]
- 2.Shackelford GS, Regni CA, Beamer LJ. Evolutionary trace analysis of the alpha-D-phosphohexomutase superfamily. Protein Sci. 2004;13:2130–2138. doi: 10.1110/ps.04801104. [DOI] [PMC free article] [PubMed] [Google Scholar]
- 3.Naught LE, Tipton PA. Kinetic Mechanism and pH Dependence of the Kinetic Parameters of Pseudomonas aeruginosa Phosphomannomutase/Phosphoglucomutase. Arch Biochem Biophys. 2001;396:111–118. doi: 10.1006/abbi.2001.2618. [DOI] [PubMed] [Google Scholar]
- 4.Naught LE, Tipton PA. Formation and reorientation of glucose 1,6-bisphosphate in the PMM/PGM reaction: transient-state kinetic studies. Biochemistry. 2005;44:6831–6836. doi: 10.1021/bi0501380. [DOI] [PubMed] [Google Scholar]
- 5.Regni C, Naught LE, Tipton PA, Beamer LJ. Structural basis of diverse substrate recognition by the enzyme PMM/PGM from P. aeruginosa. Structure. 2004;12:55–63. doi: 10.1016/j.str.2003.11.015. [DOI] [PubMed] [Google Scholar]
- 6.Ye RW, Zielinski NA, Chakrabarty AM. Purification and characterization of phosphomannomutase/phosphoglucomutase from Pseudomonas aeruginosa involved in biosynthesis of both alginate and lipopolysaccharide. J Bacteriol. 1994;176:4851–4857. doi: 10.1128/jb.176.16.4851-4857.1994. [DOI] [PMC free article] [PubMed] [Google Scholar]
- 7.Regni C, Schramm AM, Beamer LJ. The Reaction of Phosphohexomutase from Pseudomonas aeruginosa: STRUCTURAL INSIGHTS INTO A SIMPLE PROCESSIVE ENZYME. J Biol Chem. 2006;281:15564–15571. doi: 10.1074/jbc.M600590200. [DOI] [PubMed] [Google Scholar]
- 8.King JD, Kocíncová D, Westman EL, Lam JS. Review: Lipopolysaccharide biosynthesis in Pseudomonas aeruginosa. Innate Immunity. 2009;15:261–312. doi: 10.1177/1753425909106436. [DOI] [PubMed] [Google Scholar]
- 9.Olvera C, Goldberg JB, Sanchez R, Soberon-Chavez G. The Pseudomonas aeruginosa algC gene product participates in rhamnolipid biosynthesis. FEMS Microbiol Lett. 1999;179:85–90. doi: 10.1111/j.1574-6968.1999.tb08712.x. [DOI] [PubMed] [Google Scholar]
- 10.Rocchetta HL, Pacan JC, Lam JS. Synthesis of the A-band polysaccharide sugar D-rhamnose requires Rmd and WbpW: identification of multiple AlgA homologues, WbpW and ORF488, in Pseudomonas aeruginosa. Mol Microbiol. 1998;29:397–398. doi: 10.1046/j.1365-2958.1998.01024.x. [DOI] [PubMed] [Google Scholar]
- 11.Remminghorst U, Rehm BH. Bacterial alginates: from biosynthesis to applications. Biotechnol Lett. 2006;28:1701–1712. doi: 10.1007/s10529-006-9156-x. [DOI] [PubMed] [Google Scholar]
- 12.Hentzer M, Teitzel GM, Balzer GJ, Heydorn A, Molin S, Givskov M, Parsek MR. Alginate Overproduction Affects Pseudomonas aeruginosa Biofilm Structure and Function. J Bacteriol. 2001;183:5395–5401. doi: 10.1128/JB.183.18.5395-5401.2001. [DOI] [PMC free article] [PubMed] [Google Scholar]
- 13.Govan JRW, Deretic V. Microbial pathogenesis in cystic fibrosis - Mucoid Pseudomonas aeruginosa and Burkholderia cepacia. Microbiol Rev. 1996;60:539–574. doi: 10.1128/mr.60.3.539-574.1996. [DOI] [PMC free article] [PubMed] [Google Scholar]
- 14.Li XJ, Li Q, Si LY, Yuan QY. Bacteriological Differences Between Patients with Acute Exacerbation of COPD and Community-Acquired Pneumonia. Respiratory care. 2011;56 doi: 10.4187/respcare.00915. [DOI] [PubMed] [Google Scholar]
- 15.Lowry OH, Passonneau JV. Phosphoglucomutase kinetics with the phosphates of fructose, glucose, mannose, ribose, and galactose. J Biol Chem. 1969;244:910–916. [PubMed] [Google Scholar]
- 16.Regni C, Tipton PA, Beamer LJ. Crystal structure of PMM/PGM: an enzyme in the biosynthetic pathway of P. aeruginosa virulence factors. Structure. 2002;10:269–279. doi: 10.1016/s0969-2126(02)00705-0. [DOI] [PubMed] [Google Scholar]
- 17.Murzin AG, Brenner SE, Hubbard T, Chothia C. SCOP: a structural classification of proteins database for the investigation of sequences and structures. J Mol Biol. 1995;247:536–540. doi: 10.1006/jmbi.1995.0159. [DOI] [PubMed] [Google Scholar]
- 18.Regni C, Shackelford GS, Beamer LJ. Complexes of the enzyme phosphomannomutase/phosphoglucomutase with a slow substrate and an inhibitor. Acta Crystallograph Sect F Struct Biol Cryst Commun. 2006;62:722–726. doi: 10.1107/S1744309106025887. [DOI] [PMC free article] [PubMed] [Google Scholar]
- 19.Naught LE, Regni C, Beamer LJ, Tipton PA. Roles of active site residues in P. aeruginosa phosphomannomutase/phosphoglucomutase. Biochemistry. 2003;42:9946–9951. doi: 10.1021/bi034673g. [DOI] [PubMed] [Google Scholar]
- 20.Riek R, Pervushin K, Wuthrich K. TROSY and CRINEPT: NMR with large molecular and supramolecular structures in solution. Trends Biochem Sci. 2000;25:462–468. doi: 10.1016/s0968-0004(00)01665-0. [DOI] [PubMed] [Google Scholar]
- 21.Salzmann M, Pervushin K, Wider G, Senn H, Wuthrich K. TROSY in triple-resonance experiments: new perspectives for sequential NMR assignment of large proteins. Proc Natl Acad Sci U S A. 1998;95:13585–13590. doi: 10.1073/pnas.95.23.13585. [DOI] [PMC free article] [PubMed] [Google Scholar]
- 22.Tugarinov V, Muhandiram R, Ayed A, Kay LE. Four-dimensional NMR spectroscopy of a 723-residue protein: chemical shift assignments and secondary structure of malate synthase g. J Am Chem Soc. 2002;124:10025–10035. doi: 10.1021/ja0205636. [DOI] [PubMed] [Google Scholar]
- 23.Edison AS, Abildgaard F, Westler WM, Mooberry ES, Markley JL. Practical Introduction to Theory and Implementation of Multinuclear, Multidimensional Nuclear Magnetic Resonance Experiments. Methods Enzymol. 1994;239:3–79. doi: 10.1016/s0076-6879(94)39003-7. [DOI] [PubMed] [Google Scholar]
- 24.Delaglio F, Grzesiek S, Vuister GW, Zhu G, Pfeifer J, Bax A. NMRPipe: a multidimensional spectral processing system based on UNIX pipes. J Biomol NMR. 1995;6:277–293. doi: 10.1007/BF00197809. [DOI] [PubMed] [Google Scholar]
- 25.Goddard TD, Kneller DG. SPARKY. University of California; San Francisco, San Francisco: 2000. [Google Scholar]
- 26.Grzesiek S, Bax A. Amino acid type determination in the sequential assignment procedure of uniformly 13C/15N-enriched proteins. J Biomol NMR. 1993;3:185–204. doi: 10.1007/BF00178261. [DOI] [PubMed] [Google Scholar]
- 27.Jung YS, Zweckstetter M. Mars -- robust automatic backbone assignment of proteins. J Biomol NMR. 2004;30:11–23. doi: 10.1023/B:JNMR.0000042954.99056.ad. [DOI] [PubMed] [Google Scholar]
- 28.Crippen G, Rousaki A, Revington M, Zhang Y, Zuiderweg E. SAGA: rapid automatic mainchain NMR assignment for large proteins. J Biomol NMR. 2010;46:281–298. doi: 10.1007/s10858-010-9403-2. [DOI] [PubMed] [Google Scholar]
- 29.Marsh JA, Singh VK, Jia Z, Forman-Kay JD. Sensitivity of secondary structure propensities to sequence differences between alpha- and gamma-synuclein: implications for fibrillation. Protein Sci. 2006;15:2795–2804. doi: 10.1110/ps.062465306. [DOI] [PMC free article] [PubMed] [Google Scholar]
- 30.Wishart DS, Arndt D, Berjanskii M, Tang P, Zhou J, Lin G. CS23D: a web server for rapid protein structure generation using NMR chemical shifts and sequence data. Nucleic Acids Res. 2008;36:W496–502. doi: 10.1093/nar/gkn305. [DOI] [PMC free article] [PubMed] [Google Scholar]
- 31.Zhu G, Xia Y, Nicholson LK, Sze KH. Protein Dynamics Measurements by TROSY-Based NMR Experiments. J Magn Reson. 2000;143:423–426. doi: 10.1006/jmre.2000.2022. [DOI] [PubMed] [Google Scholar]
- 32.Liu Y, Prestegard JH. Direct measurement of dipole-dipole/CSA cross-correlated relaxation by a constant-time experiment. J Magn Reson. 2008;193:23–31. doi: 10.1016/j.jmr.2008.03.013. [DOI] [PMC free article] [PubMed] [Google Scholar]
- 33.Fushman D, Weisemann R, Thüring H, Rüterjans H. Backbone dynamics of ribonuclease T1 and its complex with 2′GMP studied by two-dimensional heteronuclear NMR spectroscopy. J Biomol NMR. 1994;4:61–78. doi: 10.1007/BF00178336. [DOI] [PubMed] [Google Scholar]
- 34.Lee D, Hilty C, Wider G, Wüthrich K. Effective rotational correlation times of proteins from NMR relaxation interference. J Magn Reson. 2006;178:72–76. doi: 10.1016/j.jmr.2005.08.014. [DOI] [PubMed] [Google Scholar]
- 35.Dosset P, Hus JC, Blackledge M, Marion D. Efficient analysis of macromolecular rotational diffusion from heteronuclear relaxation data. J Biomol NMR. 2000;16:23–28. doi: 10.1023/a:1008305808620. [DOI] [PubMed] [Google Scholar]
- 36.Regni CA, Tipton PA, Beamer LJ. Crystallization and initial crystallographic analysis of phosphomannomutase/phosphoglucomutase from Pseudomonas aeruginosa. Acta Crystallogr D. 2000;56:761–762. doi: 10.1107/s0907444900004431. [DOI] [PubMed] [Google Scholar]
- 37.Pflugrath J. The finer things in X-ray diffraction data collection. Acta Crystallographica Section D. 1999;55:1718–1725. doi: 10.1107/s090744499900935x. [DOI] [PubMed] [Google Scholar]
- 38.Murshudov GN, Vagin AA, Lebedev A, Wilson KS, Dodson EJ. Efficient anisotropic refinement of macromolecular structures using FFT. Acta Crystallographica Section D. 1999;55:247–255. doi: 10.1107/S090744499801405X. [DOI] [PubMed] [Google Scholar]
- 39.Emsley P, Cowtan K. Coot: model-building tools for molecular graphics. Acta Crystallographica Section D. 2004;60:2126–2132. doi: 10.1107/S0907444904019158. [DOI] [PubMed] [Google Scholar]
- 40.Bakan A, Bahar I. The intrinsic dynamics of enzymes plays a dominant role in determining the structural changes induced upon inhibitor binding. Proceedings of the National Academy of Sciences. 2009;106:14349–14354. doi: 10.1073/pnas.0904214106. [DOI] [PMC free article] [PubMed] [Google Scholar]
- 41.Bakan A, Meireles LM, Bahar I. ProDy: Protein Dynamics Inferred from Theory and Experiments. Bioinformatics. 2011 doi: 10.1093/bioinformatics/btr168. [DOI] [PMC free article] [PubMed] [Google Scholar]
- 42.Revington M, Zuiderweg ER. TROSY-driven NMR backbone assignments of the 381-residue nucleotide-binding domain of the Thermus Thermophilus DnaK molecular chaperone. J Biomol NMR. 2004;30:113–114. doi: 10.1023/B:JNMR.0000042961.48233.f9. [DOI] [PubMed] [Google Scholar]
- 43.Aurora R, Rose GD. Helix capping. Protein Sci. 1998;7:21–38. doi: 10.1002/pro.5560070103. [DOI] [PMC free article] [PubMed] [Google Scholar]
- 44.Bertelsen EB, Chang L, Gestwicki JE, Zuiderweg ERP. Solution conformation of wild-type E. coli Hsp70 (DnaK) chaperone complexed with ADP and substrate. Proceedings of the National Academy of Sciences. 2009;106:8471–8476. doi: 10.1073/pnas.0903503106. [DOI] [PMC free article] [PubMed] [Google Scholar]
- 45.Schramm AM, Mehra-Chaudhary R, Furdui CM, Beamer LJ. Backbone flexibility, conformational change, and catalysis in a phosphohexomutase from Pseudomonas aeruginosa. Biochemistry. 2008;47:9154–9162. doi: 10.1021/bi8005219. [DOI] [PubMed] [Google Scholar]
Associated Data
This section collects any data citations, data availability statements, or supplementary materials included in this article.


