

Abstract
Alexander disease is a fatal neurodegenerative disease caused by dominant mutations in glial fibrillary acidic protein (GFAP). The disease is characterized by protein inclusions called Rosenthal fibers within astrocyte cell bodies and processes, and an antioxidant response mediated by the transcription factor Nrf2. We sought to test whether further elevation of Nrf2 would be beneficial in a mouse model of Alexander disease. Forcing overexpression of Nrf2 in astrocytes of R236H GFAP mutant mice decreased GFAP protein in all brain regions examined (olfactory bulb, hippocampus, cerebral cortex, brainstem, cerebellum, and spinal cord) and decreased Rosenthal fibers in olfactory bulb, hippocampus, corpus callosum, and brainstem. Nrf2 overexpression also restored body weights of R236H mice to near wild-type levels. Nrf2 regulates several genes involved in homeostasis of the antioxidant molecule glutathione, and the neuroprotective effects of Nrf2 in other neurological disorders may reflect restoration of glutathione to normal levels. However, glutathione levels in R236H mice were not decreased. Nrf2 overexpression did not change glutathione levels or ratio of reduced to oxidized glutathione (indicative of oxidative stress) in olfactory bulb, where Nrf2 dramatically reduced GFAP. Depletion of glutathione through knock-out of the GCLM (glutamate–cysteine ligase modifier subunit) also did not affect GFAP levels or body weight of R236H mice. These data suggest that the beneficial effects of Nrf2 are not mediated through glutathione.
Introduction
Alexander disease is a fatal neurodegenerative disorder caused by dominant mutations in the astrocyte intermediate filament glial fibrillary acidic protein (GFAP) (Brenner et al., 2001). Alexander disease patients can be divided into two classes (Prust et al., 2011). Type I is characterized by an early onset, usually before 4 years of age, and patients often have seizures, macrocephaly, and developmental delays. Pathology involves the frontal white matter, and median survival is 14 years from the age of onset. Type II can occur at any age, but usually after age 4, and it is characterized by autonomic and bulbar dysfunction due to brainstem, cerebellum, and spinal cord atrophy. Type II is less severe, and median survival is 25 years from age of onset.
All forms of Alexander disease are characterized by cytoplasmic protein inclusions in astrocytes, called Rosenthal fibers, that contain GFAP, vimentin, plectin, and small heat shock proteins (Alexander, 1949; Goldman and Corbin, 1988; Iwaki et al., 1989, 1993; Tian et al., 2006). Accumulation of GFAP above an undefined toxic threshold is thought to lead to a positive-feedback loop contributing to further increases in GFAP expression and accumulation, and to exacerbation of the toxic effects of mutant GFAP (Tang et al., 2006).
Another central element in Alexander disease pathogenesis is upregulation of stress response-related genes (Hagemann et al., 2005). Nuclear factor (erythroid-derived 2)-like 2 (Nrf2) is a transcription factor that coordinates the stress response by activating a consensus antioxidant response element (ARE) in the promoter regions of many phase II detoxification enzymes and cytoprotective genes, including NAD(P)H dehydrogenase quinone 1 (NQO1) and genes involved in the synthesis and homeostasis of the antioxidant molecule glutathione, such as glutamate–cysteine ligase modifier subunit (GCLM). These molecules provide neuroprotection against oxidative stress by scavenging free radicals, detoxifying xenobiotics, and maintaining the intracellular redox state (for review, see Calkins et al., 2009).
Overexpression of Nrf2 in astrocytes is protective in mouse models of amyotrophic lateral sclerosis (ALS) (Vargas et al., 2008), Parkinson's disease (Jakel et al., 2007; Chen et al., 2009), and Huntington's disease (Calkins et al., 2005, 2010b), partly through restoration of glutathione levels. Although Nrf2 activity is already increased in Alexander disease (Hagemann et al., 2005, 2006), we sought to test whether further elevation of Nrf2, specifically in astrocytes, would be beneficial in a mouse model of Alexander disease. Knock-in mice with the R236H point mutation (homologous to the common human R239H mutation) replicate several features of Alexander disease, including elevated levels of GFAP, formation of Rosenthal fibers, increased susceptibility to kainate-induced seizures, and an increased stress response (Hagemann et al., 2006). Here, we show that astrocyte-specific overexpression of Nrf2 decreases GFAP transcripts, GFAP protein, and Rosenthal fibers in several brain regions of R236H/+ mice. Interestingly, we are unable to detect an imbalance of oxidized glutathione in the Alexander disease mice, and disease phenotypes do not worsen under conditions in which glutathione has been decreased. Hence, the protection conferred by Nrf2 is likely not due to effects on glutathione.
Materials and Methods
Mice.
Knock-in mice with the GFAP-R236H point mutation were generated as previously described (Hagemann et al., 2006) and maintained in either FVB/N (for GFAP-Nrf2 crosses) or C57BL/6J backgrounds (for GCLM crosses). Transgenic mice with a 51 bp ARE from the rat NAD(P)H quinone oxidoreductase-1 (Nqo1) promoter followed by a human placental alkaline phosphatase reporter (ARE-hPAP, line TgQR-15) (Johnson et al., 2002) and transgenic mice overexpressing mouse Nrf2 under control of a 2.2 kb human GFAP promoter (GFAP-Nrf2.2 and GFAP-Nrf2.4, corresponding to lines Tg173.2 and Tg173.4) were maintained in an FVB/N background. Previous studies have exclusively used the GFAP-Nrf2.4 line of mice (Vargas et al., 2008; Chen et al., 2009; Calkins et al., 2010b), while the current study used GFAP-Nrf2.2 mice for the majority of experiments. In Results and Discussion, GFAP-Nrf2 refers to the GFAP-Nrf2.2 mice. GCLM knock-out mice were maintained in a C57BL/6J background (Yang et al., 2002). Male and female mice were used for experiments, and data from each sex were analyzed separately unless otherwise indicated. All tissues were collected from 12-week-old mice.
hPAP stain.
ARE-hPAP transgenic mice were anesthetized with 20 mg/ml tribromoethanol in 2% tert-amyl alcohol and perfused intracardially with PBS followed by 4% paraformaldehyde in 0.1 m phosphate buffer, pH 7.4. Brains were postfixed 2 h at room temperature, dehydrated in 70% ethanol, and processed for paraffin sectioning (6 μm). After deparaffinization and rehydration, sections were heated at 65°C in alkaline phosphatase (AP) buffer (0.1 m Tris, 0.1 m NaCl, 50 mm MgCl2, pH 9.0) for 1 h to inactivate endogenous phosphatases, and then incubated in 5-bromo-4-chloro-3-indolyl phosphate disodium salt (BCIP)/nitrotetrazolium blue chloride (NBT)/AP buffer [170 μg/ml BCIP (Sigma-Aldrich) and 340 μg/ml NBT (Sigma-Aldrich) in AP buffer] for 1 h at room temperature or BCIP/AP buffer for 48 h at 37°C. Sections were rinsed in water and coverslipped with VectamountAQ mounting media (Vector Laboratories). Bright-field images were collected on a Nikon SMZ-U microscope using a Zeiss AxioCam camera. Adobe Photoshop CS4 was used to exclude unrelated tissues that were in the field of view, but no other adjustments were made to the images.
Tissue collection.
Mice were killed by CO2, and brains were removed and dissected in ice-cold PBS into hemispheres and then regions, so that regional samples represent one-half of each brain. Regions collected were as follows: olfactory bulb, hippocampus, cortex overlying the hippocampus (including somatosensory, visual, auditory, ectorhinal, perirhinal, entorhinal, and piriform cortices) and underlying white matter (abbreviated as “cortex ” in Results), cerebellum, brainstem, and cervical spinal cord. For some experiments, one hemisphere per mouse was used in its entirety, and data from these samples are referred to as “whole brain ” in Results and Discussion. Tissues were immediately frozen in liquid nitrogen and stored at −80°C.
hPAP quantitative assay.
Procedures for quantification of ARE-hPAP reporter activity are modified from Hagemann et al. (2006). Frozen tissues were homogenized in TMNC lysis buffer (50 mm Tris, 5 mm MgCl2, 10 mm NaCl, 4% CHAPS) at 1.25 ml/hemisphere or 0.5 ml/brain region using a Geno/Grinder (OPS Diagnostics) at 1750 rpm for 5 min. Hemispheres were further diluted in TMNC lysis buffer to bring the total volume to 2 ml/hemisphere. Samples were diluted 1:10 in TMNC lysis buffer, and protein was quantified using the Pierce BCA Protein Assay Kit (Thermo Fisher Scientific). Seventy-five microliters of 200 mm diethanolamine, pH 9.5–10.0, was added to wells of a microtiter plate, followed by 25 μl of samples. The plate was heated to 65°C to inactivate endogenous alkaline phosphatases, cooled to room temperature, and then 100 μl of chemiluminescent substrate mix [0.83 mm CSPD (Applied Biosystems/Life Technologies; T2042), 20% Emerald Enhancer (Applied Biosystems; T2002), 5 mm MgCl2, 150 mm diethanolamine] was added per well. Enzyme activity was quantified using a GloRunner microplate luminometer (Turner Biosystems).
Quantitative PCR.
Total RNA from male mice was isolated and purified using Trizol as described in the manufacturer's instructions (Invitrogen). RNA concentration was quantified on a NanoDrop spectrophotometer (Thermo Fisher Scientific) and converted to cDNA using SuperScript III reverse transcriptase according to the manufacturer's instructions (Invitrogen). Primers were designed (Table 1) and standards generated as previously described (Hagemann et al., 2005). Reactions were performed in triplicate for standards and duplicate for samples with Power SYBR Green PCR Master Mix (Applied Biosystems/Life Technologies) on an Applied Biosystems 7500 Real-Time PCR System. Relative concentrations were calculated based on standard curves and normalized to 18S ribosomal RNA and TATA box binding protein (TBP). Similar results were obtained for normalization to 18S and TBP, so data normalized to 18S are presented here.
Table 1.
Primers used for quantitative PCR
| Gene | Accession no. | Forward primer | Reverse primer |
|---|---|---|---|
| Nfe2l2 (Nrf2) | NM_010902 | GAT CCG CCA GCT ACT CCC AGG TTG | CAG GGC AAG CGA CTC ATG GTC ATC |
| Nqo1 | NM_008706 | CGG TAT TAC GAT CCT CCC TCA ACA | AGC CTC TAC AGC AGC CTC CTT CAT |
| GFAP | NM_010277 | GAC TGT GGA GAT GCG GGA TGG TGA | GTG CTG GTG TGG GTG GGA ACT GAG |
| 18S (ribosomal RNA) | NR_003278 | CGC CGC TAG AGG TGA AAT TCT | CGA ACC TCC GAC TTT CGT TCT |
| TATA box binding protein (TBP) | NM_013684 | GCA CAG GAG CCA AGA GTG A | CCC ACC ATG TTC TGG ATC TT |
GFAP ELISA.
Tissues were homogenized in 2% SDS, 50 mm Tris, pH 7.4, 5 mm EDTA, pH 7.4, 1× Complete Protease Inhibitor Cocktail (Roche Diagnostics) and 1 mm Pefabloc (Sigma-Aldrich) at 3.5 ml/hemisphere, 0.4 ml/brain region for olfactory bulb, hippocampus, cortex, and cervical spinal cord, or 0.8 ml/brain region for brainstem and cerebellum using a Geno/Grinder (OPS Diagnostics) at 1750 rpm for 5 min. Total protein concentration was measured using the Pierce BCA Protein Assay kit (Thermo Fisher Scientific). Samples and GFAP standards of known concentration were diluted in PBS with 0.5% Triton X and 1% BSA. For sandwich ELISA [protocol modified from Hagemann et al. (2009)], plates were coated with SMI-26 (1:1000; anti-GFAP monoclonal mixture; Covance), blocked with 5% nonfat dry milk, incubated with samples and standards, and then incubated with polyclonal rabbit anti-cow GFAP (1:5000; Z0334; Dako), followed by goat anti-rabbit HRP (1:10,000), and then SuperSignal ELISA Femto Maximum Sensitivity Substrate (Thermo Fisher Scientific). Chemiluminescence was measured on a GloRunner microplate luminometer (Turner Biosystems).
Preparation of frozen sections.
Mice were perfused intracardially with room temperature PBS followed by fresh 4% paraformaldehyde in 0.1 m phosphate buffer, pH 7.4. Brains were postfixed overnight at 4°C, cryoprotected in graded concentrations of sucrose in PBS (∼5 h at 10%, ∼20 h at 20%, >48 h at 30%), embedded in Tissue-Tek OCT compound (Sakura Finetek), frozen in a dry ice/ethanol bath, and sectioned at 16 μm on a cryostat.
GFAP immunolabeling.
Frozen sections were rehydrated in PBS, blocked in 5% normal donkey serum (DS) with 0.1% Triton X, and then incubated with mouse anti-GFAP (1:1000; clone GA5; MAB3402; Millipore Bioscience Research Reagents) in blocking solution followed by donkey anti-mouse Alexa 488 (1:1000; Invitrogen) in 5% DS. Slides were coverslipped using Vectashield mounting media with DAPI (Vector Laboratories) and imaged on a Nikon 80i confocal microscope. Images are maximum-intensity projections of 7 μm z-stacks (7 × 1 μm z-sections per stack).
Rosenthal fiber stereology.
Parameters for stereological analysis were determined from a small pilot experiment. Sixteen micrometer frozen coronal sections from male mouse brains were collected at the following intervals: olfactory bulb, 1:20 (10–11 sections); corpus callosum, 1:30 (9–11 sections); hippocampus, 1:15 (12–13 sections); and brainstem, 1:10 (12–14 sections). Anatomical boundaries of the brain regions were defined as follows [coordinates are anterior–posterior from bregma and based on Paxinos and Franklin (2001)]: olfactory bulb, includes the main olfactory bulb and accessory olfactory areas from the beginning of the olfactory bulbs until +2.10 mm, and does not include cortical areas; corpus callosum, also includes the cingulum and external capsules, from +1.98 to −2.54 mm (where the corpus callosum is no longer connected across the midline); hippocampus, from −0.94 to −4.04 mm; brainstem, includes brainstem areas from −5.34 mm (where the fourth ventricle begins) to −7.48 mm (at the junction of the fourth ventricle with the central canal) and does not include cerebellum. Frozen sections were stained with H&E as follows: air dry for 10 min, dH2O for 3 min, Mayer's hematoxylin for 5 min (MHS16; Sigma-Aldrich), running tap H2O for 1 min, 1× PBS until blue, dH2O for 30 s, 95% ethanol for 30 s, eosin Y in ethanol (plus 100 μl of glacial acetic acid per 200 ml of eosin immediately before use) for 5 min (0.5% eosin in acidified 90% ethanol; HTT10-1; Sigma-Aldrich), 95% ethanol two times for 1 min each, 100% ethanol three times for 1.5 min each, xylenes two times for 2 min each, and coverslip with Permount (Thermo Fisher Scientific). Slides were separated by brain region, and then masked so that observers were blinded to the genotype and unable to compare results between regions for one mouse (except corpus callosum and hippocampus). Rosenthal fiber area fraction in each brain region was quantified using the Area Fraction Fractionator probe of StereoInvestigator (MBF Bioscience) on a Zeiss microscope by placing sampling grids (300 × 400 μm for olfactory bulb, 260 × 360 μm for corpus callosum, 260 × 260 μm for hippocampus, and 400 × 400 μm for brainstem) over traced regions of interest. Within a 45 × 45 μm counting frame, a Cavalieri point grid (15 μm crosshair spacing so each grid point was associated with 225 μm2) was used to count crosshairs touching eosin-stained Rosenthal fibers. For each mouse, total area associated with Rosenthal fibers and total area of the region of interest were calculated by StereoInvestigator from all of the collected sections. Area fraction was then calculated as follows: (Rosenthal fiber area)/(region of interest area).
Glutathione measurement by HPLC.
Frozen tissues were sonicated in 5 ml/hemisphere or 400 μl/olfactory bulb of ice-cold 5% sulfosalicylic acid, and then centrifuged at 10,000 × g for 10 min at 4°C. The pellet fraction was used to measure protein content with the Pierce BCA Protein Assay kit (Thermo Fisher Scientific). The supernatant was used to measure reduced (GSH) and oxidized (GSSG) glutathione using normal-phase (ion exchange) HPLC as previously described (Fariss and Reed, 1987; Vargas et al., 2011). Sample GSH and GSSG quantities were calculated based on standard curves generated from standard samples with known GSH and GSSG quantities, and then normalized to protein levels measured in the pellet fractions.
Statistical analysis.
For ELISA and body weight data, littermates of the same genotype were averaged first, and then litters were averaged. qPCR, hPAP, and ELISA data from brain regions were transformed [Y = log(Y)] before performing statistical tests to equalize SDs (data presented in the figures are the original untransformed data). Comparisons among multiple genotypes used one-way ANOVA with post Bonferroni-corrected t tests for selected comparisons (for Nrf2 experiments: WT vs GFAP-Nrf2, WT vs R236H/+, WT vs R236H/+;GFAP-Nrf2, GFAP-Nrf2 vs R236H/+;GFAP-Nrf2, and R236H/+ vs R236H/+;GFAP-Nrf2; for GCLM experiments: WT vs GCLM−/−, WT vs R236H/+, WT vs R236H/+;GCLM−/−, GCLM−/− vs R236H/+;GCLM−/−, R236H/+ vs R236H/+;GCLM−/−). A two-tailed Student's t test was used for comparisons between two genotypes in stereology experiments. Statistical comparisons were not made between brain regions. The significance level was defined as 0.05 and *p < 0.05, **p < 0.01, ***p < 0.001 in all figures. Analyses were performed using GraphPad Prism 5.01 (GraphPad Software).
Results
Nrf2 mRNA is increased in GFAP-Nrf2, R236H/+, and R236H/+;GFAP-Nrf2 mice
To test whether increasing Nrf2 in astrocytes can suppress the phenotypes of a mouse model of Alexander disease, we first examined the level and pattern of Nrf2 expression in the GFAP-Nrf2 mice (GFAP-Nrf2.2 or line Tg173.2). Mice were examined at 12 weeks of age based on a previous study that showed peak levels of endogenous Nrf2 activity in R236H/+ mice at this time (Hagemann et al., 2006). Nrf2 transcript levels in GFAP-Nrf2 mice were significantly increased over wild type (WT) in all five brain regions examined: olfactory bulb, cortex, hippocampus, brainstem, and cervical spinal cord (Fig. 1A). (Note: “WT” throughout will be used to refer to mice that do not carry the GFAP-Nrf2 transgene and are wild type at the Gfap locus.) R236H/+ mice without the Nrf2 transgene displayed increased Nrf2 transcripts in only three brain regions: olfactory bulb, cortex, and hippocampus (Fig. 1A). R236H/+;GFAP-Nrf2 mice showed increased Nrf2 transcript levels compared with R236H/+ mice in all five brain regions (Fig. 1A).
Figure 1.
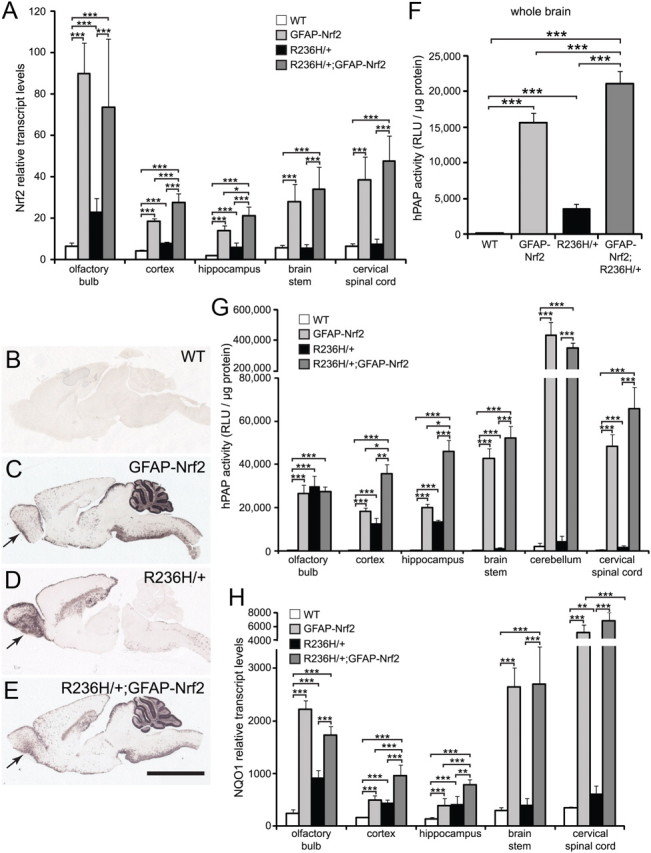
GFAP-Nrf2 mice have increased Nrf2 transcripts and Nrf2 activity at 12 weeks of age. A, Nrf2 mRNA levels were quantified in olfactory bulb, cortex, hippocampus, brainstem, and cervical spinal cord using qPCR (n = 4–7 male mice per genotype). B–E, An alkaline phosphatase reporter (hPAP) under control of the ARE shows Nrf2/ARE activity patterns in sagittal brain sections. WT mice (B) have little to no hPAP activity, while R236H/+ mice (D) have increased hPAP activity, especially in olfactory bulb, corpus callosum, and hippocampus. GFAP-Nrf2 mice (GFAP-Nrf2.2, line Tg173.2) (C) have increased hPAP levels compared with WT, especially in brainstem, cervical spinal cord, and cerebellum. hPAP levels in R236H/+;GFAP-Nrf2 mice (E) appear to be additive between GFAP-Nrf2 and R236H/+, except in olfactory bulb (arrows) where R236H/+;GFAP-Nrf2 mice have levels similar to GFAP-Nrf2. The images in B–E are representative of at least four male and four female mice per genotype. F, G, Quantification of hPAP levels for whole brain (F) and brain regions (G) mostly corresponds to hPAP staining (n = 5–11 male and female mice per genotype in F; n = 4–5 male mice per genotype in G). H, Nqo1 mRNA levels were quantified in olfactory bulb, cortex, hippocampus, brainstem, and cervical spinal cord using qPCR (n = 4–7 male mice per genotype). Transcript levels in A and H are normalized to 18S. Scale bar: B–E, 3 mm. RLU, Relative light units. Error bars are SD. *p < 0.05, **p < 0.01, ***p < 0.001.
ARE activity is increased in GFAP-Nrf2, R236H/+, and R236H/+;GFAP-Nrf2 mice
We next wanted to examine Nrf2 activity in brain using a transgenic reporter line. Nrf2 activates a consensus ARE in promoters of many genes involved in the antioxidant response. To examine spatial patterns of ARE activation in GFAP-Nrf2, R236H/+, and R236H/+;GFAP-Nrf2 mice, we used mice that also express a hPAP reporter under control of a 51 bp ARE from rat NAD(P)H dehydrogenase quinone 1 (Nqo1). Histochemical staining for hPAP in sagittal and coronal brain sections (n = 4 male and 4 female mice per genotype) showed that WT mice had minimal hPAP activity throughout the brains (sagittal sections in Fig. 1B; coronal sections not shown), while GFAP-Nrf2 mice had elevated hPAP staining in several brain regions, including olfactory bulb, corpus callosum, hippocampus (increased hPAP was more evident in coronal sections of posterior and lateral regions of hippocampus), various cortical areas, thalamus, superior and inferior colliculi, cerebellum, brainstem, and spinal cord (Fig. 1C), indicating increased ARE and Nrf2 activity due to the Nrf2 transgene. hPAP staining was also increased in R236H/+ compared with WT in olfactory bulb, the pial surface of the cortex, corpus callosum, striatum, hippocampus, brainstem, and cervical spinal cord (Fig. 1D). hPAP staining in R236H/+ mice corresponded with regions in which Rosenthal fibers are found at this age and matched our previous results using R236H/+ mice in a different background strain (Hagemann et al., 2006). hPAP staining in R236H/+;GFAP-Nrf2 mice appeared to be additive between GFAP-Nrf2 and R236H/+ mice in corpus callosum, cortex, hippocampus, brainstem, cerebellum, and cervical spinal cord (Fig. 1E). In contrast, hPAP staining in olfactory bulb of R236H/+;GFAP-Nrf2 mice appeared similar to GFAP-Nrf2 and decreased compared with R236H/+ (Fig. 1C–E, arrows). Assays at the whole-brain level confirmed that hPAP activity in GFAP-Nrf2, R236H/+, and R236H/+;GFAP-Nrf2 brains was increased compared with WT, with R236H/+;GFAP-Nrf2 being highest, and appeared to be additive between GFAP-Nrf2 and R236H/+ (Fig. 1F).
Quantitative assays for hPAP activity in individual brain regions mostly corresponded to the histochemical stain. GFAP-Nrf2 and R236H/+;GFAP-Nrf2 mice had increased hPAP levels compared with WT in all six brain regions: olfactory bulb, cortex, hippocampus, brainstem, cerebellum, and cervical spinal cord (data from male mice are in Fig. 1G; similar data from female mice are not shown). R236H/+;GFAP-Nrf2 mice also had higher hPAP levels compared with R236H/+ mice in those same regions, except olfactory bulb. R236H/+ mice had increased hPAP levels compared with WT in all brain regions except cerebellum (Fig. 1G). hPAP activity in R236H/+;GFAP-Nrf2 mice appeared to be additive between GFAP-Nrf2 and R236H/+ mice, except in olfactory bulb (Fig. 1G).
As an independent measure of Nrf2 activity, we quantified transcript levels for Nqo1, a target gene of Nrf2. As expected, Nqo1 transcripts were increased in GFAP-Nrf2 mice compared with WT and in R236H/+;GFAP-Nrf2 compared with R236H/+ in all five brain regions: olfactory bulb, cortex, hippocampus, brainstem, and cervical spinal cord (Fig. 1H). Nqo1 transcripts were also increased in R236H/+ olfactory bulb, cortex, hippocampus, and cervical spinal cord compared with WT (Fig. 1H). However, hPAP and Nqo1 results differed in some regions. For example, GFAP-Nrf2 and R236H/+;GFAP-Nrf2 olfactory bulb had higher Nqo1 transcript levels than R236H/+, but the hPAP reporter did not show a difference between GFAP-Nrf2, R236H/+;GFAP-Nrf2, and R236H/+ (Fig. 1C–E,G,H).
Nrf2 overexpression decreases GFAP in R236H/+ mice
Since one potential strategy for therapy of Alexander disease is to reduce GFAP levels, we tested whether overexpression of Nrf2 decreases Gfap transcripts. R236H/+ mice had increased Gfap transcript levels compared with WT in all five brain regions examined (Fig. 2A). Nrf2 overexpression in WT mice (GFAP-Nrf2 vs WT) decreased Gfap transcript levels in olfactory bulb but did not significantly change Gfap transcript levels in the other regions (Fig. 2A). Nrf2 overexpression in R236H/+ mice (R236H/+;GFAP-Nrf2 vs R236H/+) decreased Gfap transcript levels in olfactory bulb, cortex, and brainstem (Fig. 2A). In the olfactory bulb and brainstem, Gfap transcript levels in R236H/+;GFAP-Nrf2 mice were decreased to WT levels or below (Fig. 2A).
Figure 2.

Nrf2 overexpression decreases GFAP protein and transcript levels in 12-week-old R236H/+ mice. A, GFAP mRNA levels were quantified in olfactory bulb, cortex, hippocampus, brainstem, and cervical spinal cord using qPCR (n = 4–7 male mice per genotype). Nrf2 overexpression in R236H/+ mice (R236H/+;GFAP-Nrf2) decreased GFAP transcript levels in olfactory bulb, cortex, and brainstem. Transcript levels are normalized to 18S. B, GFAP protein levels were measured by ELISA in several brain regions (n = 5–12 male mice, 4–6 litters per genotype). R236H/+ mice have increased GFAP protein compared with WT in olfactory bulb, cortex, and hippocampus, while GFAP levels were unchanged in R236H/+ brainstem, cerebellum, and cervical spinal cord. Nrf2 overexpression in WT mice (GFAP-Nrf2) had varying effects, depending on brain region. Nrf2 overexpression in R236H/+ mice (R236H/+;GFAP-Nrf2) decreased GFAP protein levels in all brain regions except cerebellum (the decrease was statistically significant in female cerebellum; data not shown). C, D, Immunolabeling with anti-GFAP antibody shows a decrease in GFAP immunoreactivity and aggregates (arrows) in R236H/+;GFAP-Nrf2 olfactory bulb (D) compared with R236H/+ (C). Scale bar: C, D, 50 μm. Gr, Granular cell layer; IPl, internal plexiform layer; Mi, mitral cell layer; EPl, external plexiform layer. Error bars are SD in A and SE in B. *p < 0.05, **p < 0.01, ***p < 0.001.
We next tested whether astrocytic overexpression of Nrf2 decreased GFAP protein levels using an ELISA. Compared with WT, R236H/+ mice had increased GFAP protein in olfactory bulb, cortex, and hippocampus, and no change in brainstem, cerebellum, and cervical spinal cord (Fig. 2B) (GFAP is significantly decreased in female R236H/+ spinal cord; data not shown). Nrf2 overexpression had varying effects in WT mice depending on the brain region: GFAP-Nrf2 mice had decreased GFAP protein compared with WT in olfactory bulb, brainstem, and cervical spinal cord, an increase in hippocampus, and no change in cortex or cerebellum (Fig. 2B). Despite differing effects in WT mice, Nrf2 overexpression decreased GFAP levels in five brain regions of male R236H/+ mice (R236H/+;GFAP-Nrf2 vs R236H/+ in all regions except cerebellum; Fig. 2B) and in all six brain regions of female R236H/+ mice (data not shown). Immunolabeling for GFAP in brain sections also showed decreased GFAP protein and GFAP aggregates in R236H/+;GFAP-Nrf2 compared with R236H/+ mice (e.g., olfactory bulb in Fig. 2C,D).
Nrf2 overexpression decreases Rosenthal fibers
The pathological hallmark of Alexander disease is the presence of Rosenthal fibers. In olfactory bulb, R236H/+ mice had many eosinophilic Rosenthal fibers (Fig. 3A, arrows), while R236H/+;GFAP-Nrf2 mice had almost no Rosenthal fibers in olfactory bulb (Fig. 3B). We quantified this effect using stereological methods and found that Nrf2 overexpression decreased Rosenthal fiber area fractions in olfactory bulb, corpus callosum, hippocampus, and brainstem (Fig. 3C).
Figure 3.

Nrf2 overexpression decreases Rosenthal fibers. A, B, Sagittal sections of olfactory bulb granular cell layer from 12-week-old mice stained with H&E. Many eosinophilic Rosenthal fibers are stained bright pink in R236H/+ olfactory bulb (A, arrows), but R236H/+ mice overexpressing Nrf2 (B) have almost no Rosenthal fibers in olfactory bulb. C, The area fractions of olfactory bulb, corpus callosum, hippocampus, or brainstem occupied by Rosenthal fibers were quantified with stereological methods. Rosenthal fiber area fraction was decreased in all four regions examined (n = 4 male mice per genotype). Scale bar: A, B, 50 μm. RF, Rosenthal fiber. Error bars are SD. *p < 0.05, ***p < 0.001.
Nrf2 overexpression increases body weight of R236H/+ mice
Previously, we showed that Alexander disease mice have lower body weights compared with littermate controls (Hagemann et al., 2006), so we tested whether overexpression of Nrf2 reverses this phenotype. From 4 to 12 weeks of age, R236H/+ mice weighed significantly less than WT littermates, but R236H/+;GFAP-Nrf2 mice weighed more than R236H/+ mice and were not different from WT mice beginning at 4 weeks and continuing through 8 weeks of age (Fig. 4). This effect was not additive since GFAP-Nrf2 mouse body weights were not different from WT between 3 and 12 weeks of age (Fig. 4). By 10 weeks of age, the effects of Nrf2 overexpression on body weight began to diminish (Fig. 4). These results suggest that Nrf2 overexpression in astrocytes can reverse the low body weight phenotype caused by Alexander disease-related point mutations in GFAP.
Figure 4.

Nrf2 overexpression increases body weights of R236H/+ mice. Between 4 and 12 weeks of age, R236H/+ mice have lower body weights than WT littermates, but R236H/+;GFAP-Nrf2 mice weigh significantly more than R236H/+ mice between 5 and 10 weeks. The effect of Nrf2 on body weight diminishes beginning ∼10 weeks of age (n = 6–17 litters per genotype). Error bars are SE. *p < 0.05, **p < 0.01, ***p < 0.001; *versus WT, ‡versus GFAP-Nrf2.
A lower expressing line of GFAP-Nrf2 mice is not as effective at reducing GFAP
ARE-hPAP activity in a second line of GFAP-Nrf2 mice, referred to here as GFAP-Nrf2.4 (line Tg173.4) (Vargas et al., 2008), was compared with the GFAP-Nrf2 line used in the preceding experiments (line Tg173.2, referred to as GFAP-Nrf2.2 in this section). While the GFAP-Nrf2.2 mice had hPAP staining throughout the brain (as described above and in Fig. 5A), hPAP staining in the GFAP-Nrf2.4 mice was detected mainly in brainstem, cerebellum, and spinal cord (Fig. 5B). Quantification of hPAP activity showed GFAP-Nrf2.2 mice had higher levels compared with GFAP-Nrf2.4 mice in all six brain regions examined (Fig. 5C). GFAP-Nrf2.4 mice had decreased GFAP protein levels compared with WT in brainstem and cervical spinal cord, while no changes were detected in olfactory bulb, cortex, or cerebellum, and a small increase was detected in hippocampus (data not shown). Despite lower Nrf2 activity levels in the GFAP-Nrf2.4 line, R236H/+;GFAP-Nrf2.4 mice still had decreased GFAP protein in olfactory bulb and cervical spinal cord compared with R236H/+ mice, although the decrease in olfactory bulb was not as dramatic as with the GFAP-Nrf2.2 line (data not shown). GFAP protein did not change in R236H/+;GFAP-Nrf2.4 cortex, hippocampus, or brainstem, and increased in cerebellum compared with R236H/+ mice (data not shown). Crossing to the GFAP-Nrf2.4 line did not rescue the low body weight phenotype of the R236H/+ mice through 12 weeks of age (data not shown).
Figure 5.
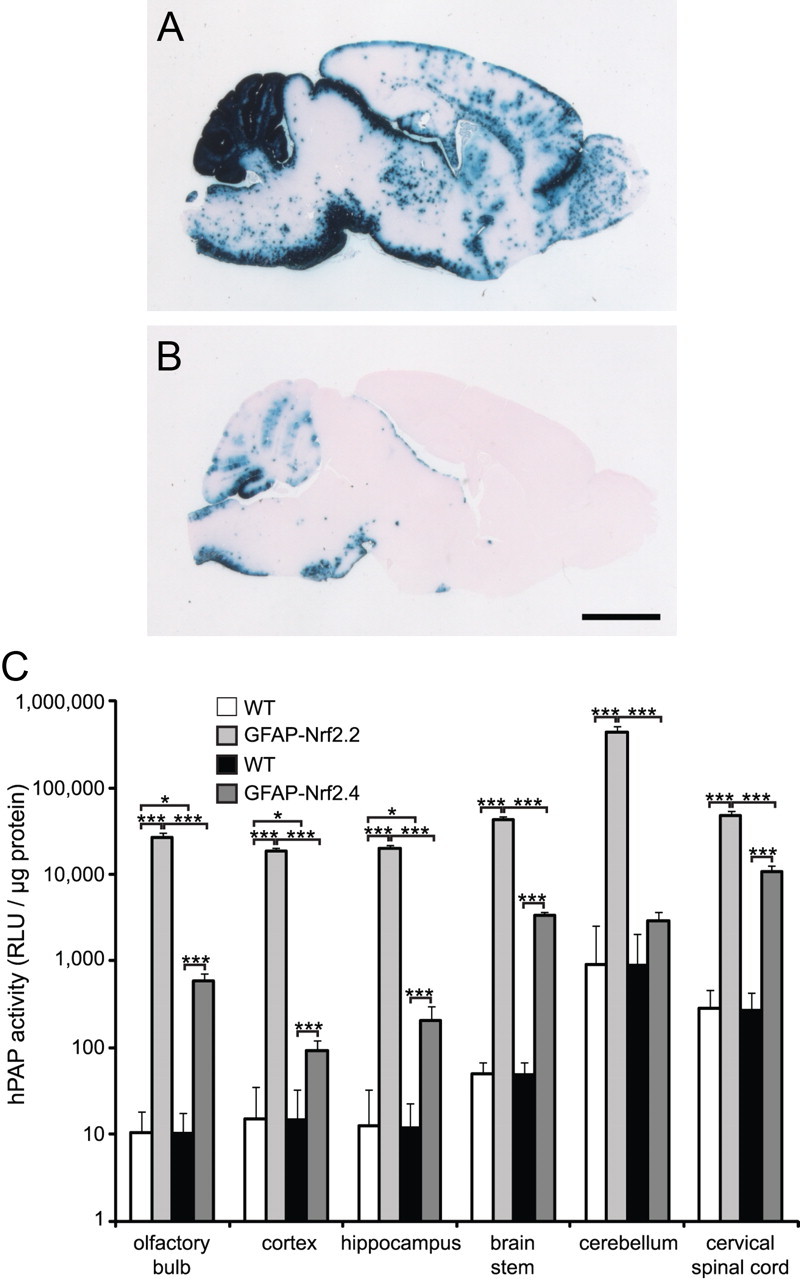
A lower expressing line of GFAP-Nrf2 mice is not as effective at reducing GFAP. An alkaline phosphatase reporter (hPAP) under control of the ARE shows Nrf2/ARE activity patterns at 12 weeks of age. A, B, Sagittal brain sections were stained for hPAP activity. GFAP-Nrf2 mice (GFAP-Nrf2.2, line Tg173.2) have hPAP staining throughout the brain (A), but hPAP staining in a second line, GFAP-Nrf2.4 (line Tg173.4), is mostly confined to cerebellum, brainstem, and spinal cord (B). C, Quantification of hPAP levels in brain regions (on a log scale) corresponds to hPAP staining and shows higher hPAP activity in GFAP-Nrf2.2 compared with GFAP-Nrf2.4 (n = 4–5 male mice per genotype). The white bars are WT littermates of GFAP-Nrf2.2, and the black bars are WT littermates of GFAP-Nrf2.4. Scale bar: A, B, 2 mm. RLU, Relative light units. Error bars are the SD. *p < 0.05, **p < 0.01, ***p < 0.001.
Glutathione levels are not decreased in R236H/+ mice
Previous work has implicated increased oxidative stress and depleted glutathione as important factors in progression of neurodegenerative diseases. However, in R236H/+ mice, we did not observe a decrease in glutathione (R236H/+ vs WT; Fig. 6A). Even in brain regions that are most severely affected, such as olfactory bulb, total glutathione levels [reduced glutathione (GSH) plus oxidized glutathione (GSSG)] did not decrease and in fact increased in R236H/+ compared with WT (Fig. 6B). To obtain a measure of oxidative stress, we calculated the ratio of reduced (GSH) to oxidized (GSSG) glutathione. GSH/GSSG increased in R236H/+ compared with WT at the whole-brain level (42 ± 3 vs 36 ± 4; p < 0.05), and GSH/GSSG did not change in the olfactory bulb (31 ± 8 vs 25 ± 5), indicating a decrease in oxidative stress. We did not detect differences in glutathione measurements between male and female mice, so male and female data were combined. These data suggest that, unlike some other neurodegenerative disease models, Alexander disease mice do not exhibit decreased glutathione levels, perhaps due to the effective induction of Nrf2 and its subsequent activation of the antioxidant cascade.
Figure 6.

Effects of Nrf2 overexpression on glutathione levels. R236H/+ mice either have no change (whole brain, A) or an increase (olfactory bulb, B) in total glutathione levels [reduced (GSH) plus oxidized (GSSG)] as measured by HPLC. Nrf2 overexpression increases total glutathione in WT and R236H/+ whole brain (A), but Nrf2 does not increase total glutathione levels in WT or R236H/+ olfactory bulb (B), the region in which Nrf2 most effectively reduces GFAP and Rosenthal fibers. n = 4–6 male and 4–6 female mice per genotype for whole brain (A) and n = 3–6 male and 4–7 female mice per genotype for olfactory bulb (B). Error bars are SD. *p < 0.05, ***p < 0.001.
Nrf2 overexpression increases glutathione in whole brain but not olfactory bulb
Nrf2 regulates several genes involved in the synthesis and homeostasis of glutathione, and so not surprisingly, Nrf2 overexpression increased total glutathione at the whole-brain level in WT and R236H/+ mice (GFAP-Nrf2 vs WT and R236H/+;GFAP-Nrf2 vs R236H/+; Fig. 6A). However, Nrf2 overexpression did not increase total glutathione in olfactory bulb (R236H/+;GFAP-Nrf2 vs R236H/+; Fig. 6B), the region where Nrf2 has its most dramatic effects for decreasing GFAP and Rosenthal fibers. Nrf2 overexpression also did not alter the GSH/GSSG ratio in either whole brain or olfactory bulb (data not shown). These data suggest that increased glutathione levels are not required for reduction in GFAP and Rosenthal fibers, although we cannot exclude the possibility that measurements of glutathione in tissue lysates may mask changes occurring at the level of individual cell types.
GCLM−/− mice have decreased glutathione, but this does not worsen the phenotype in R236H/+ mice
Although increased glutathione levels were not necessary for the Nrf2-mediated decrease in Alexander disease-associated phenotypes, we wanted to test whether glutathione levels are a modifying factor of disease severity using genetic depletion. To decrease glutathione levels, we crossed R236H/+ mice with GCLM−/− mice. Total glutathione levels were 71% lower in GCLM−/− brains compared with WT and also 71% lower in R236H/+;GCLM−/− compared with R236H/+ (Fig. 7A). No differences in GSH/GSSG were observed between the four genotypes (WT, 22 ± 3; R236H/+, 24 ± 2; GCLM−/−, 24 ± 3; R236H/+;GCLM−/−, 25 ± 2). The deletion of GCLM did not have any effect on GFAP levels in WT or R236H/+ mice at the whole-brain level (WT vs GCLM−/− and R236H/+ vs R236H/+;GCLM−/−; Fig. 7B). The deletion of GCLM also did not worsen the low body weight of R236H/+ mice (Fig. 7C) or affect survival up to 1 year (n = 3 R236H/+;GCLM−/− mice). R236H/+, GCLM−/−, and R236H/+;GCLM−/− mice all weighed less than WT littermates at all time points (5–12 weeks of age), but R236H/+;GCLM−/− mice did not weigh significantly less than R236H/+ mice (Fig. 7C). These data suggest that depleted glutathione is not a major factor in the pathogenesis of Alexander disease.
Figure 7.

Deletion of GCLM decreases glutathione levels but does not exacerbate the disease in R236H/+ mice. A, Deletion of GCLM leads to a 71% decrease in total glutathione levels in WT and R236H/+ brains (n = 4 male and 4 female mice per genotype). B, Despite low levels of glutathione, R236H/+;GCLM−/− mice do not have increased GFAP protein levels compared with R236H/+, as measured by ELISA (n = 4 male and 3–5 female mice per genotype). C, Consistent with unchanged GFAP levels, GCLM−/− has no effect on body weights of male R236H/+ mice (n = 4–7 litters per genotype). Error bars are SD in A and B, and SE in C. *p < 0.05, **p < 0.01, ***p < 0.001. In C, the asterisk (*) is versus WT.
Discussion
Nrf2 regulates expression of many genes that function to alleviate oxidative stress. Astrocyte-specific overexpression of Nrf2 lessens pathology in models of Huntington's disease, ALS, and Parkinson's disease (Calkins et al., 2005, 2010b; Jakel et al., 2007; Vargas et al., 2008; Chen et al., 2009). Loss of Nrf2 exacerbates disease and injury and increases inflammation (Calkins et al., 2005; Shih et al., 2005; Kraft et al., 2006). These beneficial effects of Nrf2 are likely due to its ability to increase glutathione levels and relieve oxidative stress. Here, we show that astrocyte-specific overexpression of Nrf2 is beneficial in a mouse model of Alexander disease, but this is probably not due to effects on glutathione.
Mice overexpressing human wild-type GFAP, a severe model of Alexander disease, have increased ARE activity, increased NQO1 activity, and increased transcript levels of several genes regulated by Nrf2 (Hagemann et al., 2005). R236H/+ mice also have an elevated antioxidant response, with ARE activity being most prominent in regions with Rosenthal fibers (Hagemann et al., 2006). Here, we show the antioxidant response in R236H/+ mice is increased as measured by Nrf2 and Nqo1 transcripts and ARE-hPAP activity and extend the previous results by quantifying Nrf2 activity in multiple brain regions.
Nrf2 overexpression consistently decreased Gfap transcripts, GFAP protein, and Rosenthal fibers in R236H/+ mice, especially so in olfactory bulb. Why the effects in olfactory bulb are so robust is not clear, but may relate to heterogeneity among brain regions in terms of astrocyte numbers and morphology as well as properties such as gene expression, composition of neurotransmitter and transporters, and response to injury (Emsley and Macklis, 2006) (for review, see Zhang and Barres, 2010). The effects of Nrf2 overexpression on GFAP levels in Gfap+/+ mice also varied by brain region—GFAP protein decreased in olfactory bulb, brainstem, and cervical spinal cord, increased in hippocampus, and did not change in cerebral cortex. One possible explanation for these region-specific effects is variable activity of the 2.2 kb GFAP promoter used to direct expression of Nrf2, and indeed Nrf2 transcripts were highest in the olfactory bulb. However, other downstream indicators of Nrf2 activity (hPAP activity and Nqo1 transcripts) were not correspondingly increased in olfactory bulb, and promoter activity does not account for the GFAP increase found in hippocampus. Nrf2 is known to heterodimerize with other binding partners, such as the small Maf proteins (Itoh et al., 1997; Motohashi et al., 2002) to initiate transcription of its target genes, and perhaps expression of these transcription cofactors varies by brain region.
Regional variability of Nrf2 effects on GFAP may also explain why GFAP was not previously identified as being regulated by Nrf2. One set of studies used astrocyte cultures derived from cerebral cortex (Lee et al., 2003; Shih et al., 2003; Kraft et al., 2004), and our results show that Nrf2 overexpression has no effect on GFAP in cortex of mice that are wild type at the Gfap locus. Similarly, we detected no decrease in Gfap mRNA in GFAP-Nrf2 cervical spinal cord, confirming results from lumbar spinal cord of the lower-expressing GFAP-Nrf2.4 mice (Vargas et al., 2008). While our results do show that Nrf2 affects GFAP expression in several regions of the CNS, possibly due to effects on transcription, transcript stability, and/or protein turnover, they do not address whether this is a direct or indirect effect.
Depletion of glutathione is thought to contribute to pathology in other neurodegenerative diseases, such as Parkinson's disease (for review, see Martin and Teismann, 2009), but surprisingly we found no evidence that lower glutathione levels contribute to the pathogenesis of Alexander disease. Glutathione levels are unchanged at the whole-brain level in R236H/+ mice and are even increased in olfactory bulb where there is considerable pathology. In addition, the ratio of reduced to oxidized glutathione (GSH/GSSG), for which lower values are often interpreted as indicators of oxidative stress, was instead increased at the whole-brain level of R236H/+ mice, and unchanged in olfactory bulb. These results suggest either that the brains of Alexander disease mice do not have oxidative stress or that the endogenous Nrf2 response is able to keep glutathione homeostasis intact. Whether glutathione homeostasis is maintained or enhanced specifically in astrocytes cannot be determined from our data. However, global deletion of the Gclm gene, which is thought to cause depletion of glutathione in all cell types, did not worsen the phenotype of the R236H/+ mice. Together, these data support the notion that glutathione depletion is not a significant factor in the pathogenesis of Alexander disease.
Whether the beneficial effects of Nrf2 overexpression are mediated by increased glutathione is a more difficult question. Nrf2 does regulate the expression of several genes involved in glutathione synthesis and homeostasis, and the protective effects of Nrf2 in other neurodegenerative disease and injury models corresponded with increases in glutathione (Kraft et al., 2004; Vargas et al., 2008; Calkins et al., 2010b). However, in the present study, GFAP-Nrf2 mice showed no change in total glutathione in olfactory bulb, where Nrf2 overexpression had its most dramatic effects for decreasing GFAP and Rosenthal fibers. Since primary astrocyte cultures prepared from spinal cord of GFAP-Nrf2.4 mice do exhibit increases in both intracellular glutathione and glutathione secretion (Vargas et al., 2008), it remains a formal possibility that such changes occur in olfactory bulb but are offset by changes in other cell types. An alternative possibility is that the protective effect of Nrf2 on GFAP levels may be mediated through its effects on other aspects of the antioxidant response, such as iron regulation or other detoxifying enzymes (e.g., superoxide dismutase or catalase).
R236H/+ mice are theoretically an ideal model for Alexander disease since they are a knock-in of a point mutation commonly found in severe early-onset cases of human Alexander disease, and they replicate several features of the disease: elevated GFAP, gliosis, Rosenthal fibers, and both stress and immune responses (Hagemann et al., 2006). However, the disease phenotype in these mice is not as severe as early-onset cases in humans, in that they have neither a shortened life span nor an apparent defect in myelin (Hagemann et al., 2006). Behavioral studies currently underway show preliminary indications of deficits in hippocampal-dependent spatial learning (T. L. Hagemann, personal communication), and it will be interesting to examine the effects of Nrf2 overexpression on these phenotypes as well.
In conclusion, we show that astrocyte-specific overexpression of Nrf2 is sufficient to decrease GFAP transcripts, protein, and Rosenthal fibers in a mouse model of Alexander disease. Drugs to increase Nrf2 expression or activity might prove valuable for treating Alexander disease and possibly other diseases in which a decrease in gliosis may be beneficial. Since the Nrf2 transgene begins to be expressed during development, we can only conclude that it prevents an increase in GFAP and Rosenthal fibers, and future studies can test whether Nrf2 is sufficient to reverse high levels of GFAP and Rosenthal fibers. Nrf2 activity-inducing drugs, such as sulforaphane, cystamine, carnosic acid, and curcumin, have been used to treat mice in models of 3-NP/Huntington's disease, ischemia, and Alzheimer's disease with promising results (Lim et al., 2001; Satoh et al., 2008; Calkins et al., 2010a), but whether these drugs can cross the blood–brain barrier in Alexander disease will need to be determined. Given the utility of increased Nrf2 expression in the R236H/+ mice, further studies will need to be directed at finding drugs that can control Nrf2 activity in the brain.
Footnotes
This work was supported by NIH Grants NS06120 (A.M.), NS42803 (A.M.), ES10042 (J.A.J.), and P30 HD03352 (Waisman Center), and the Juanma Fund (A.M.). We thank Elizabeth Paffenroth, Sung Ryul Kim, Charanjeet Kaur, and Denice Springman for technical assistance. We also thank Mel Feany and Michael Brenner for critical reading of this manuscript.
The authors declare no competing financial interests.
References
- Alexander WS. Progressive fibrinoid degeneration of fibrillary astrocytes associated with mental retardation in a hydrocephalic infant. Brain. 1949;72:373–381. doi: 10.1093/brain/72.3.373. 3 pl. [DOI] [PubMed] [Google Scholar]
- Brenner M, Johnson AB, Boespflug-Tanguy O, Rodriguez D, Goldman JE, Messing A. Mutations in GFAP, encoding glial fibrillary acidic protein, are associated with Alexander disease. Nat Genet. 2001;27:117–120. doi: 10.1038/83679. [DOI] [PubMed] [Google Scholar]
- Calkins MJ, Jakel RJ, Johnson DA, Chan K, Kan YW, Johnson JA. Protection from mitochondrial complex II inhibition in vitro and in vivo by Nrf2-mediated transcription. Proc Natl Acad Sci U S A. 2005;102:244–249. doi: 10.1073/pnas.0408487101. [DOI] [PMC free article] [PubMed] [Google Scholar]
- Calkins MJ, Johnson DA, Townsend JA, Vargas MR, Dowell JA, Williamson TP, Kraft AD, Lee JM, Li J, Johnson JA. The Nrf2/ARE pathway as a potential therapeutic target in neurodegenerative disease. Antioxid Redox Signal. 2009;11:497–508. doi: 10.1089/ars.2008.2242. [DOI] [PMC free article] [PubMed] [Google Scholar]
- Calkins MJ, Townsend JA, Johnson DA, Johnson JA. Cystamine protects from 3-nitropropionic acid lesioning via induction of nf-e2 related factor 2 mediated transcription. Exp Neurol. 2010a;224:307–317. doi: 10.1016/j.expneurol.2010.04.008. [DOI] [PMC free article] [PubMed] [Google Scholar]
- Calkins MJ, Vargas MR, Johnson DA, Johnson JA. Astrocyte-specific overexpression of Nrf2 protects striatal neurons from mitochondrial complex II inhibition. Toxicol Sci. 2010b;115:557–568. doi: 10.1093/toxsci/kfq072. [DOI] [PMC free article] [PubMed] [Google Scholar]
- Chen PC, Vargas MR, Pani AK, Smeyne RJ, Johnson DA, Kan YW, Johnson JA. Nrf2-mediated neuroprotection in the MPTP mouse model of Parkinson's disease: critical role for the astrocyte. Proc Natl Acad Sci U S A. 2009;106:2933–2938. doi: 10.1073/pnas.0813361106. [DOI] [PMC free article] [PubMed] [Google Scholar]
- Emsley JG, Macklis JD. Astroglial heterogeneity closely reflects the neuronal-defined anatomy of the adult murine CNS. Neuron Glia Biol. 2006;2:175–186. doi: 10.1017/S1740925X06000202. [DOI] [PMC free article] [PubMed] [Google Scholar]
- Fariss MW, Reed DJ. High-performance liquid chromatography of thiols and disulfides: dinitrophenol derivatives. Methods Enzymol. 1987;143:101–109. doi: 10.1016/0076-6879(87)43018-8. [DOI] [PubMed] [Google Scholar]
- Goldman JE, Corbin E. Isolation of a major protein component of Rosenthal fibers. Am J Pathol. 1988;130:569–578. [PMC free article] [PubMed] [Google Scholar]
- Hagemann TL, Gaeta SA, Smith MA, Johnson DA, Johnson JA, Messing A. Gene expression analysis in mice with elevated glial fibrillary acidic protein and Rosenthal fibers reveals a stress response followed by glial activation and neuronal dysfunction. Hum Mol Genet. 2005;14:2443–2458. doi: 10.1093/hmg/ddi248. [DOI] [PubMed] [Google Scholar]
- Hagemann TL, Connor JX, Messing A. Alexander disease-associated glial fibrillary acidic protein mutations in mice induce Rosenthal fiber formation and a white matter stress response. J Neurosci. 2006;26:11162–11173. doi: 10.1523/JNEUROSCI.3260-06.2006. [DOI] [PMC free article] [PubMed] [Google Scholar]
- Hagemann TL, Boelens WC, Wawrousek EF, Messing A. Suppression of GFAP toxicity by alphaB-crystallin in mouse models of Alexander disease. Hum Mol Genet. 2009;18:1190–1199. doi: 10.1093/hmg/ddp013. [DOI] [PMC free article] [PubMed] [Google Scholar]
- Itoh K, Chiba T, Takahashi S, Ishii T, Igarashi K, Katoh Y, Oyake T, Hayashi N, Satoh K, Hatayama I, Yamamoto M, Nabeshima Y. An Nrf2/small Maf heterodimer mediates the induction of phase II detoxifying enzyme genes through antioxidant response elements. Biochem Biophys Res Commun. 1997;236:313–322. doi: 10.1006/bbrc.1997.6943. [DOI] [PubMed] [Google Scholar]
- Iwaki T, Kume-Iwaki A, Liem RK, Goldman JE. Alpha B-crystallin is expressed in non-lenticular tissues and accumulates in Alexander's disease brain. Cell. 1989;57:71–78. doi: 10.1016/0092-8674(89)90173-6. [DOI] [PubMed] [Google Scholar]
- Iwaki T, Iwaki A, Tateishi J, Sakaki Y, Goldman JE. Alpha B-crystallin and 27-kd heat shock protein are regulated by stress conditions in the central nervous system and accumulate in Rosenthal fibers. Am J Pathol. 1993;143:487–495. [PMC free article] [PubMed] [Google Scholar]
- Jakel RJ, Townsend JA, Kraft AD, Johnson JA. Nrf2-mediated protection against 6-hydroxydopamine. Brain Res. 2007;1144:192–201. doi: 10.1016/j.brainres.2007.01.131. [DOI] [PMC free article] [PubMed] [Google Scholar]
- Johnson DA, Andrews GK, Xu W, Johnson JA. Activation of the antioxidant response element in primary cortical neuronal cultures derived from transgenic reporter mice. J Neurochem. 2002;81:1233–1241. doi: 10.1046/j.1471-4159.2002.00913.x. [DOI] [PubMed] [Google Scholar]
- Kraft AD, Johnson DA, Johnson JA. Nuclear factor E2-related factor 2-dependent antioxidant response element activation by tert-butylhydroquinone and sulforaphane occurring preferentially in astrocytes conditions neurons against oxidative insult. J Neurosci. 2004;24:1101–1112. doi: 10.1523/JNEUROSCI.3817-03.2004. [DOI] [PMC free article] [PubMed] [Google Scholar]
- Kraft AD, Lee JM, Johnson DA, Kan YW, Johnson JA. Neuronal sensitivity to kainic acid is dependent on the Nrf2-mediated actions of the antioxidant response element. J Neurochem. 2006;98:1852–1865. doi: 10.1111/j.1471-4159.2006.04019.x. [DOI] [PubMed] [Google Scholar]
- Lee JM, Calkins MJ, Chan K, Kan YW, Johnson JA. Identification of the NF-E2-related factor-2-dependent genes conferring protection against oxidative stress in primary cortical astrocytes using oligonucleotide microarray analysis. J Biol Chem. 2003;278:12029–12038. doi: 10.1074/jbc.M211558200. [DOI] [PubMed] [Google Scholar]
- Lim GP, Chu T, Yang F, Beech W, Frautschy SA, Cole GM. The curry spice curcumin reduces oxidative damage and amyloid pathology in an Alzheimer transgenic mouse. J Neurosci. 2001;21:8370–8377. doi: 10.1523/JNEUROSCI.21-21-08370.2001. [DOI] [PMC free article] [PubMed] [Google Scholar]
- Martin HL, Teismann P. Glutathione—a review on its role and significance in Parkinson's disease. FASEB J. 2009;23:3263–3272. doi: 10.1096/fj.08-125443. [DOI] [PubMed] [Google Scholar]
- Motohashi H, O'Connor T, Katsuoka F, Engel JD, Yamamoto M. Integration and diversity of the regulatory network composed of Maf and CNC families of transcription factors. Gene. 2002;294:1–12. doi: 10.1016/s0378-1119(02)00788-6. [DOI] [PubMed] [Google Scholar]
- Paxinos G, Franklin KBJ. The mouse brain in stereotaxic coordinates. Ed 2. San Diego: Academic; 2001. [Google Scholar]
- Prust M, Wang J, Morizono H, Messing A, Brenner M, Gordon E, Hartka T, Sokohl A, Schiffmann R, Gordish-Dressman H, Albin R, Amartino H, Brockman K, Dinopoulos A, Dotti MT, Fain D, Fernandez R, Ferreira J, Fleming J, Gill D, et al. GFAP mutations, age at onset, and clinical subtypes in Alexander disease. Neurology. 2011;77:1287–1294. doi: 10.1212/WNL.0b013e3182309f72. [DOI] [PMC free article] [PubMed] [Google Scholar]
- Satoh T, Kosaka K, Itoh K, Kobayashi A, Yamamoto M, Shimojo Y, Kitajima C, Cui J, Kamins J, Okamoto S, Izumi M, Shirasawa T, Lipton SA. Carnosic acid, a catechol-type electrophilic compound, protects neurons both in vitro and in vivo through activation of the Keap1/Nrf2 pathway via S-alkylation of targeted cysteines on Keap1. J Neurochem. 2008;104:1116–1131. doi: 10.1111/j.1471-4159.2007.05039.x. [DOI] [PMC free article] [PubMed] [Google Scholar]
- Shih AY, Johnson DA, Wong G, Kraft AD, Jiang L, Erb H, Johnson JA, Murphy TH. Coordinate regulation of glutathione biosynthesis and release by Nrf2-expressing glia potently protects neurons from oxidative stress. J Neurosci. 2003;23:3394–3406. doi: 10.1523/JNEUROSCI.23-08-03394.2003. [DOI] [PMC free article] [PubMed] [Google Scholar]
- Shih AY, Imbeault S, Barakauskas V, Erb H, Jiang L, Li P, Murphy TH. Induction of the Nrf2-driven antioxidant response confers neuroprotection during mitochondrial stress in vivo. J Biol Chem. 2005;280:22925–22936. doi: 10.1074/jbc.M414635200. [DOI] [PubMed] [Google Scholar]
- Tang G, Xu Z, Goldman JE. Synergistic effects of the SAPK/JNK and the proteasome pathway on glial fibrillary acidic protein (GFAP) accumulation in Alexander disease. J Biol Chem. 2006;281:38634–38643. doi: 10.1074/jbc.M604942200. [DOI] [PubMed] [Google Scholar]
- Tian R, Gregor M, Wiche G, Goldman JE. Plectin regulates the organization of glial fibrillary acidic protein in Alexander disease. Am J Pathol. 2006;168:888–897. doi: 10.2353/ajpath.2006.051028. [DOI] [PMC free article] [PubMed] [Google Scholar]
- Vargas MR, Johnson DA, Sirkis DW, Messing A, Johnson JA. Nrf2 activation in astrocytes protects against neurodegeneration in mouse models of familial amyotrophic lateral sclerosis. J Neurosci. 2008;28:13574–13581. doi: 10.1523/JNEUROSCI.4099-08.2008. [DOI] [PMC free article] [PubMed] [Google Scholar]
- Vargas MR, Johnson DA, Johnson JA. Decreased glutathione accelerates neurological deficit and mitochondrial pathology in familial ALS-linked hSOD1(G93A) mice model. Neurobiol Dis. 2011;43:543–551. doi: 10.1016/j.nbd.2011.04.025. [DOI] [PMC free article] [PubMed] [Google Scholar]
- Yang Y, Dieter MZ, Chen Y, Shertzer HG, Nebert DW, Dalton TP. Initial characterization of the glutamate-cysteine ligase modifier subunit Gclm−/− knockout mouse. Novel model system for a severely compromised oxidative stress response. J Biol Chem. 2002;277:49446–49452. doi: 10.1074/jbc.M209372200. [DOI] [PubMed] [Google Scholar]
- Zhang Y, Barres BA. Astrocyte heterogeneity: an underappreciated topic in neurobiology. Curr Opin Neurobiol. 2010;20:588–594. doi: 10.1016/j.conb.2010.06.005. [DOI] [PubMed] [Google Scholar]