

Abstract
Conditional deletion of Pkd1 in osteoblasts using either Osteocalcin(Oc)-Cre or Dmp1-Cre results in defective osteoblast-mediated postnatal bone formation and osteopenia. Pkd1 is also expressed in undifferentiated mesenchyme that gives rise to the osteoblast lineage. To examine the effects of Pkd1 on prenatal osteoblast development, we crossed Pkd1 flox/flox and Col1a1(3.6)-Cre mice, which has been used to achieve selective inactivation of Pkd1 earlier in the osteoblast lineage. Control Pkd1 flox/flox and Pkd1 flox/+, heterozygous Col1a1(3.6)-Cre;Pkd1 flox/+ and Pkd1 flox/null, and homozygous Col1a1(3.6)-Cre;Pkd1 flox/flox and Col1a1(3.6)-Cre;Pkd1 flox/null mice were analyzed at ages ranging from E14.5 to 8-weeks-old. Newborn Col1a1(3.6)-Cre;Pkd1 flox/null mice exhibited defective skeletogenesis in association with a greater reduction in Pkd1 expression in bone. Conditional Col1a1(3.6)-Cre;Pkd1 flox/+ and Col1a1(3.6)-Cre;Pkd1 flox/flox mice displayed a gene dose-dependent decrease in bone formation and increase in marrow fat at 6 weeks of age. Bone marrow stromal cell and primary osteoblast cultures from homozygous Col1a1(3.6)-Cre;Pkd1 flox/flox mice showed increased proliferation, impaired osteoblast development and enhanced adipogenesis ex vivo. Unexpectedly, we found evidence for Col1a1(3.6)-Cre mediated deletion of Pkd1 in extraskeletal tissues in Col1a1(3.6)-Cre;Pkd1 flox/flox mice. Deletion of Pkd1 in mesenchymal precursors resulted in pancreatic and renal, but not hepatic, cyst formation. The non-lethality of Col1a1(3.6)-Cre;Pkd1 flox/flox mice establishes a new model to study abnormalities in bone development and cyst formation in pancreas and kidney caused by Pkd1 gene inactivation.
Introduction
Polycystin-1 (PC1), the PKD1 gene product, is a highly conserved, multi-domain membrane protein widely expressed in various cell types and tissues [1], [2]. The specific biological functions of PC1 (PKD1) in different tissues are currently being elucidated; best understood are the kidney functions. In renal epithelium, PKD1 forms a complex with the calcium channel, PKD2 that co-localizes to primary cilia and functions as a flow sensor regulating cell proliferation and polarity. Loss of PKD1 or PKD2 function in renal tubular epithelial cells causes Autosomal Dominant Polycystic Kidney Disease (ADPKD) [3], [4] that is the result of abnormal cell proliferation and cell polarity and leads to cystic kidney disease. PKD1 mutations also lead to cystic disease of liver and pancreas in some patients with ADPKD, also because of abnormal proliferation of ductal epithelial cells in these tissues [5], [6], [7]. PKD1 may also have a role in the development and function in endothelial- and mesenchymal-derived cells. PKD1 mutations lead to vascular (intracranial and aortic aneurysms) [8], [9], [10], [11] and lung (bronchiectasis) abnormalities [12]. PKD1 and PKD2 are required for placental development [13]. Pkd1 mutations in mouse models also cause abnormalities of the skeleton [14], [15], [16], [17], [18] and human subjects with polycystic kidney disease appear to have earlier elevation of the bone-derived hormone FGF23 [19].
It has been difficult to determine the specific extra-renal functions of Pkd1/PKD1using mutations of Pkd1/PKD1 in mice and humans. Global ablation of Pkd1 in mice leads to a complex, embryonically lethal, phenotype [7]. Multiple abnormalities, including renal and pancreatic cysts and pulmonary hyperplasia, are observed in Pkd1 −/− mice when they survive to embryonic day 15.5 post coitum (E15.5). In global knockout mice it is difficult to differentiate between indirect extra-renal abnormalities due to the effects of the complex metabolic alterations caused by renal cystic disease from direct effects caused by loss of Pkd1 functions in affected tissues. In addition, in humans, ADPKD is a heterozygous state, whereby mutations leading to loss of one PKD1 or PKD2 allele is combined with somatic mutations in the kidney (i.e., a second hit) to cause renal cystic disease [20], [21], [22], [23], [24]. The resulting residual function of the non-mutated PKD1 or PKD2 allele in extra-renal tissues may also mask discovery of PKD1 or PKD2 functions in non-renal tissues.
The Pkd1 flox/flox mouse model has been used to define the tissue selective function of Pkd1 in vivo [25]. A low frequency of renal Pkd1 gene inactivation and only a few renal cysts and more frequent hepatic cysts is reported from the conditional deletion of Pkd1 in MMTV-Cre mice [25], whereas the broadly expressed tamoxifen-Cre inducible inactivation of the Pkd1 gene in mice resulted in massive cystic transformation of renal tissue [26]. The selective deletion of Pkd1 in kidney by using Ksp-Cre, or more broadly Nestin-Cre, also leads to the formation of polycystic kidneys resembling human ADPKD [27], [28].
In addition, use of Pkd1 flox/flox mice and bone-specific Cre mice has defined previously unrecognized functions of polycystin-1 in bone. In this regard, the selective deletion of Pkd1 in osteoblasts by using Osteocalcin(Oc)-Cre and in osteocytes by using Dmp1-Cre results in osteopenia in adult mice because of defects in osteoblast-mediated bone formation [17], [18]. At present, however, it is unclear whether the functions of Pkd1 are limited to mature osteoblasts and osteocytes or involve earlier stages in osteoblast development.
To explore the effects of Pkd1 on early pre-osteoblast stage and prenatal bone development, we used the Col1a1(3.6) promoter to drive Cre-recombinase expression (Col1a1(3.6)-Cre) in mesenchymal precursors. Col1a1(3.6) promoter driven Cre expression begins at E10 and peaks between E12.5 and E14.5 in developing skeletal elements [29], [30]. Col1a1(3.6)-Cre is thought to be specific for the osteoblast lineage and it has been extensively used to conditionally delete genes early in osteoblastic development and to study bone-specific function of many genes [29], [30], [31], [32].
We found that conditional deletion of Pkd1 from osteoblasts precursors within the mesenchymal lineage resulted in defective bone formation that was associated with abnormal osteoblastic development and enhanced adipogenesis. Unexpectedly, we found that Col1a1(3.6)-Cre was not bone specific and resulted in deletion of Pkd1 in multiple tissues, leading to cyst formation in the kidney and pancreas, but not the liver of adult mice.
Results
Col1a1 (3.6)-Cre-mediated conditional deletion of Pkd1 in different tissues
The four genotypes from the chosen breeding strategy (Col1a1(3.6)-Cre;Pkd1 flox/flox, Col1a1(3.6)-Cre; Pkd1 flox/+, Pkd1 flox/flox, and Pkd1 flox/+) were born at the expected Mendelian frequency. We investigated Col1a1(3.6)-Cre; Pkd1 flox/flox (Pkd1Col1a1(3.6)- cKO), heterozygous Col1a1(3.6)-Cre;Pkd1 flox/+, and Pkd1 flox/flox mice. Pkd1 flox/flox was used as the control group. Col1a1(3.6)-Cre; Pkd1 flox/+ mice exhibited normal survival indistinguishable from control mice (Pkd1 flox/flox), whereas Pkd1Col1a1(3.6) -cKO mice displayed a 50% mortality rate in association with development of multiple cysts in the kidney and pancreas from newborn to 6-week-old mice (Fig. 1A). We observed no differences in body weight between heterozygous Col1a1(3.6)-Cre; Pkd1 flox/+ and control Pkd1 flox/flox littermates; however , Pkd1Col1a1(3.6)- cKO mice were smaller and had a significantly lower body weight compared with Col1a1(3.6)-Cre;Pkd1 flox/+ and Pkd1 flox/flox littermates at 6 weeks-of-age (Fig. 1B). Using an alternative breeding strategy with Pkd flox/null mice, we also generated Col1a1(3.6)-Cre;Pkd1 flox/null mice, which had greater perinatal mortality that prevented collection of adult animals for analysis (data not shown). Therefore, the analysis of the skeletal phenotype of Col1a1(3.6)-Cre;Pkd1 flox/null mice is limited to newborn mice.
Figure 1. Col1a1(3.6)-Cre-mediated conditional deletion of Pkd1 from the floxed Pkd1 allele (Pkd1 flox) in different tissues.

(A) Kaplan–Meier survival curve. Heterozygous Col1a1(3.6)-Cre; Pkd1 flox/+ had normal survival identical to control (Pkd1 flox/flox ) mice, homozygous Col1a1(3.6)-Cre; Pkd1 flox/flox mice began to die 1 week after birth and only half of these mice survived beyond 6 weeks. (B) Body weight of Col1a1(3.6)-Cre;Pkd1 flox/+ and control (Pkd1 flox/flox) mice were not different, but the body weight of both male and female Col1a1(3.6)-Cre;Pkd1 flox/flox mice was reduced by ∼30% and ∼36% compared with the other two genotypes. (C) Genotyping PCR analysis of different tissues harvested from 6-week-old homozygous Col1a1(3.6)-Cre; Pkd1 flox/flox mice showed that both Pkd1 flox and Pkd1 Δflox alleles existed in all tested tissues including bone and nonskeletal tissues, indicating that Col1a1(3.6)-Cre promoter is not specific for bone. (D–E) Real-time RT-PCR analysis of total Pkd1 transcripts in calvaria from both Col1a1(3.6)-Cre;Pkd1 flox/flox and Col1a1(3.6)-Cre;Pkd1 flox/null models, and in kidney and liver from Col1a1(3.6)-Cre;Pkd1 flox/flox model at 6 weeks of age. Total Pkd1 transcripts were expressed as the fold changes relative to the housekeeping gene β-actin subsequently normalized to control Pkd1 flox/flox or Pkd1 flox/+ mice. Data represent the mean ± SD from five or six individual mice. Values sharing the same superscript are not significantly different at P<0.05. *Significant difference from control (Pkd1 flox/flox); #significant difference from heterozygous Col1a1(3.6)-Cre;Pkd1 flox/+ mice at P<0.05, respectively.
Col1a1(3.6)-Cre-mediated excision occurs in the developing mesenchymal tissues between E12.5 and E14.5 [29], [30] and would be expected to carry forward into tissues developed from mesenchymal precursors. To determine the tissue distribution of Col1a1(3.6)-Cre-mediated deletion of Pkd1 in adult mice, we performed PCR analysis in different tissues by using a combination of primers that specifically detect floxed Pkd1 alleles (Pkd1 flox) and the excised floxed Pkd1 alleles (Pkd1 Δflox), as well as wild type alleles (Pkd1 +) in Pkd1Col1a1(3.6)- cKO (Fig. 1C). We found that Col1a1(3.6)-Cre-mediated floxed recombination occurred in both skeletal and nonskeletal tissues including pancreas, liver, and kidney (Fig. 1C), consistent with prior reports [31] that Col1a1(3.6)-Cre mRNA was highly expressed in calvarias, long bone, and tendon, but was also detected in brain, kidney, liver and lung [31].
To quantify the excised efficiency of floxed Pkd1 by Col1a1(3.6)-Cre-recombinase, we examined the percentage of Pkd1 transcripts in exons 2–4 in calvarias, kidney, and liver from 6-week-old mice by real-time RT-PCR. We found that Col1a1(3.6)-Cre;Pkd1 flox/+ mice exhibited approximately 18∼41% excision of the floxed exons 2–4 from total Pkd1 transcripts, whereas Pkd1Col1a1(3.6)- cKO mice resulted in a net reduction of Pkd1 expression by 45∼60% in calvarias, kidney, and liver (Fig. 1D, 1E, and 1F). In addition, there is a gene-dose-dependent reduction in Pkd1 transcripts in calvaria (Fig. 1D) that correlated with a more severe bone phenotype in Col1a1(3.6)-Cre;Pkd1 flox/null newborn mice compared to Col1a1(3.6)-Cre;Pkd1 flox/flox mice.
A gene dose-dependent effect of Col1a1 (3.6)-Cre-mediated conditional deletion of Pkd1 in newborn and postnatal bone formation
Indeed, we failed to observe abnormalities of skeletal development in homozygous Pkd1Col1a1(3.6)- cKO newborn mice (Fig. 2A, 2C, 2E and 2G). In contrast, bone structural abnormalities were observed in homozygous Col1a1(3.6)-Cre;Pkd1 flox/null newborn mice, including delayed bone mineralization in calvarial and vertebral bone tissues (Fig. 2B), a short and less mineralized femur (Fig. 2D), and a significant reduction in both trabecular bone volume (Fig. 2F) and cortical bone thickness (Fig. 2H). Because the Cre;Pkd1 flox/null strategy leads to greater Cre-mediated reduction in Pkd1 conditional deletion compared to Cre;Pkd1 flox/flox approach [33], the more severe phenotype that we observed is likely the result of greater reductions in Pkd1 gene dose during embryogenesis.
Figure 2. Col1a1(3.6)-Cre-mediated deletion of Pkd1 results in osteopenia in Col1a1(3.6)-Cre;Pkd1 flox/null newborn mice.

The whole skeleton mineralization (A and B), full-length mineralized femurs (C and D), bone volume of metaphyseal region (E and F), and cortical thickness of cortical bone (G and H) of femurs from Col1a1(3.6)-Cre;Pkd1 flox/flox and Col1a(3.6)-Cre; Pkd1 flox/null newborn mice by μCT analysis. A Pkd1 gene dose effect was observed during skeletogenesis between Col1a1(3.6)-Cre;Pkd1 flox/flox and Col1a(3.6)-Cre; Pkd1 flox/null newborn mice. Data represent the mean ± SD from three to four individual samples. *Significant difference from control mice (Pkd1 flox/flox or Pkd1 flox/+) at P<0.05.
We also observed a Pkd1 gene dose dependent reduction in bone mineral density (BMD) in heterozygous Col1a1(3.6)-Cre; Pkd1 flox/+ and homozygous Pkd1Col1a1(3.6)- cKO mice. A significant reduction in BMD of 21∼22% was observed in both male and female heterozygous Col1a1(3.6)-Cre;Pkd1 flox/+ mice at 6 weeks of age compared with age-matched control mice (Pkd1 flox/flox) (Fig. 3A). Homozygous Pkd1Col1a1(3.6)- cKO mice had greater loss in BMD, with respective reductions in BMD of 35% and 36% reduction in male and female adult mice (Fig. 3A). μCT analysis revealed that the lower bone mass in male heterozygous Col1a1(3.6)-Cre; Pkd1 flox/+ mice was caused by reduced trabecular bone volume (BV/TV, 40%) and cortical bone thickness (Ct.Th, 15%) (Fig. 3B), and homozygous Col1a1(3.6)-Cre;Pkd1 flox/flox mice had greater loss in both trabecular (73%) and cortical bone (41%) than did heterozygous Col1a1(3.6)-Cre; Pkd1 flox/+ mice (Fig. 3B). These reductions in bone volume and cortical thickness were associated with a significant Pkd1 gene dose-dependent decrease in periosteal mineral apposition rate (MAR)(Fig. 3C). In this regard, periosteal MAR was reduced by 19% in heterozygous Col1a1(3.6)-Cre; Pkd1 flox/+ mice and 41% in homozygous Col1a1(3.6)-Cre; Pkd1 flox/flox mice compared with age-matched Pkd1 flox/flox controls (Fig. 3C). In addition, the femurs of homozygous Pkd1Col1a1(3.6)- cKO mice were 17% shorter in length, indicating a role of Pkd1 in growth plate of metaphyseal bone (Fig. 3D). Interestingly, the severity of BMD reductions in more limited number of Col1a1(3.6)-Cre;Pkd1 flox/null mice that were available for examination was similar to that of Pkd1Col1a1(3.6)- cKO mice (data not shown).
Figure 3. Col1a1(3.6)-Cre-mediated conditional deletion of Pkd1 leads to severe osteopenia in Col1a1(3.6)-Cre;Pkd1 flox/flox adult mice.

(A) Bone mineral density (BMD), (B) Bone structure of femurs, (C) Bone mineral apposition rate (MAR), and (D) Femur length at 6 weeks of age. There was a Pkd1 gene dose-dependent reduction in BMD in both male and female heterozygous Col1a1(3.6)-Cre; Pkd1 flox/+ and homozygous Col1a1(3.6)-Cre; Pkd1 flox/flox mice compared with age-matched control mice (Pkd1 flox/flox). µCT analysis revealed that the lower bone mass in male Col1a1(3.6)-Cre-mediated mice with conditional deletion of Pkd1 resulted from reductions in both trabecular BV/TV and cortical CtTh that were proportionate to the reduction of Pkd1 gene dose. These reductions in bone mass and structure were associated with a 19% and 41% reduction in mineral apposition rate (MAR) in male heterozygous Col1a1(3.6)-Cre; Pkd1 flox/+ and homozygous Col1a1(3.6)-Cre; Pkd1 flox/flox mice compared with age-matched control mice, respectively. In addition, the femurs of homozygous Col1a1(3.6)-Cre; Pkd1 flox/flox mice were 17% shorter in length, indicating a postnatal bone growth retardation. Data represent the mean ± S.D. from five to six individual mice. *Significant difference from control (Pkd1 flox/flox) and #significant difference from Col1a1(3.6)-Cre; Pkd1 flox/+ mice at P<0.05, respectively.
To investigate the effects of Pkd1 deficiency on gene expression profiles in bone, we examined by real-time RT-PCR the expression levels of a panel of osteoblast lineage-, osteoclast-, and adipocyte-related mRNAs from the tibias of 6-week-old control Pkd1 flox/flox, heterozygous Col1a1(3.6)-Cre; Pkd1 flox/+, and homozygous Pkd1Col1a1(3.6)- cKO mice (Table 1). Consistent with a low bone mass phenotype by BMD and µCT analysis, we found a significant Pkd1 gene dose-dependent decrease in osteoblast-lineage gene transcripts in these Pkd1-deficient mice, including Runx2, Osterix, FGF23, Osteoprotegerin (Opg), Rank ligand, and alkaline phosphatase 2 (Akp2) mRNA levels, but no obvious change was observed in osteocalcin expression compared to control mice (Table 1). Consistent with a ratio of Opg/RankL , which would predict reduced osteoclastogenesis, bone expression of tartrate-resistant acid phosphatase (Trap) and matrix metallopeptidase 9 (Mmp9), markers of bone resorption, were also reduced in heterozygous Col1a1(3.6)-Cre; Pkd1 flox/+ and homozygous Pkd1Col1a1(3.6)- cKO mice (Table 1). The changes in bone mRNA expression did not correlate with serum levels of these biomarkers, except serum RankL, which was reduced in Pkd1Col1a1(3.6) -cKO mice. Serum osteocalcin and OPG were elevated and TRAP was in the normal range in homozygous Pkd1Col1a1(3.6) -cKO mice compared to age-matched control Pkd1 flox/flox (Table 2).
Table 1. Gene-expression profiles in 6-week-old mice.
| Gene | Accession no. | Pkd1 flox/flox | Col1a1(3.6)-Cre; Pkd1 flox/+ | Col1a1(3.6)-Cre; Pkd1 flox/flox | p-value |
| Osteoblast lineage | |||||
| Pkd1 | NM_013630 | 1.00±0.29 | 0.75±0.21* | 0.53±0.19*,# | 0.0005 |
| Runx2 | NM_009820 | 1.00±0.25 | 0.76±0.17* | 0.54±0.11*,# | 0.0003 |
| Osterix | NM_130458 | 1.00±0.24 | 0.78±0.21* | 0.49±0.11*,# | 0.0005 |
| Osteocalcin | NM_007541 | 1.00±0.43 | 0.90±0.33 | 1.10±0.76 | 0.8078 |
| Opg | MMU94331 | 1.00±0.25 | 0.94±0.37 | 0.45±0.24*,# | 0.0041 |
| Rank ligand | NM_011613 | 1.00±0.34 | 0.58±0.19* | 0.26±0.13*,# | 0.0002 |
| Akp2 | NM_007431 | 1.00±0.27 | 0.74±0.21* | 0.48±0.11*,# | 0.0006 |
| FGF23 | NM_022657 | 1.00±0.33 | 0.84±0.11 | 0.56±0.21*,# | 0.0076 |
| Osteoclast | |||||
| Trap | NM_007388 | 1.00±0.31 | 0.73±0.15* | 0.40±0.13*,# | 0.0007 |
| Mmp9 | NM_013599 | 1.00±0.41 | 0.68±0.12* | 0.44±0.11*,# | 0.0006 |
| Adipocyte | |||||
| Adiponectin | NM_009505 | 1.00±0.21 | 1.04±0.43 | 1.82±0.56*,# | 0.0077 |
| aP2 | NM_024406 | 1.00±0.36 | 1.22±0.33 | 2.45±1.51*,# | 0.0268 |
| Lpl | NM_008509 | 1.00±0.15 | 1.17±0.21 | 1.63±0.36*,# | 0.0010 |
Data are mean ±S.D. from 5–6 tibias of 6-week-old individual mice and expressed as the fold changes relative to the housekeeping gene β-actin subsequently normalized to control mice. * indicates significant difference from control Pkd1 flox/flox mice, and # indicates significant difference from heterozygous Col1a1(3.6)-Cre;Pkd1 flox/+ mice at p<0.05, respectively.
Table 2. Biochemistry analysis of serum in 6-week-old mice.
| Genotype | Pkd1 flox/flox | Col1a1(3.6)-Cre;Pkd1 flox/+ | Col1a1(3.6)-Cre;Pkd1 flox/flox |
| BUN(mg/dl) | 21±1.8 | 20±2.8 | 36±10.4*,# |
| Ca (mg/dl) | 9.6±0.24 | 9.9±0.31 | 9.9±0.59 |
| P (mg/dl) | 7.3±0.42 | 7.1±0.15 | 6.6±0.24*,# |
| Osteocalcin (ηg/ml) | 40±17 | 88±26 | 169±91*,# |
| OPG (pg/ml) | 3.2±0.38 | 3.6±0.51 | 5.1±1.15*,# |
| RankL (pg/ml) | 89±24 | 94±19 | 53±23*,# |
| TRAP (U/L) | 4.0±0.43 | 3.5±0.82 | 3.6±0.83 |
| PTH (pg/ml) | 42±16 | 40±5.6 | 92±54*,# |
| FGF23 (pg.ml) | 94±25 | 88±24 | 173±99*,# |
Data are mean ± S.D. from 6–8 individual mice. * and # indicates significant difference from control Pkd1 flox/flox and Col1a1(3.6)-Cre;Pkd1 flox/+ mice at p<0.05, respectively. Osteocalcin is produced by osteoblasts, and TRAP is produced by osteoclasts.
In accordance with decreased osteogenesis in bone, we also observed an increased adipogenesis in bone marrow and in bone marrow stromal cultures from homozygous Pkd1Col1a1(3.6)- cKO mice. In this regard, homozygous Pkd1Col1a1(3.6)- cKO mice showed a higher number of adipocytes and volume of fat droplets in decalcified tibias stained with Oil Red O and OsO4 (Fig. 4A). BMSC cultures derived from Pkd1Col1a1(3.6)- cKO mice exhibited a marked increase of Oil Red O stained adipocytes (Fig. 4B). In addition, PPARγ, an adipocyte transcription factor, and adipocyte markers such as aP2 (adipocyte fatty acid-binding protein 2) were also significantly increased in BMSC cultures of Pkd1Col1a1(3.6)- cKO mice compared to Pkd1 flox/flox control mice (Fig. 4C and 4D), consistent with increased adipogenic markers including adiponectin, aP2, and Lpl (lipoprotein lipase) in long bone samples of Pkd1Col1a1(3.6)- cKO mice (Table 1).
Figure 4. Col1a1(3.6)-Cre-mediated conditional deletion of Pkd1 results in enhanced adipogenesis in bone marrow and in bone stromal cell cultures.

(A) Histology of adipocytes in decalcified tibias. Oil Red O staining (upper panel) showed that the numbers of adipocytes and fat droplets in tibia bone marrow were greater in 6-week-old Col1a1(3.6)-Cre; Pkd1 flox/flox mice compared with age-matched control Pkd1 flox/flox mice. Osmium tetroxide (OsO4) staining by μCT analyses (lower panel) showed that adipocyte volume/marrow volume (Ad.V/Ma.V, %) and adipocyte number (Ad.N, mm−3) were much higher in the proximal tibia from 6-week-old Col1a1(3.6)-Cre; Pkd1 flox/flox mice compared with age-matched control Pkd1 flox/flox mice. (B) Adipocytic differentiation in BMSC cultures. An increase of adipogenesis potential was observed in 6-week-old Col1a1(3.6)-Cre; Pkd1 flox/flox BMSC cultures, evidenced by a significant increase of Oil Red O staining in adipogenic cultures. (C and D) Expression of adipogenic markers by real-time RT-PCR. Significantly increased levels of PPARγ and aP2 mRNAs were observed in 6-week-old Col1a1(3.6)-Cre; Pkd1 flox/flox BMSC cultures compared with control (Pkd1 flox/flox) cultures. Data are expressed as the mean ± SD from three independent experiments. # Significant difference from control (Pkd1 flox/flox) at P<0.05.
Effect of Col1a1 (3.6)-Cre-mediated conditional deletion of Pkd1 on osteoblastic function ex vivo
To determine the impact of Col1a1(3.6)-Cre-mediated conditional deletion of Pkd1 on osteoblast function ex vivo, we isolated primary calvarial osteoblasts from E17.5 control Pkd1 flox/flox, heterozygous Col1a1(3.6)-Cre; Pkd1 flox/+ , and homozygous Pkd1Col1a1(3.6)- cKO fetuses. Primary calvarial osteoblasts under osteogenic culture condition undergo progressive alterations in cell proliferation and osteoblastic differentiation that recapitulates the osteoblastic developmental program [34]. Consistent with our previous report [17], we found that heterozygous Col1a1(3.6)-Cre;Pkd1 flox/+ and homozygous Pkd1Col1a1(3.6) -cKO osteoblasts increased BrdU incorporation that were proportionate to the reduction of Pkd1 gene dose (Fig. 5A and 5B). In addition, heterozygous Col1a1(3.6)-Cre;Pkd1 flox/+ and homozygous Pkd1Col1a1(3.6)- cKO osteoblasts had a gene dose-dependent impairment of osteoblastic differentiation and maturation, as evidenced by culture duration-dependent reductions in ALP activity (Fig. 5C), diminished calcium deposition in extracellular matrix (Fig. 5D), and reduced osteoblastic differentiation markers, including Runx2 and Akp2, compared to control Pkd1 flox/flox osteoblasts (Fig. 5E and 5F). A similar reduction of FGF23 transcripts was also observed in vitro cultures osteoblasts at day 18 (Fig. 5 G). In agreement with increased adipogenic markers observed in bone in vivo, heterozygous Col1a1(3.6)-Cre;Pkd1 flox/+ and homozygous Pkd1Col1a1(3.6)- cKO osteoblasts exhibited a gene dose-dependent increase of adipocyte markers such as PPARγ2 and aP2 (Fig. 5H and 5I), suggesting that impairment of osteogenesis was associated with enhancement of adipogenesis in Col1a1(3.6)-Cre-mediated conditional deletion of Pkd1 osteoblast cultures.
Figure 5. Effects of Col1a1(3.6)-Cre-mediated conditional deletion of Pkd1 on osteoblastic proliferation and maturation, as well as gene expression profiles ex vivo.

(A) Total Pkd1 transcripts by real-time RT-PCR. All Pkd1 transcripts were dose-dependently reduced in primary osteoblast cultures from heterozygous Col1a1(3.6)-Cre; Pkd1 flox/+ and homozygous Col1a1(3.6)-Cre; Pkd1 flox/flox mice. (B) BrdU incorporation. A gene dose-dependent increase of BrdU incorporation was observed during 6 h of primary osteoblast culture from heterozygous Col1a1(3.6)-Cre; Pkd1 flox/+ and homozygous Col1a1(3.6)-Cre; Pkd1 flox/flox mice. (C) ALP activity. Osteoblasts from control, heterozygous, and homozygous mice displayed time-dependent increments in ALP activity during 21 days of culture, but ALP activity was gene dose- and time-dependently decreased in heterozygous and homozygous osteoblasts compared to control osteoblasts. (D) Quantification of mineralization. Alizarin Red-S was extracted with 10% cetylpyridinium chloride and quantified as described in Materials and Methods. A time-dependent increment of Alizarin Red-S accumulation was observed in control, heterozygous, and homozygous osteoblasts during 21 days of culture, but the accumulation was gene dose-dependently decreased in heterozygous and homozygous osteoblasts cultures compared to control osteoblasts at day 21 of culture. (E–I) Gene expression profiles by real-time RT-PCR. Osteoblastic markers such as Runx2, Akp2, and FGF23 were gene dose-dependently reduced during 18 days of osteogenic culture from heterozygous and homozygous osteoblasts. In contrast, a marked increase of adipocyte markers such as PPARγ2 and aP2 was observed from heterozygous and homozygous osteoblasts under the same osteogenic media when compared with control osteoblasts. Data are expressed as the mean ± SD from three independent experiments. *Significant difference from control (Pkd1 flox/flox); #significant difference from heterozygous Col1a1(3.6)-Cre; Pkd1 flox/+ mice at P<0.05, respectively.
Development of polycystic kidney and pancreatic disease in homozygous Pkd1Col1a1(3.6)- cKO embryos and mice
Besides skeletal abnormalities, we also observed that homozygous Pkd1Col1a1(3.6)- cKO mice developed severe renal and pancreatic cysts at 6 weeks-of-age. In contrast, no cyst formation was observed in the kidney or pancreas of age-matched control Pkd1 flox/flox or heterozygous Col1a1(3.6)-Cre;Pkd1 flox/+ mice (Fig. 6A). Hematoxylin-eosin (H&E)-stained sections showed no cyst formation in liver tissues from all of three groups (Fig. 6B), in spite of 35% and 54% reduction in Pkd1 mRNA expression in heterozygous Col1a1(3.6)-Cre;Pkd1 flox/+ and homozygous Col1a1(3.6)-Cre;Pkd1 flox/flox mice, respectively (Fig. 1F). Homozygous Pkd1Col1a1(3.6)- cKO mice developed massive cysts in both the pancreas and kidney; however, glomeruli formation in the kidney and endocrine islet formation in pancreas were unaffected (Fig. 6C and 6D). Expansion of pancreatic ducts formed large pancreatic cysts that led to massive acinar cell loss, formation of abnormal tubular structures, and appearance of endocrine cells in ducts (Fig. 6C and 6D).
Figure 6. Col1a1(3.6)-Cre-mediated conditional deletion of Pkd1 causes polycystic pancreas and kidney.

(A) Gross appearance of liver, kidney, and pancreas. There was no cyst formation in the liver, kidney, and pancreas in heterozygous Col1a1(3.6)-Cre;Pkd1 flox/+ mice, whereas age-matched homozygous Col1a1(3.6)-Cre;Pkd1 flox/flox mice developed severe renal and pancreatic cysts at 6 weeks of age. (B–D) Hematoxylin-eosin-stained sections (5X) of liver, pancreas, and kidney from 6-week-old mice. Cysts were not observed in the livers from heterozygous and homozygous mice, and renal and pancreatic cysts were also not found in kidney and pancreas tissues from heterozygous Col1a1(3.6)-Cre;Pkd1 flox/+ mice. However, homozygous Col1a1(3.6)-Cre;Pkd1 flox/flox mice exhibited massive cyst formation in both the pancreas and kidney. Interestingly, glomeruli formation in the kidney and endocrine islet formation in pancreas appeared to be unaffected. In addition, expansion of pancreatic ducts formed large pancreatic cysts that led to massive acinar cell loss, formation of abnormal tubular structures, and appearance of endocrine cells in ducts.
Timed pregnancies were generated to analyze heterozygous Col1a1(3.6)-Cre;Pkd1 flox/+ and homozygous Pkd1Col1a1(3.6)- cKO fetuses at various developmental stages. We did not observe renal or pancreatic cysts in heterozygous Col1a1(3.6)-Cre;Pkd1 flox/+ mice during embryogenesis or at 6-weeks of age (data not shown). Pancreatic cysts first became evident in homozygous Pkd1Col1a1(3.6)- cKO embryos was at E15.5 (Fig. 7A and 7B). In addition, the dilatation of pancreatic cysts progressed as a function of age in homozygous Pkd1Col1a1(3.6) -cKO (Fig. 7A and 7B). The size of renal cystic lesions also increased as a function of age. Masson-trichrome stained sections of the kidney showed that the cystic fibrosis of polycystic kidney started at P7 and became progressively more severe by 6-weeks of age (Fig. 8A and 8B). Real-time RT-PCR showed that mesenchymal-to-epithelial transition and fibrosis formation genes were significantly up-regulated in cystic kidney from homozygous Pkd1Col1a1(3.6) -cKO mice compare with control Pkd1 flox/flox mice (Fig. 9A–9F), but no such alterations were observed in heterozygous Col1a1(3.6)-Cre;Pkd1 flox/+ mice (Fig. 9A–9F). In addition, homozygous Pkd1Col1a1(3.6)- cKO mice had significantly higher levels of serum BUN, PTH, and FGF23, but lower levels of phosphorus, and no changes in calcium levels at 6 weeks of age (Table 2), consistent with the development of renal impairment caused by polycystic kidney disease and secondary induction of compensatory hormonal changes (Table 2).
Figure 7. Development of cysts in pancreas and kidney caused by Col1a1(3.6)-Cre-mediated conditional deletion of Pkd1.
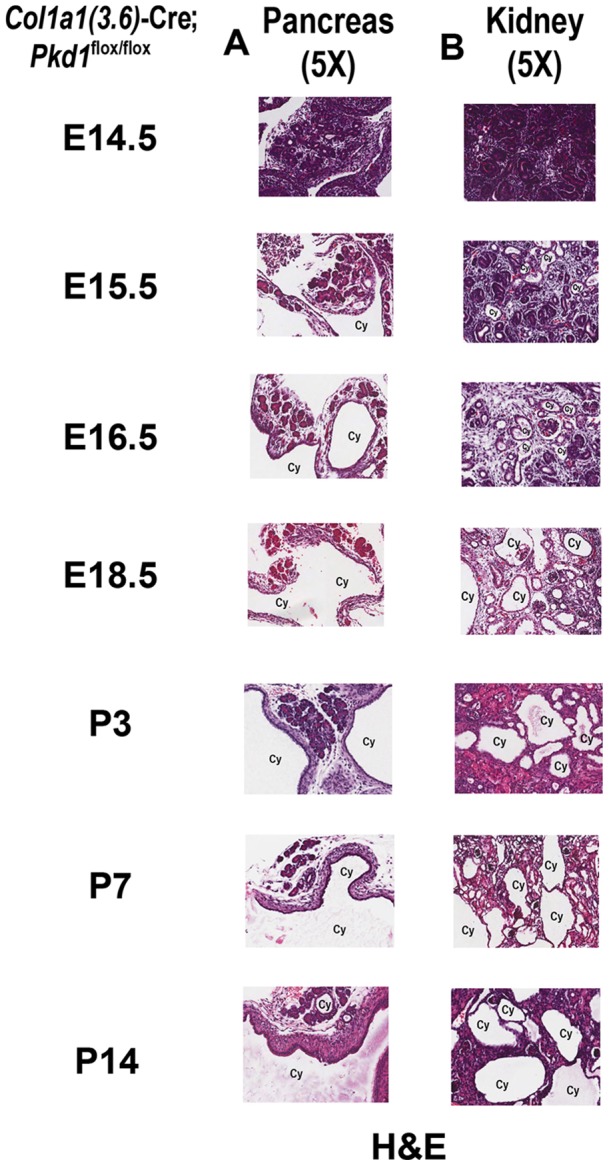
Hematoxylin-eosin (H&E) staining (5X) for pancreas (A) and kidney (B) between E14.5 and P14. Both pancreatic duct and renal tubule cysts started at E15.5 in homozygous Col1a1(3.6)-Cre;Pkd1 flox/flox embryos, and the size of renal cystic lesions developed rapidly between E15.5 and P14.
Figure 8. Development of fibrosis in kidney caused by Col1a1(3.6)-Cre-mediated conditional deletion of Pkd1.
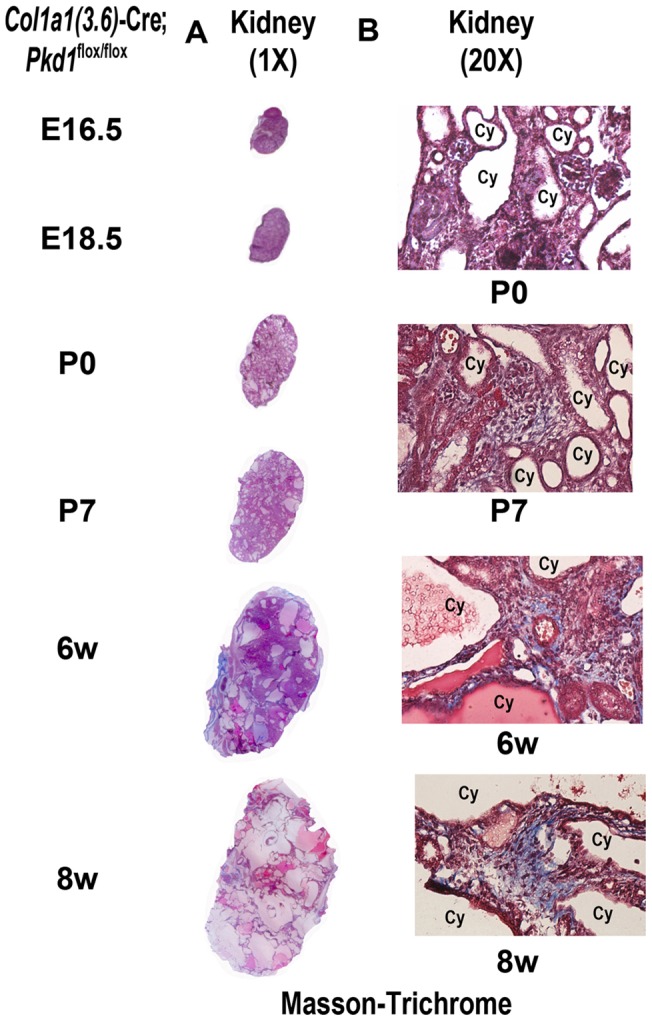
Masson-trichrome staining for fibrosis in polycystic kidney sections (A)1X, (B) 20X magnification between E16.5 and 8 weeks (8w). Masson-trichrome staining was observed in polycystic kidney tissue at P7 and became more severe at 8 weeks of age, indicating a renal fibrosis formation occurring in Col1a1(3.6)-Cre;Pkd1 flox/flox mice.
Figure 9. Effect of Col1a1(3.6)-Cre-mediated conditional deletion of Pkd1 in kidney on expression of epithelia-mesenchymal-transition (EMT) and fibrosis markers.

(A–C) Expression of EMT markers in polycystic kidneys of 6-week-old mice by real-time RT-PCR. A panel of EMT markers including transforming growth factor β (TGF-β), snail1, and vimentin were significantly up-regulated in polycystic kidney from homozygous Col1a1(3.6)-Cre;Pkd1 flox/flox mice compare with age-matched control Pkd1 flox/flox mice. (D–F) Expression of fibrosis markers in polycystic kidneys of 6-week-old mice by real-time RT-PCR. A panel of fibrosis markers such as α-smooth muscle actin (α-SMA) and precollagen type I (Col1a1) was markedly increased in the kidney from homozygous Col1a1(3.6)-Cre;Pkd1 flox/flox mice compare with age-matched control Pkd1 flox/flox mice. 18 S was served as an internal control for gene expressions. There were no differences in EMT and fibrosis markers between heterozygous and control Pkd1 flox/flox mice. Data represent the mean ± SD from five to six individual mice. *Significant difference from control (Pkd1 flox/flox); #significant difference from Col1a1(3.6)-Cre;Pkd1 flox/+ mice at P<0.05, respectively.
Discussion
Pkd1, Pkd2, and primary cilia are present in mature osteoblasts and osteocytes [16], where the primary cilia-polycystin complex plays an important role in postnatal osteoblast and osteocyte regulation of bone formation and mechanosensing [17], [18]. Primary cilia-polycystin complexes are known to have a role in regulating developmental pathways in other tissues, such as left-right patterning in embryos and kidney development [35], but the role of Pkd1 in osteoblast development and bone embryogenesis, while suggested by skeletal alterations in global Pkd1 knockout mice [16], [17], [18], [36], has not been confirmed by selective ablation of Pkd1 early in the osteoblast lineage. In the current study, Pkd1 was conditionally deleted in mesenchymal precursors that are destined to become multiple cell types including osteoblast lineage [37], renal tubule cells [38], pancreas duct epithelial cells [39], and bile ductal plate cells [40] by creating Pkd1Col1a1(3.6)- cKO or Col1a1(3.6)-Cre;Pkd1 flox/null mice, which differ in the degree of Pkd1 deletion [33].
We found that reduction of Pkd1 in mesenchymal precursors in Pkd1Col1a1(3.6)- cKO mice resulted in impaired osteoblast-mediated bone formation and low bone mass in the adult mouse, consistent with the observations in Oc-Cre- and Dmp1-Cre-mediated conditional knockout of Pkd1 [17], [18]. Primary osteoblast cultures showed higher cell replication and lower osteoblastic differentiation markers in E17.5 homozygous Pkd1Col1a1(3.6)- cKO mice, similar to the defects of osteoblastic maturation in Oc-Cre-mediated conditional knockout of Pkd1 [17]. The increased proliferation observed in Pkd1-deficient osteoblasts is similar to increased renal cell proliferation caused by loss of Pkd1 in renal epithelial cells, suggesting that an important function of Pkd1 is to regulate cell proliferation, which is typically inversely correlated with differentiation [41], [42]. In addition, the marrow fat content of bone was increased and enhanced adipogenesis was found in bone marrow stromal cell cultures, which expressed decreased levels of the osteoblast differentiation factor Runx2 and increased levels of PPARγ (peroxisome-proliferator-activated receptor-γ), which regulates adipocyte development. These findings are consistent with previous studies showing that Pkd1 stimulates osteogenesis and inhibits adipogenesis through a Pkd2-calcium dependent Runx2 expression and that compound heterozygous Pkd1 and Runx2 deficient mice have additive effects to induce osteopenia [17], [18], [36]. Further studies are needed to determine the signaling pathways linking Pkd1 inactivation in pre-osteoblasts to increments in PPARγ expression.
We were surprised by the difference in skeletal abnormalities between newborn Col1a1(3.6)-Cre;Pkd1 flox/null and Pkd1Col1a1(3.6)- cKO mice. Col1a1(3.6)-Cre;Pkd1 flox/null had evidence of abnormal skeletogenesis, albeit less severe than the previously described global Pkd1 −/− mouse models [14], [15], [16]. Col1a1(3.6)-Cre, which is highly active between E12.5 and E14.5, and the resulting bone abnormalities are consistent with known effects of Pkd1to regulate Runx2, an essential transcriptional factor controlling osteoblast development [43], [44]. In contrast, newborn Pkd1Col1a1(3.6)- cKO mice lacked a demonstrable bone phenotype, consistent with studies in Osx-Cre;Pkd1 flox/flox mice, which also failed to find evidence for a role of Pkd1 in skeletogenesis [45]. A gene-dose dependent effect on skeletogenesis and differences in methods of conditional gene targeting might explain these discrepancies. In this regard, the less severe skeletal phenotype in newborn Pkd1Col1a1(3.6)- cKO and Osx-Cre;Pkd1 flox/flox mice compared to Col1a(3.6)-Cre;Pkd1 flox/null mice may be due to insufficient reductions in Pkd1 expression to cause abnormal osteoblast development [33]. Additional studies are needed using the heterozygous floxed allele paired with a “null” mutant allele along with earlier osteoblast lineage specific and less leaky promoters to define the function of Pkd1 in osteoblast development during different stages of embryogenesis [17], [33], [46].
The role of Pkd1 in post-natal bone remodeling is further documented by the current studies. Bone remodeling that occurs postnatally is characterized by the recruitment of bone marrow mesenchymal stem cells to differentiate into osteoblasts that refill resorptive cavities. Our studies suggest that a reduction of Pkd1 expression of more than 50% results in abnormalities in osteoblast-mediated bone formation in adult mice through Pkd1 regulation of critical transcription factors involved in osteoblastogenesis and adipogenesis [47], [48], [49]. We have previously shown that the bone-specific deletion of Pkd1 using Oc-Cre or Dmp1-Cre had a direct role in adult bone formation [17], [18]. However, we observed a more severe osteopenia in adult Pkd1Col1a1(3.6)- cKO compared to Oc-Cre or Dmp1-Cre-mediated Pkd1 deletion, which could result from the effects of Col1a1(3.6)-Cre to delete Pkd1 during embryogenesis or to the leakiness of this promoter leading to alterations in systemic factors that lead to secondary effects on bone. Although we observed significant increases of serum PTH and FGF23 levels in association with elevated BUN in adult Pkd1Col1a1(3.6)- cKO mice, the expected PTH-induced increases in bone transcripts were not observed, rather we found that Akp2, FGF23, Trap, Osterix and Runx2 transcripts were decreased in Pkd1Col1a1(3.6)- cKO, suggesting a direct effect of Pkd1 on bone. In addition, our finding of abnormal skeletogenesis in newborn Col1a1(3.6)-Cre;Pkd1 flox/null mice and impairment in osteoblast differentiation maturation in E17.5 immortalized osteoblast cultures from Pkd1Col1a1(3.6)- cKO mice, are consistent with direct effects of Pkd1 in osteoblasts, as previously reported [16].
Interestingly, in this model, serum phosphate was low and FGF23 was high, consistent with other reports that FGF23 regulation may be abnormal in ADPKD [19]. However, we failed to find evidence for increased FGF23 mRNA expression in bone or in osteoblasts cultures derived from Pkd1Col1a1(3.6)- cKO mice; rather FGF23 mRNA levels were decreased in bone and osteoblasts cultures from these mice, suggesting that reduction of Pkd1 in osteoblast lineage diminishes FGF23 production. The disparity between serum FGF23 and bone expression of FGF23 is consistent with recent findings that FGF23 is regulated by both transcriptional and post-transcriptional mechanisms [50].
In addition to skeletal abnormalities, we found that Col1a1(3.6)-Cre-mediated deletion of Pkd1 resulted in cyst formation in the kidney and pancreas. Although Pkd1 is expressed in undifferentiated mesenchyme during embryogenesis [1], [2], [51] and Pkd1 mutations lead to cyst formation in the kidney, pancreas and liver in hereditary polycystic diseases [52], [53], [54], [55], [56], extraskeletal abnormalities due to deletion of Pkd1 in mesenchymal precursors using Col1a1(3.6)-Cre was unexpected. Indeed, the Col1a1(3.6) promoter has been purported to specifically target cells of the osteoblastic lineage, and in previous reports was found to have minimal expression of Cre-recombinase in liver, pancreas, and kidney [30], [32]. However, unlike our studies, the prior reports did not examine Cre-mediated recombination in extraskeletal tissues. Indeed, we found evidence for Col1a1(3.6)-Cre deletion of Pkd1 in all tissues tested, including kidney, pancreas and liver. Pancreatic and renal cysts developed by E15.5, just after highly expression of Col1a1(3.6)-Cre activity in skeletal tissues at E12.5 [29], [30], [31]. The size of polycystic pancreas and kidney varied between individual mice, and only 30% of individual homozygous Pkd1Col1a1(3.6)- cKO mice had both polycystic pancreas and kidney, indicating the possible effects of a mixed genetic background or other factors affecting cyst formation in these mice. This observation, along with the fact that mesenchymal cells give rise to both osteoblasts during bone development and renal tubular epithelia through mesenchymal-to-epithelial transition during kidney development [37], [57], [58], [59], and pancreatic mesenchyme gives rise to pancreatic ducts by epithelial-mesenchymal interaction during pancreas development [60], [61], [62], suggests a broad role of Pkd1 in mesenchymal development pathways. Also, consistent with the known gene-dose dependent effect of Pkd1 in cystogenesis that requires a second hit in humans to cause ADPKD, there was no evidence of cysts formation in the pancreas or kidney of heterozygous Col1a1(3.6)-Cre;Pkd1 flox/+ mice. Approximately 30% of homozygous Pkd1Col1a1(3.6)- cKO adult mice exhibited a polycystic pancreas containing solitary unilocular cysts, whereas pancreatic cysts have been reported in only 5% of patients with ADPKD [63], [64].
Interestingly, we did not observe cyst formation in the liver of 6-week-old homozygous Pkd1Col1a1(3.6)- cKO mice, in spite of the known propensity for liver cyst formation in hereditary cystic disorders. The reason for the absence of cyst formation in the liver is not clear from our studies, because Col1a1(3.6)-Cre is expressed in the liver and results in excision of the Pkd1 flox allele in this tissue, similar to the pancreas and kidney. In contrast, MTTV-Cre-mediated conditional deletion of Pkd1 results in liver cysts by 10 weeks-of-age [25], suggesting that the lack of liver cysts in our study was a consequence of limitations of the Col1a1(3.6)-Cre or the need for additional time for cyst development in the liver. Regardless, the broad expression of Col1a1(3.6)-Cre in multiple tissues limits the conclusion that can be drawn from this targeting strategy [32].
Regardless, unlike the embryonic lethality of global Pkd1 null mice [7], [15], the conditional Pkd1 null mice are born alive and exhibit a 50% 6-week survival rate, thereby creating a new model to study polycystic kidney and pancreatic cystic disease postnatally. We found that the expression of growth factor such as TGF-β was significantly increased in homozygous Pkd1Col1a1(3.6)- cKO kidney at 6 weeks of age, which would stimulate the epithelial cell phenotype's transformation, producing myofibroblasts and secreting extracellular matrix (ECM). In fact, snail1 and vimentin, the EMT markers, and α-SMA and Col1a1, the fibrosis markers, were markedly upregulated in homozygous Pkd1Col1a1(3.6)- cKO kidney compared with controls at 6 weeks of age. These findings agree with previous reports that polycystic kidney disease triggers the onset of epithelial-mesenchymal transition (EMT) and renal fibrosis [65], [66], [67], [68], [69], [70].
In conclusion, the conditional deletion of Pkd1 from mesenchymal lineage results in both defective bone formation and polycystic kidney and pancreatic but not liver disease, indicating that val function in mesenchymal precursors to regulate skeletal, renal, and pancreatic development. The long-term survival of Pkd1Col1a1(3.6)- cKO mice establishes a potential model to study postnatal interventions to retard cyst formation.
Materials and Methods
Mice
We obtained the floxed Pkd1 mouse (Pkd1 flox/flox) which harbors two loxP sites flanking exon 2–4 of the Pkd1 gene from Dr. Gregory Germino at Johns Hopkins University [25] and Col1a1(3.6)-Cre transgenic mouse, which has activity in mesenchymal precursors, from the University of Missouri-Kansas City [31]. We crossed the floxed heterozygous Pkd1 flox/+ mice with heterozygous Col1a1(3.6)-Cre mice to generate double heterozygous Col1a1(3.6)-Cre;Pkd1 flox/+ mice. Then the resulting Col1a1(3.6)-Cre; Pkd1 flox/+ mice were bred with homozygous Pkd1 flox/flox mice to generate conditional Pkd1 homozygous mice (Col1a1(3.6 -Cre;Pkd1 flox/flox), conditional Pkd1 heterozygous mice (Col1a1(3.6)-Cre;Pkd1 flox/+), homozygous Pkd1 flox/flox mice, and heterozygous Pkd1 flox/+ mice. To achieve greater Cre-mediated reduction in Pkd1 conditional deletion, we bred double heterozygous Col1a1(3.6) -Cre;Pkd1null /+ mice with homozygous Pkd1 flox/flox mice to generate excised floxed Pkd1 heterozygous (Col1a1(3.6) -Cre;Pkd1 flox/+) and null mice (Col1a1(3.6) -Cre;Pkd1 flox/null), as well as Pkd1 heterozygous mice (Pkd1 flox/null) and Col1a1(3.6)-Cre negative control mice (Pkd1 flox/+, equivalent to wild type). These mice were used for phenotypic analysis. Mouse embryos between embryonic day 14.5 (E14.5) and E18.5 were collected from timed pregnant mice. All animal research was conducted according to guidelines provided by the National Institutes of Health and the Institute of Laboratory Animal Resources, National Research Council. The University of Tennessee Health Science Center's Animal Care and Use Committee approved all animal studies (Protocol number: 1885R2).
Genotyping polymerase chain reaction (PCR) to detect deletions
Genomic DNA was prepared from different tissues using standard procedures, and genotyping PCR was performed to detect Col1a1(3.6)-Cre-mediated deletions of the Pkd1 gene as previously described [17], [18]. In this regard, Pkd1 wild-type (Pkd1 +) and floxed (Pkd1 flox) alleles were identified in 2% agarose gels as 130- and 670-bp bands, respectively. The conditional deleted Pkd1 (Pkd1 Δflox) allele was detected as a 0.85-kb band in 1% agarose gels as previously described [17], [18].
Bone densitometry, histomorphometric, marrow adipocyte staining, and microcomputed tomography analyses
BMD of femurs was assessed at 6 weeks of age with a LUNARPIXIMUS bone densitometer (Lunar Corp., Madison, WI, USA). Calcein (Sigma-Aldrich, St. Louis, MO, USA) double labeling of bone and histomorphometric analyses of periosteal MAR in tibias were performed using the osteomeasure analysis system (OsteoMetrics, Decatur, GA, USA) [71], [72]. The distal femoral metaphyses were also scanned with a Scanco µCT 40 (Scanco Medical AG, Brüttisellen, Switzerland). 3D-images were analyzed to determine bone volume/trabecular volume and cortical thickness as previously described [71]. For detection of bone marrow adipocytes, whole intact femurs or tibiae with encapsulated marrow were dissected from 6-week-old mice, fixed for 48 h in phosphate-buffered paraformaldehyde, decalcified in 14% EDTA, and then stained with aqueous osmium tetroxide (OsO4) for quantification of fat volume, density, and distribution by μCT analysis [17]. In addition, the cryosectioning was performed for Oil Red O lipid staining as previously reported in our laboratory [17].
Tissue histology and kidney fibrosis staining
The kidneys, livers, and pancreases from E14.5-, E15.5-, E16.5-, E18.5-, newborn (P0)-, postnatal day 3 (P3)-, 7 (P7)-, 14(P14)-, 4-, 6-, and 8-week-old mice were collected and fixed in 4% paraformaldehyde for 24 h and then embedded in paraffin. Eight-micrometer tissue sections were used for hematoxylin-eosin staining as described previously [17]. Masson-Trichrome staining for collagen fibers on kidney sections was also performed according to the manufacturer's instructions (Polysciences Inc., Warrington PA, USA).
Serum biochemistry
Serum osteocalcin levels were measured using a mouse Osteocalcin EIA kit (Biomedical Technologies, Inc., Stoughton, MA, USA). Serum BUN was determined using a BUN diagnostic kit from Pointe Scientific, Inc (Canton, MI, USA). Serum calcium (Ca) was measured by the colorimetric cresolphthalein binding method, and phosphorus (P) was measured by the phosphomolybdate –ascorbic acid method (Stanbio Laboratory, Boerne, TX, USA). Serum osteoprotegerin (OPG) and Rank ligand (RankL) were measured using mouse ELISA kits (Quantikine®, R&D Systems, Minneapolis, MN, USA), and serum tartrate-resistant acid phosphatase (TRAP) was assayed with the ELISA-based SBA Sciences mouse TRAPTM assay (Immunodiagnostic Systems, Fountain Hills, AZ, USA). Serum parathyroid hormone (PTH) levels were measured using the Mouse Intact PTH ELISA kit (Immutopics, Carlsbad, CA, USA). Serum FGF23 levels were measured using the FGF23 ELISA kit (Kainos Laboratories, Tokyo, Japan).
Bone RNA isolation and real-time reverse transcriptase (RT)-PCR
For quantitative real-time RT-PCR, 1.0 μg total RNA isolated from calvaria, kidney, liver, and whole tibias of 6-week-old control and Col1a1(3.6)-Cre-mediated Pkd1-deficient mice was reverse transcribed as previously described [34]. PCR reactions contained 20 ηg template (cDNA or RNA), 375 ηM each forward and reverse primers, and 1X SsoFastTM EvaGreen® supermix (Bio-Rad, Hercules, CA, USA) in a total of 10 μl reaction volume. The threshold cycle (Ct) of tested gene product from the indicated genotype was normalized to the Ct for cyclophilin A. Expression of total Pkd1 transcripts was performed using the following Pkd1-allele-specific primers in exons 2–4: forward primer of normal Pkd1 + transcript (Pkd1 + plus Pkd1 flox): 5′-ATA GGG CTC CTG GTG AAC CT-3′, and reverse primer: 5′-CCA CAG TTG CAC TCA AAT GG-3′. The normal Pkd1 + vs. cyclophilin A was normalized to the mean ratio of five control mice, which was set to 1. The percentage of conditional deleted Pkd1(Pkd1 Δflox) transcripts was calculated from the relative levels of the normal Pkd1 + transcripts in different Pkd1-deficient mice [73]. All primer information of other genes used in real-time RT-PCR can be found in our previous report [18].
Cell proliferation, osteoblastic differentiation, and gene expression profiles in immortalized osteoblast cultures
Calvaria from E17.5 control and Pkd1-deficient embryos were used to isolate primary osteoblasts by sequential collagenase digestion at 37°C. To engineer immortal osteoblast cell lines, isolated primary osteoblasts were infected using a retroviral vector carrying SV40 large and small T antigen as previously described [34], [74]. Briefly, cells were grown in 100-mm plates at 50–60% confluence the day before infection. On the day of infection, the medium was removed and replaced with medium containing SV40 large and small T antigen-helper-free viral supernatant in the presence of 4 mg/ml of polybrene (Sigma, St. Louis, MO, USA) for 48 h. The cells were allowed to recover for 72 h followed by selection with 1 mg/ml puromycin (Sigma) for up to 15 days. The immortalized osteoblasts were cultured in α-MEM containing 10% FBS and 1% penicillin and streptomycin (P/S) and characterized following the protocols below. Cell proliferation was detected by BrdU incorporation assays following the manufacturer's directions (QIA58, Calbiochem, Gibbstown, NJ, USA). To induce differentiation, the immortalized osteoblasts were plated at a density of 2×10⁴ cells per well in a 12-well plate and 4×10⁴ cells per well in a 6-well plate and grown up to 21 days in α-MEM containing 10% FBS supplemented with 5 mM β-glycerophosphate and 25 µg/ml ascorbic acid. ALP activity and Alizarin red-S histochemical staining for mineralization were performed as previously described [16], [34]. Total DNA content was measured with a PicoGreen® dsDNA quantitation reagent and kit (Molecular Probes, Eugene, OR, USA). Protein concentrations of the supernatant were determined with a Bradford protein assay kit (Bio-Rad, Heumrcules, CA, USA). For gene expression profiles, 1.0 μg of total RNA was isolated from primary osteoblasts cultured 4, 12, and 21 days in differentiation media. The cDNAs were generated using an iScript reverse transcription kit (Bio-Rad). PCR reactions contained 20 ηg template (cRNA or cDNA), 375 ηmol each forward and reverse primers, 1X SsoFastTM EvaGreen® supermix (Bio-Rad) in a total of 10 µl reaction volume. The Ct of tested gene product from the indicated genotype was normalized to the Ct for cyclophilin A as previously described [16], [34], [36].
Statistical analysis
We evaluated differences between two groups by unpaired t-test and multiple groups by one-way analysis of variance. All values are expressed as means ± SD. All computations were performed using GraphPad Prism5 (GraphPad Software Inc. La Jolla, CA, USA).
Funding Statement
This work was supported by grants P50-DK057301 (National Institute of Diabetes and Digestive and Kidney Diseases) to James P. Calvet, R21-AR056794 (National Institute of Arthritis and Musculoskeletal and Skin Diseases) to Zhousheng Xiao, and R01-DK083303 (National Institute of Diabetes and Digestive and Kidney Diseases) to L. Darryl Quarles from the National Institutes of Health. The funders had no role in study design, data collection and analysis, decision to publish, or preparation of the manuscript.
References
- 1. Xu H, Shen J, Walker CL, Kleymenova E (2001) Tissue-specific expression and splicing of the rat polycystic kidney disease 1 gene. DNA Seq 12: 361–366. [DOI] [PubMed] [Google Scholar]
- 2. Chauvet V, Qian F, Boute N, Cai Y, Phakdeekitacharoen B, et al. (2002) Expression of PKD1 and PKD2 transcripts and proteins in human embryo and during normal kidney development. Am J Pathol 160: 973–983. [DOI] [PMC free article] [PubMed] [Google Scholar]
- 3. Gabow PA (1993) Autosomal dominant polycystic kidney disease. N Engl J Med 329: 332–342. [DOI] [PubMed] [Google Scholar]
- 4. Wilson PD (2004) Polycystic kidney disease. N Engl J Med 350: 151–164. [DOI] [PubMed] [Google Scholar]
- 5. Housset C (2005) [Cystic liver diseases. Genetics and cell biology]. Gastroenterol Clin Biol 29: 861–869. [DOI] [PubMed] [Google Scholar]
- 6. Skala I, Prat V, Mareckova O, Dite P, Vitek J, et al. (1985) [Cysts in the liver and pancreas in polycystic kidney in adults]. Vnitr Lek 31: 677–681. [PubMed] [Google Scholar]
- 7. Lu W, Peissel B, Babakhanlou H, Pavlova A, Geng L, et al. (1997) Perinatal lethality with kidney and pancreas defects in mice with a targetted Pkd1 mutation. Nat Genet 17: 179–181. [DOI] [PubMed] [Google Scholar]
- 8. Schievink WI, Torres VE, Piepgras DG, Wiebers DO (1992) Saccular intracranial aneurysms in autosomal dominant polycystic kidney disease. J Am Soc Nephrol 3: 88–95. [DOI] [PubMed] [Google Scholar]
- 9. Chauveau D, Pirson Y, Verellen-Dumoulin C, Macnicol A, Gonzalo A, et al. (1994) Intracranial aneurysms in autosomal dominant polycystic kidney disease. Kidney Int 45: 1140–1146. [DOI] [PubMed] [Google Scholar]
- 10. Peczkowska M, Januszewicz A, Grzeszczak W, Moczulski D, Janaszek-Sitkowska H, et al. (2004) The coexistence of acute aortic dissection with autosomal dominant polycystic kidney disease–description of two hypertensive patients. Blood Press 13: 283–286. [DOI] [PubMed] [Google Scholar]
- 11. Hassane S, Claij N, Lantinga-van Leeuwen IS, Van Munsteren JC, Van Lent N, et al. (2007) Pathogenic sequence for dissecting aneurysm formation in a hypomorphic polycystic kidney disease 1 mouse model. Arterioscler Thromb Vasc Biol 27: 2177–2183. [DOI] [PubMed] [Google Scholar]
- 12. Driscoll JA, Bhalla S, Liapis H, Ibricevic A, Brody SL (2008) Autosomal dominant polycystic kidney disease is associated with an increased prevalence of radiographic bronchiectasis. Chest 133: 1181–1188. [DOI] [PubMed] [Google Scholar]
- 13.Garcia-Gonzalez MA, Outeda P, Zhou Q, Zhou F, Menezes LF, et al.. (2010) Pkd1 and Pkd2 are required for normal placental development. PLoS One 5. [DOI] [PMC free article] [PubMed]
- 14. Lu W, Shen X, Pavlova A, Lakkis M, Ward CJ, et al. (2001) Comparison of Pkd1-targeted mutants reveals that loss of polycystin-1 causes cystogenesis and bone defects. Hum Mol Genet 10: 2385–2396. [DOI] [PubMed] [Google Scholar]
- 15. Boulter C, Mulroy S, Webb S, Fleming S, Brindle K, et al. (2001) Cardiovascular, skeletal, and renal defects in mice with a targeted disruption of the Pkd1 gene. Proc Natl Acad Sci U S A 98: 12174–12179. [DOI] [PMC free article] [PubMed] [Google Scholar]
- 16. Xiao Z, Zhang S, Mahlios J, Zhou G, Magenheimer BS, et al. (2006) Cilia-like structures and polycystin-1 in osteoblasts/osteocytes and associated abnormalities in skeletogenesis and Runx2 expression. J Biol Chem 281: 30884–30895. [DOI] [PMC free article] [PubMed] [Google Scholar]
- 17. Xiao Z, Zhang S, Cao L, Qiu N, David V, et al. (2010) Conditional disruption of Pkd1 in osteoblasts results in osteopenia due to direct impairment of bone formation. J Biol Chem 285: 1177–1187. [DOI] [PMC free article] [PubMed] [Google Scholar]
- 18. Xiao Z, Dallas M, Qiu N, Nicolella D, Cao L, et al. (2011) Conditional deletion of Pkd1 in osteocytes disrupts skeletal mechanosensing in mice. FASEB J 25: 2418–2432. [DOI] [PMC free article] [PubMed] [Google Scholar]
- 19. Pavik I, Jaeger P, Kistler AD, Poster D, Krauer F, et al. (2011) Patients with autosomal dominant polycystic kidney disease have elevated fibroblast growth factor 23 levels and a renal leak of phosphate. Kidney Int 79: 234–240. [DOI] [PubMed] [Google Scholar]
- 20. Brasier JL, Henske EP (1997) Loss of the polycystic kidney disease (PKD1) region of chromosome 16p13 in renal cyst cells supports a loss-of-function model for cyst pathogenesis. J Clin Invest 99: 194–199. [DOI] [PMC free article] [PubMed] [Google Scholar]
- 21. Pei Y, Watnick T, He N, Wang K, Liang Y, et al. (1999) Somatic PKD2 mutations in individual kidney and liver cysts support a “two-hit” model of cystogenesis in type 2 autosomal dominant polycystic kidney disease. J Am Soc Nephrol 10: 1524–1529. [DOI] [PubMed] [Google Scholar]
- 22. Qian F, Watnick TJ, Onuchic LF, Germino GG (1996) The molecular basis of focal cyst formation in human autosomal dominant polycystic kidney disease type I. Cell. 87: 979–987. [DOI] [PubMed] [Google Scholar]
- 23. Wu G, D'Agati V, Cai Y, Markowitz G, Park JH, et al. (1998) Somatic inactivation of Pkd2 results in polycystic kidney disease. Cell 93: 177–188. [DOI] [PubMed] [Google Scholar]
- 24. Gallagher AR, Germino GG, Somlo S (2010) Molecular advances in autosomal dominant polycystic kidney disease. Adv Chronic Kidney Dis 17: 118–130. [DOI] [PMC free article] [PubMed] [Google Scholar]
- 25. Piontek KB, Huso DL, Grinberg A, Liu L, Bedja D, et al. (2004) A functional floxed allele of Pkd1 that can be conditionally inactivated in vivo. J Am Soc Nephrol 15: 3035–3043. [DOI] [PubMed] [Google Scholar]
- 26. Piontek K, Menezes LF, Garcia-Gonzalez MA, Huso DL, Germino GG (2007) A critical developmental switch defines the kinetics of kidney cyst formation after loss of Pkd1. Nat Med 13: 1490–1495. [DOI] [PMC free article] [PubMed] [Google Scholar]
- 27. Leuenroth SJ, Bencivenga N, Igarashi P, Somlo S, Crews CM (2008) Triptolide reduces cystogenesis in a model of ADPKD. J Am Soc Nephrol 19: 1659–1662. [DOI] [PMC free article] [PubMed] [Google Scholar]
- 28. Shillingford JM, Piontek KB, Germino GG, Weimbs T (2010) Rapamycin ameliorates PKD resulting from conditional inactivation of Pkd1. J Am Soc Nephrol 21: 489–497. [DOI] [PMC free article] [PubMed] [Google Scholar]
- 29. Zha L, Hou N, Wang J, Yang G, Gao Y, et al. (2008) Collagen1alpha1 promoter drives the expression of Cre recombinase in osteoblasts of transgenic mice. J Genet Genomics 35: 525–530. [DOI] [PubMed] [Google Scholar]
- 30. Lengner CJ, Steinman HA, Gagnon J, Smith TW, Henderson JE, et al. (2006) Osteoblast differentiation and skeletal development are regulated by Mdm2-p53 signaling. J Cell Biol 172: 909–921. [DOI] [PMC free article] [PubMed] [Google Scholar]
- 31. Liu F, Woitge HW, Braut A, Kronenberg MS, Lichtler AC, et al. (2004) Expression and activity of osteoblast-targeted Cre recombinase transgenes in murine skeletal tissues. Int J Dev Biol 48: 645–653. [DOI] [PubMed] [Google Scholar]
- 32. Dvorak-Ewell MM, Chen TH, Liang N, Garvey C, Liu B, et al. (2011) Osteoblast extracellular Ca2+ -sensing receptor regulates bone development, mineralization, and turnover. J Bone Miner Res 26: 2935–2947. [DOI] [PMC free article] [PubMed] [Google Scholar]
- 33. Kwan KM (2002) Conditional alleles in mice: practical considerations for tissue-specific knockouts. Genesis 32: 49–62. [DOI] [PubMed] [Google Scholar]
- 34. Xiao ZS, Hjelmeland AB, Quarles LD (2004) Selective deficiency of the “bone-related” Runx2-II unexpectedly preserves osteoblast-mediated skeletogenesis. J Biol Chem 279: 20307–20313. [DOI] [PubMed] [Google Scholar]
- 35. Deal C (2009) Future therapeutic targets in osteoporosis. Curr Opin Rheumatol 21: 380–385. [DOI] [PubMed] [Google Scholar]
- 36. Xiao Z, Zhang S, Magenheimer BS, Luo J, Quarles LD (2008) Polycystin-1 regulates skeletogenesis through stimulation of the osteoblast-specific transcription factor RUNX2-II. J Biol Chem 283: 12624–12634. [DOI] [PMC free article] [PubMed] [Google Scholar]
- 37. Caplan AI (1991) Mesenchymal stem cells. J Orthop Res 9: 641–650. [DOI] [PubMed] [Google Scholar]
- 38. Horster M, Huber S, Tschop J, Dittrich G, Braun G (1997) Epithelial nephrogenesis. Pflugers Arch 434: 647–660. [DOI] [PubMed] [Google Scholar]
- 39. Ahlgren U, Jonsson J, Edlund H (1996) The morphogenesis of the pancreatic mesenchyme is uncoupled from that of the pancreatic epithelium in IPF1/PDX1-deficient mice. Development 122: 1409–1416. [DOI] [PubMed] [Google Scholar]
- 40. Zong Y, Stanger BZ (2011) Molecular mechanisms of bile duct development. Int J Biochem Cell Biol 43: 257–264. [DOI] [PMC free article] [PubMed] [Google Scholar]
- 41. Yamaguchi T, Reif GA, Calvet JP, Wallace DP (2010) Sorafenib inhibits cAMP-dependent ERK activation, cell proliferation, and in vitro cyst growth of human ADPKD cyst epithelial cells. Am J Physiol Renal Physiol 299: F944–951. [DOI] [PMC free article] [PubMed] [Google Scholar]
- 42.Aguiari G, Bizzarri F, Bonon A, Mangolini A, Magri E, et al.. (2012) Polycystin-1 regulates amphiregulin expression through CREB and AP1 signalling: implications in ADPKD cell proliferation. J Mol Med (Berl). [DOI] [PMC free article] [PubMed]
- 43. Zhang S, Xiao Z, Luo J, He N, Mahlios J, et al. (2009) Dose-dependent effects of Runx2 on bone development. J Bone Miner Res 24: 1889–1904. [DOI] [PMC free article] [PubMed] [Google Scholar]
- 44. Nakashima K, Zhou X, Kunkel G, Zhang Z, Deng JM, et al. (2002) The novel zinc finger-containing transcription factor osterix is required for osteoblast differentiation and bone formation. Cell 108: 17–29. [DOI] [PubMed] [Google Scholar]
- 45. Hou B, Kolpakova-Hart E, Fukai N, Wu K, Olsen BR (2009) The polycystic kidney disease 1 (Pkd1) gene is required for the responses of osteochondroprogenitor cells to midpalatal suture expansion in mice. Bone 44: 1121–1133. [DOI] [PMC free article] [PubMed] [Google Scholar]
- 46. Jacob AL, Smith C, Partanen J, Ornitz DM (2006) Fibroblast growth factor receptor 1 signaling in the osteo-chondrogenic cell lineage regulates sequential steps of osteoblast maturation. Dev Biol 296: 315–328. [DOI] [PMC free article] [PubMed] [Google Scholar]
- 47.Owen M (1988) Marrow stromal stem cells. J Cell Sci Suppl 10: 63–76. [DOI] [PubMed]
- 48. Pittenger MF, Mackay AM, Beck SC, Jaiswal RK, Douglas R, et al. (1999) Multilineage potential of adult human mesenchymal stem cells. Science 284: 143–147. [DOI] [PubMed] [Google Scholar]
- 49. Rickard DJ, Kassem M, Hefferan TE, Sarkar G, Spelsberg TC, et al. (1996) Isolation and characterization of osteoblast precursor cells from human bone marrow. J Bone Miner Res 11: 312–324. [DOI] [PubMed] [Google Scholar]
- 50.Martin A DV, Li H, Dai B, Feng JQ, Quarles LD (2012) Overexpression of the DMP1 C-terminal Fragment Stimulates FGF23 and Exacerbates the Hypophosphatemic Rickets Phenotype in Hyp Mice. Mol Endocrinol: In press. [DOI] [PMC free article] [PubMed]
- 51. Guillaume R, D'Agati V, Daoust M, Trudel M (1999) Murine Pkd1 is a developmentally regulated gene from morula to adulthood: role in tissue condensation and patterning. Dev Dyn 214: 337–348. [DOI] [PubMed] [Google Scholar]
- 52. Torres VE, Harris PC, Pirson Y (2007) Autosomal dominant polycystic kidney disease. Lancet 369: 1287–1301. [DOI] [PubMed] [Google Scholar]
- 53. van Gulick JJ, Gevers TJ, van Keimpema L, Drenth JP (2011) Hepatic and renal manifestations in autosomal dominant polycystic kidney disease: a dichotomy of two ends of a spectrum. Neth J Med 69: 367–371. [PubMed] [Google Scholar]
- 54. Pirson Y (2010) Extrarenal manifestations of autosomal dominant polycystic kidney disease. Adv Chronic Kidney Dis 17: 173–180. [DOI] [PubMed] [Google Scholar]
- 55. Kaehny WD, Everson GT (1991) Extrarenal manifestations of autosomal dominant polycystic kidney disease. Semin Nephrol 11: 661–670. [PubMed] [Google Scholar]
- 56. Chauveau D, Fakhouri F, Grunfeld JP (2000) Liver involvement in autosomal-dominant polycystic kidney disease: therapeutic dilemma. J Am Soc Nephrol 11: 1767–1775. [DOI] [PubMed] [Google Scholar]
- 57. Hall BK, Miyake T (1992) The membranous skeleton: the role of cell condensations in vertebrate skeletogenesis. Anat Embryol (Berl) 186: 107–124. [DOI] [PubMed] [Google Scholar]
- 58. Horster MF, Braun GS, Huber SM (1999) Embryonic renal epithelia: induction, nephrogenesis, and cell differentiation. Physiol Rev 79: 1157–1191. [DOI] [PubMed] [Google Scholar]
- 59. Stuart RO, Bush KT, Nigam SK (2003) Changes in gene expression patterns in the ureteric bud and metanephric mesenchyme in models of kidney development. Kidney Int 64: 1997–2008. [DOI] [PubMed] [Google Scholar]
- 60. Tulachan SS, Doi R, Hirai Y, Kawaguchi Y, Koizumi M, et al. (2006) Mesenchymal epimorphin is important for pancreatic duct morphogenesis. Dev Growth Differ 48: 65–72. [DOI] [PubMed] [Google Scholar]
- 61. Hick AC, van Eyll JM, Cordi S, Forez C, Passante L, et al. (2009) Mechanism of primitive duct formation in the pancreas and submandibular glands: a role for SDF-1. BMC Dev Biol 9: 66. [DOI] [PMC free article] [PubMed] [Google Scholar]
- 62. Wescott MP, Rovira M, Reichert M, von Burstin J, Means A, et al. (2009) Pancreatic ductal morphogenesis and the Pdx1 homeodomain transcription factor. Mol Biol Cell 20: 4838–4844. [DOI] [PMC free article] [PubMed] [Google Scholar]
- 63. Torra R, Nicolau C, Badenas C, Navarro S, Perez L, et al. (1997) Ultrasonographic study of pancreatic cysts in autosomal dominant polycystic kidney disease. Clin Nephrol 47: 19–22. [PubMed] [Google Scholar]
- 64. Malka D, Hammel P, Vilgrain V, Flejou JF, Belghiti J, et al. (1998) Chronic obstructive pancreatitis due to a pancreatic cyst in a patient with autosomal dominant polycystic kidney disease. Gut 42: 131–134. [DOI] [PMC free article] [PubMed] [Google Scholar]
- 65. Liu Y (2004) Epithelial to mesenchymal transition in renal fibrogenesis: pathologic significance, molecular mechanism, and therapeutic intervention. J Am Soc Nephrol 15: 1–12. [DOI] [PubMed] [Google Scholar]
- 66. Iwano M, Plieth D, Danoff TM, Xue C, Okada H, et al. (2002) Evidence that fibroblasts derive from epithelium during tissue fibrosis. J Clin Invest 110: 341–350. [DOI] [PMC free article] [PubMed] [Google Scholar]
- 67. Okada H, Ban S, Nagao S, Takahashi H, Suzuki H, et al. (2000) Progressive renal fibrosis in murine polycystic kidney disease: an immunohistochemical observation. Kidney Int 58: 587–597. [DOI] [PubMed] [Google Scholar]
- 68. Togawa H, Nakanishi K, Mukaiyama H, Hama T, Shima Y, et al. (2011) Epithelial-to-mesenchymal transition in cyst lining epithelial cells in an orthologous PCK rat model of autosomal-recessive polycystic kidney disease. Am J Physiol Renal Physiol 300: F511–520. [DOI] [PubMed] [Google Scholar]
- 69. Chea SW, Lee KB (2009) TGF-beta mediated epithelial-mesenchymal transition in autosomal dominant polycystic kidney disease. Yonsei Med J 50: 105–111. [DOI] [PMC free article] [PubMed] [Google Scholar]
- 70. Zeier M, Fehrenbach P, Geberth S, Mohring K, Waldherr R, et al. (1992) Renal histology in polycystic kidney disease with incipient and advanced renal failure. Kidney Int 42: 1259–1265. [DOI] [PubMed] [Google Scholar]
- 71. Xiao Z, Awad HA, Liu S, Mahlios J, Zhang S, et al. (2005) Selective Runx2-II deficiency leads to low-turnover osteopenia in adult mice. Dev Biol 283: 345–356. [DOI] [PMC free article] [PubMed] [Google Scholar]
- 72. Glass DA 2nd, Bialek P, Ahn JD, Starbuck M, Patel MS, et al (2005) Canonical Wnt signaling in differentiated osteoblasts controls osteoclast differentiation. Dev Cell 8: 751–764. [DOI] [PubMed] [Google Scholar]
- 73.Xiao Y, Lv X, Cao G, Bian G, Duan J, et al.. (2009) Overexpression of Trpp5 contributes to cell proliferation and apoptosis probably through involving calcium homeostasis. Mol Cell Biochem. [DOI] [PubMed]
- 74. Borton AJ, Frederick JP, Datto MB, Wang XF, Weinstein RS (2001) The loss of Smad3 results in a lower rate of bone formation and osteopenia through dysregulation of osteoblast differentiation and apoptosis. J Bone Miner Res 16: 1754–1764. [DOI] [PubMed] [Google Scholar]