

Abstract
Objective:
Longitudinal studies of dementia rely on the assumption that individuals who drop out are comparable to those who remain in the study, adjusting for measured covariates. Existing methods to handle dropouts account for differences based on past health and cognitive measures. We assess whether such adjustments fully account for differences in future dementia risk.
Methods:
Among Three-City Study participants in Dijon, France, with 1 (n = 1,633) or 2 (n = 1,168) brain MRI scans, we tested whether white matter lesion volume (WMLV), hippocampal volume, or brain CSF volume predicted dropout (“unable to contact” or “refused interview”) in repeated-measures logistic regression with up to 4 follow-ups (average 3.5 waves). Using linear regression, we also estimated differences in MRI volumes and MRI changes by subsequent dropout status and estimated plausible ranges for selective attrition bias based on these associations. Models were adjusted for demographic, health, and cognitive score covariates.
Results:
Baseline greater WMLV predicted increased odds of dropping out (adjusted odds ratio = 1.71; 95% confidence interval [CI] 1.20−2.43). Among participants with 2 MRI scans, individuals who subsequently dropped out had significantly worse declines in hippocampal volume (−0.30 SD difference; 95% CI −0.43 to −0.17) between the first and second MRI scans.
Conclusions:
Higher future dementia risk, indicated by worse past brain MRI findings, predicted future study dropout. Adjustment for selective attrition, based on MRI markers when available, may help reduce bias in estimates of dementia incidence and improve research on dementia risk factors. MRI findings may also help prospectively identify cohort members at elevated risk of attrition.
Cognitive impairment strongly predicts dropout in longitudinal studies of aging.1,2 Longitudinal analyses may therefore differentially exclude cohort members with severe cognitive decline, although this is arguably the population of greatest interest for dementia research. Correctly accounting for such selective attrition might strengthen efforts to identify the effects of cardiometabolic, behavioral, or clinical factors on the incidence or progression of dementia.3 Statistical approaches that account for selective attrition using past measured characteristics, such as health and cognitive test scores, are therefore increasingly being adopted in longitudinal research.4–7 However, such adjustments are insufficient if future dementia risk differs for dropouts even after controlling for measured covariates.3 Specifically, inferences rest on the assumption that outcome values are missing at random, conditional on measured variables.3 Although past cognitive scores predict future performances, most cognitive measures have imperfect reliability and only moderate correspondence with underlying progression of Alzheimer or cerebrovascular disease.8–11 Cerebral MRI data are of special interest for attrition in studies of dementia because MRI markers of subclinical cerebrovascular changes or neurodegenerative disease correlate with future dementia risk over and above current neuropsychological test scores.12–17 However, few prior studies have examined whether such MRI findings predict dropout (see Note Added in Proof). If so, accounting for selective attrition as patterned by MRI findings could improve our ability to identify factors that increase dementia risk and help prospectively identify cohort members likely to drop out.
Using data from the Dijon cohort of the Three-City Study (3C), we tested the hypothesis that white matter lesion volume (WMLV), hippocampal volume, and brain CSF volume predict loss to follow-up in future assessments, independent of past covariates. We also assessed whether changes in WMLV, hippocampal volume, and CSF volume between the first and second MRI scans were worse for cohort members who subsequently dropped out of the study.
METHODS
Sample.
The 3C, a population-based prospective study of elderly individuals in Bordeaux, Montpellier, and Dijon, France, has been described in detail previously.18 We report here results from Dijon only. Participants (n = 4,931) were enrolled between January 1999 and March 2001 from a sample of noninstitutionalized individuals aged 65 years and older, randomly selected from city electoral rolls. Baseline interviews were conducted at home by trained psychologists. Follow-up interviews were conducted approximately 2, 4, 7, and 9 years after enrollment.
MRI scans were offered to participants aged ≤80 years, enrolled from April 1999 to July 2000 (funding precluded performing MRI scans for everyone); the MRI scan consent rate was 83%.
From 1,923 participants who completed baseline MRIs, we excluded from analyses participants with missing assessments of WMLV, hippocampal volume, or CSF volume(n = 123), participants who died before the year 2 interview (n = 18), participants with dementia at baseline (n = 4), or participants with missing data on baseline cognitive assessments or other covariates (n = 141). In all analyses, respondents were censored at death, so individuals who died after completing an MRI scan but before the next scheduled interview wave were excluded from analyses. These exclusions resulted in a final sample of 1,633 individuals available for analyses involving only baseline MRI scans. Our analytic sample is compared with the age-eligible 3C sample in table e-1 on the Neurology® Web site at www.neurology.org. For analyses involving data from the second MRI scan, we additionally excluded 377 individuals who dropped out in the first 2 follow-ups or did not complete the second MRI scan, 37 without valid brain volume findings at the second MRI scan, and 51 who died after the second MRI scan but before the year 7 interview wave, leaving 1,168 respondents for final analyses.
Standard protocol approvals, registrations, and patient consents.
The study protocol was approved by the Ethical Committee of the University Hospital of Kremlin-Bicêtre, and all subjects signed legal consent forms.
Dropout status.
At each wave, we categorized as a dropout any cohort member who was alive but could not be contacted or who was contacted but refused to participate in the interview.
MRI protocol.
The protocol for cranial MRI, using a 1.5-T Magnetom (Siemens, Erlangen, Germany), has been described in detail previously.19 Fully automatic image processing software was developed for tissue segmentation and to detect and quantify white matter lesions.19 WMLV was calculated by summing the volumes of all the lesions detected. Using voxel-based morphometry techniques, total intracranial volume (ICV) was computed by summing gray matter, white matter, and CSF volumes.
We considered 3 MRI biomarkers: WMLV, hippocampal volume, and CSF volume. Of the available MRI markers in 3C, we prioritized indicators that are commonly assessed with a standardized protocol in other studies, show a substantial variability in our sample, and have been implicated in the development of dementia and related cognitive outcomes.12–17 Each volume was divided by ICV at the concurrent MRI scan and multiplied by 100. Annualized rates of change in volumes were calculated as volume at the second MRI scan (as % of ICV) minus volume at the first MRI scan (as % of ICV) divided by years elapsed between the 2 MRI scans. All MRI measures were capped at the 1st and 99th percentile (i.e., values below or above these percentiles were recoded to the 1st or 99th percentile value) to reduce the influence of outliers (sensitivity analyses indicated that findings were not sensitive to this trimming). For analyses in which MRI findings were the dependent variable, they were converted to z scores by subtracting the mean value for that outcome (i.e., volume at baseline, volume at second MRI scan, or annualized rate of change in volume) and dividing by the SD.
Covariates.
Our goal was to assess whether MRI findings were independent predictors of dropout after adjustment for measured covariates. We considered 4 covariate sets, which we expected would have increasingly better explanatory power for dropout. Basic models were adjusted for demographics only: age, age squared, sex, educational attainment (assessed in 6 categories: none; primary school; middle school; technical or professional short degree; secondary level without diploma, technical or professional long degree; and baccalaureate and above) and assessment wave. Our second models were additionally adjusted for self-assessed indicators of health as reported at the most recent prior interview, including self-rated health (ordinal 1−5),20 elevated depressive symptoms (17+ on the Center for Epidemiologic Studies Depression scale21), and limitations in instrumental activities of daily living (IADLs), including using the phone, using public transportation, managing medications, and managing a budget (0−4)22 We next added baseline cognitive test scores: Isaacs' test of verbal/category fluency (ISAAC)23; the Benton Visual Retention Test (BVRT)24; Trail Making Test B (TMTB) expressed as seconds to task completion [maximum 300] divided by number of correct connections, capped at 35 [99th percentile])25; and the Mini-Mental State Examination (MMSE).11,26 Cognitive scores were z score−transformed using baseline mean and SD; we recoded extreme values more than 3 SDs above or below the mean to a z score of 3 (or −3). ISAAC, BVRT, and MMSE were assessed at all follow-up interviews (years 2, 4, 7, and 9); TMTB was not assessed at the year 2 follow-up. Our fourth set of covariates also included changes in test scores (for the ISAAC, BVRT, and MMSE only), defined as the raw difference between the 2 most recent prior z-scored test values (i.e., change from baseline to second interview to predict dropout at the third interview).
Analyses.
We used logistic regression to predict dropout at each of 4 follow-up waves, based on the 4 hierarchical covariate sets. First, we used each MRI finding one by one in the models; in the final model, we included the full covariate set and adjusted simultaneously for WMLV, hippocampal volume, and CSF volume. Models including change in cognitive scores as predictors were estimated in a smaller subset of observations because we could only calculate change scores for those with 2 prior cognitive assessments.
Respondents were censored at death or after their first dropout. Use of repeated observations on study participants maximized statistical power to detect associations between MRI findings and dropout risk, equivalent to discrete time hazard models. We repeated these models examining death, instead of dropout, as the outcome; estimates were very imprecise, however, due to limited statistical power (tables e-2 and e-3).
We also examined models using MRI findings as dependent variables, rather than predictors. With use of random intercept mixed models with either the first or second MRI volume (as % of ICV and expressed in z scores) as a dependent variable, we estimated the magnitude of difference in each MRI marker between respondents who dropped out and those who did not. For these analyses, we defined “dropout” as a binary variable indicating whether the cohort member participated in all interview waves for which he or she was alive after the respective MRI scan (i.e., ever dropped out to predict first MRI volumes and dropped out at year 7 or 9 interview to predict second MRI). Patterns in simple linear regression models using the first or second MRI scan separately were similar and are shown in figures e-1 and e-2). We also examined differences in MRI changes between the first and second MRI scans, using z-scored changes in MRI findings as dependent variables in linear regressions. For these models, we considered dropout at the year 7 or 9 interview as the predictor. We compared models for the first 3 covariate sets defined above. These analyses are unconventional because we use temporally later events (dropout) as independent variables to predict temporally prior measures (MRI volumes). The goal is to facilitate incorporation of our findings into sensitivity analyses for the magnitude of bias in other studies; these results should not be interpreted as estimating causal effects of dropout on MRI measures.
Selective attrition may bias estimated effects of risk factors on brain volume or related outcomes, such as dementia. To illustrate the potential impact of selective attrition on effect estimates, we modeled the expected bias in hypothetical studies of a risk factor on change in hippocampal volume under alternative assumptions. The magnitude of bias depends on the difference in brain volume between dropouts and those who remain in the study, the effect of the risk factor on dropout, and the difference in the risk-factor outcome association between dropouts and nondropouts. We also consider situations in which hippocampal volume is associated with dropout only among the exposed. Exact formulas for our estimates are provided in appendix e-1.
RESULTS
Average WMLV of the 1,633 subjects in the analytic sample was 0.39% (SD 0.32) of ICV (table 1). Average hippocampal volume was 0.49% (SD = 0.05) of ICV. Average CSF volume was 28.19% (SD = 3.12) of ICV.
Table 1.
Characteristics of the baseline 3-city MRI sample compared with dropouts at each wavea
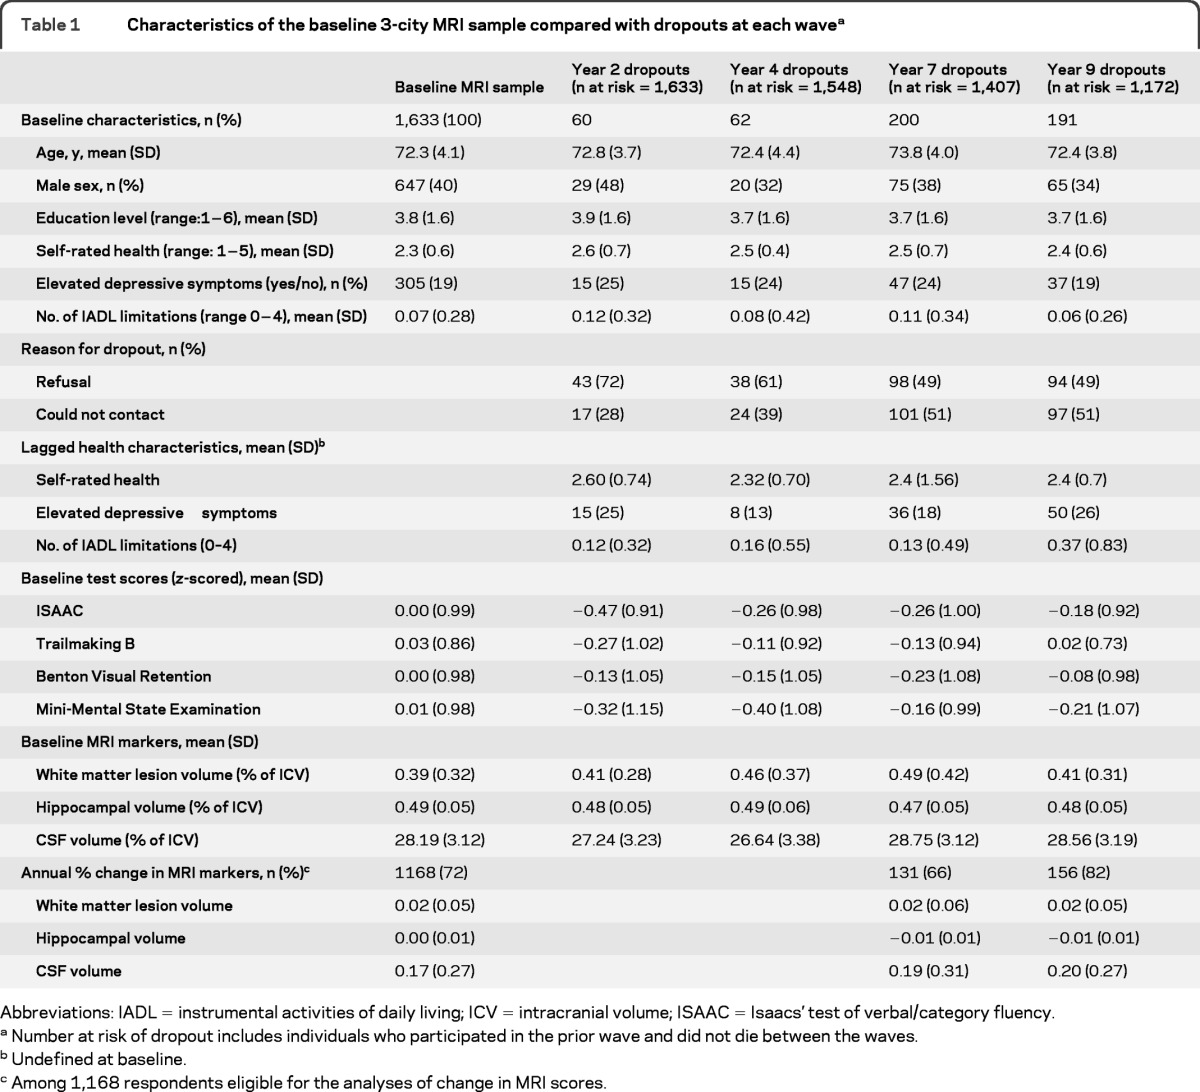
Abbreviations: IADL = instrumental activities of daily living; ICV = intracranial volume; ISAAC = Isaacs' test of verbal/category fluency.
Number at risk of dropout includes individuals who participated in the prior wave and did not die between the waves.
Undefined at baseline.
Among 1,168 respondents eligible for the analyses of change in MRI scores.
In models adjusted only for demographics, each percentage point increase in baseline WMLV (as % of ICV) was associated with 79% higher odds of dropout (table 2, M1; 95% confidence interval [CI] 1.38−2.32). Hippocampal volume was not significantly associated with higher odds of dropout, although the point estimate for the OR was consistent with larger hippocampal volume predicting lower odds of dropout (odds ratio [OR] = 0.14, 95% CI 0.01−1.32, p = 0.09). Greater CSF volume was unexpectedly associated with lower odds of dropout (OR = 0.95, 95% CI 0.92−0.99). Results changed little with additional adjustment for self-rated health, depressive symptoms, and IADL limitations (table 2, model 2) and baseline cognitive test scores (table 2, model 3).
Table 2.
Brain MRI markers and odds ratios for dropouta
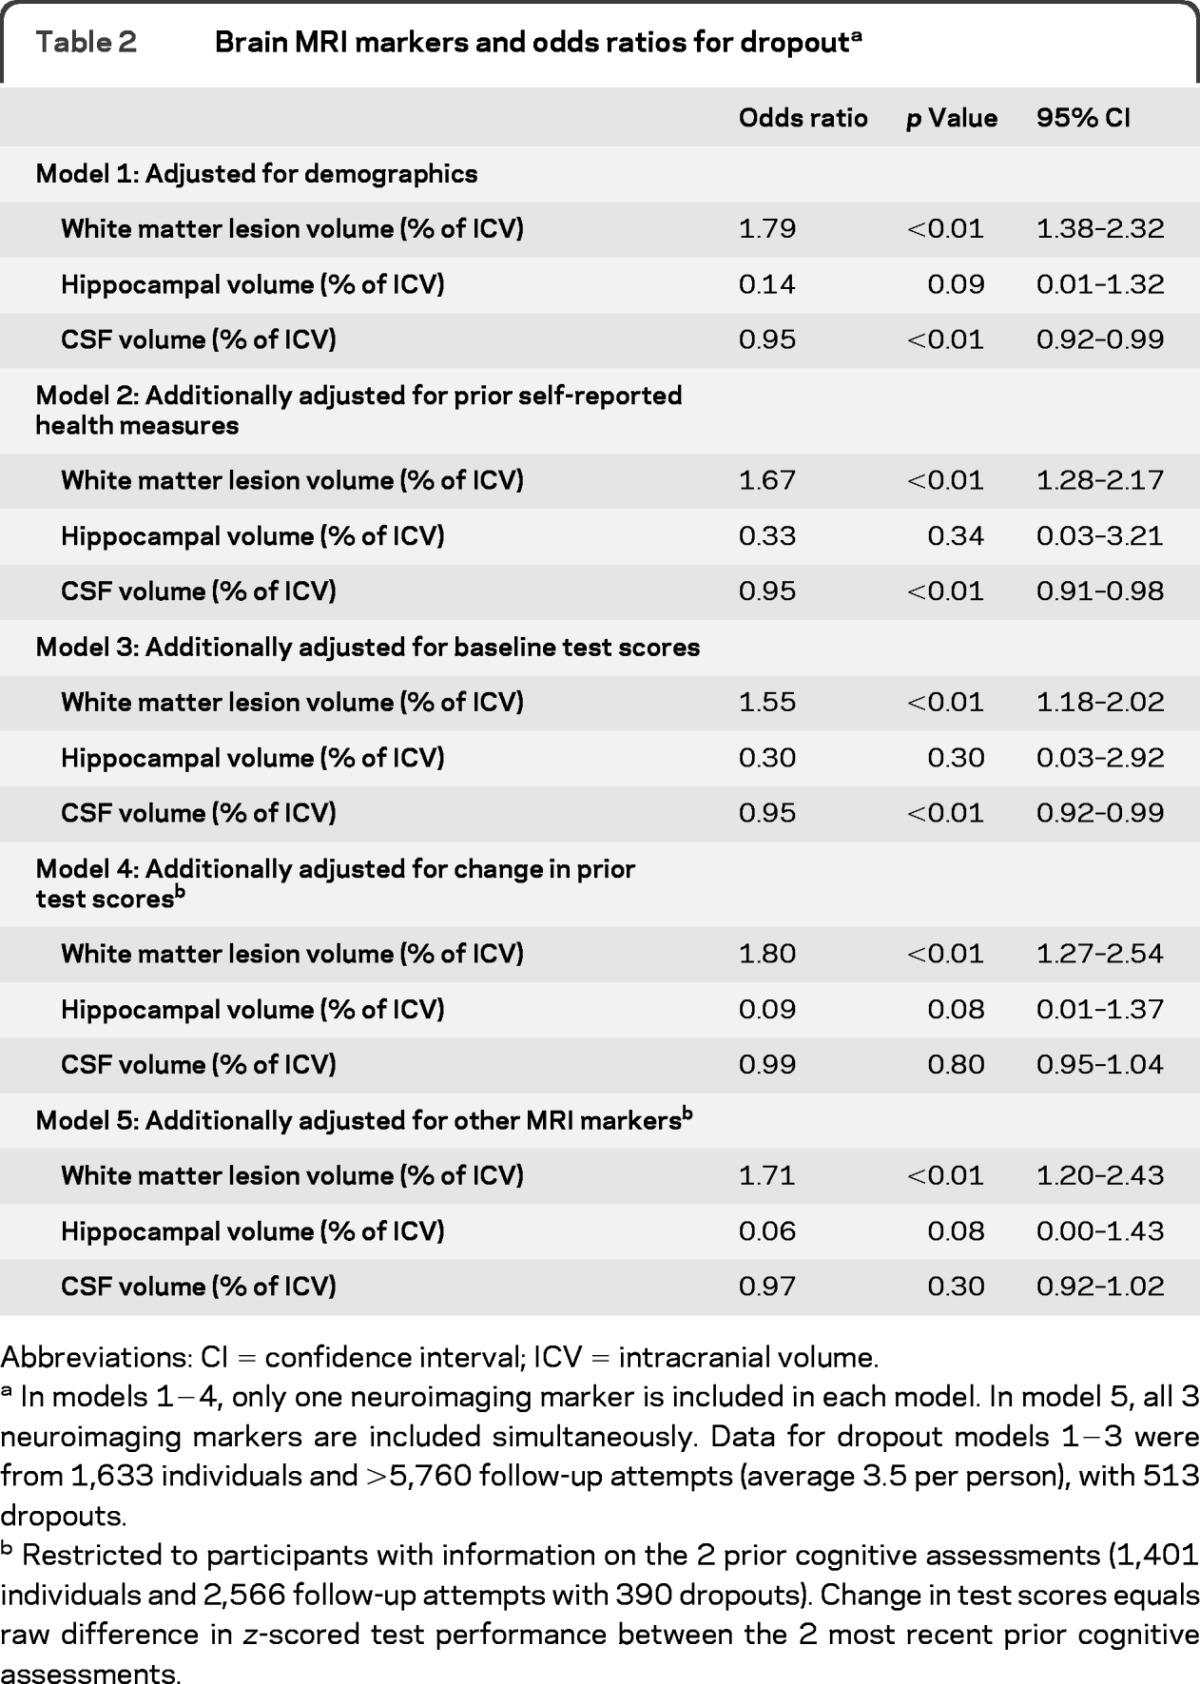
Abbreviations: CI = confidence interval; ICV = intracranial volume.
In models 1−4, only one neuroimaging marker is included in each model. In model 5, all 3 neuroimaging markers are included simultaneously. Data for dropout models 1−3 were from 1,633 individuals and >5,760 follow-up attempts (average 3.5 per person), with 513 dropouts.
Restricted to participants with information on the 2 prior cognitive assessments (1,401 individuals and 2,566 follow-up attempts with 390 dropouts). Change in test scores equals raw difference in z-scored test performance between the 2 most recent prior cognitive assessments.
Additional adjustment for the change in the most recent 2 prior cognitive test scores (table 2, model 4) required restriction of the sample to those who completed at least 2 cognitive assessments. In this slightly smaller sample, WMLV (OR = 1.81; 95% CI 1.29−2.54) and hippocampal volume (OR = 0.06; 95% CI <0.01−0.87) but not CSF volume (p = 0.80) were associated with dropout. In the final model, including WMLV, hippocampal volume, and CSF volume simultaneously in the model, results changed little. Patterns expressing cerebral MRI marker values as quartiles were also similar (table-e 2).
Consistent with the prior models, WMLV was significantly larger (adjusted b = 0.18 SD; 95% CI 0.08−0.29) and hippocampal volume was significantly smaller (adjusted b = −0.12 SD; 95% CI −0.22 to −0.03) among dropouts (figure 1). CSF volume was not significantly different among future dropouts.
Figure 1. Pooled estimates of differences in MRI markers, by subsequent dropout status.

Coefficients are from random intercept mixed models with first or second MRI values on dropout status, with dropout defined as unable to contact or refusal at any interview. All MRI values are % of intracranial volume and normalized so effects are expressed in SDs (n = 1633; observations = 2,801). Model [M] 1, adjusted for demographics only; M2, additionally adjusted for baseline self-reported health measures; M3, additionally adjusted for baseline cognitive test scores.
Next, we examined whether individuals who dropped out in the last 2 interview waves, after completing both MRI scans, had experienced worse deterioration between the 2 MRI scans (figure 2). Dropouts did not significantly differ with respect to increase in WMLV. Those who subsequently dropped out had experienced significantly worse deterioration in hippocampal volume between the first and second MRI scans, with a change 0.30 SD (95% CI −0.43 to −0.17) worse than the change experienced by nondropouts (after covariate adjustment). Increases in CSF were also significantly greater for dropouts than for nondropouts: there was a 0.14 SD (95% CI 0.01−0.28) difference, adjusted for demographics. Additional adjustment for self-rated health, elevated depressive symptoms, and baseline cognitive test scores modestly attenuated the CSF difference to 0.10 SD (95% CI −0.04 to 0.23) and the association was no longer statistically significant.
Figure 2. Annualized rate of change in MRI markers, by subsequent dropout status.

Coefficients are from linear regression models of annualized rate of change in MRI volumes on dropout status, with dropout defined as unable to contact or refusal at the 7- or 9-year interviews (which occurred after the second MRI scan). Annualized rate of change in MRI is defined as % of intracranial volume (ICV) at the second MRI scan minus % of ICV at the first MRI, divided by years elapsed between the MRIs and normalized (n = 1,168). Model [M] 1, adjusted for demographics only; M2, additionally adjusted for baseline self-reported health measures; M3, additionally adjusted for baseline cognitive test scores.
In a hypothetical study with a moderate dropout of 20%, a ratio of dropout in the exposed to dropout in the unexposed of 1.2, and a difference in hippocampal volume between dropouts and nondropouts of 0.2 SD, attrition bias is quite small (table 3, top panel). However, the bias increases with higher dropout, stronger associations between the risk factor and dropout, and greater differences in hippocampal volume between dropouts and nondropouts. If the association between hippocampal volume and dropout risk differs by level of exposure, effect estimates are biased even in the most optimistic situation (table 3, bottom panel). In the most extreme examples (the rightmost columns of table 3, bottom panel), the bias is so large that a risk factor associated with smaller hippocampal volume appears to be associated with larger hippocampal volume in analyses of nondropouts.
Table 3.
Bias in a hypothetical study of the effect of risk factor on hippocampal volume, under alternative assumptions about dropouta
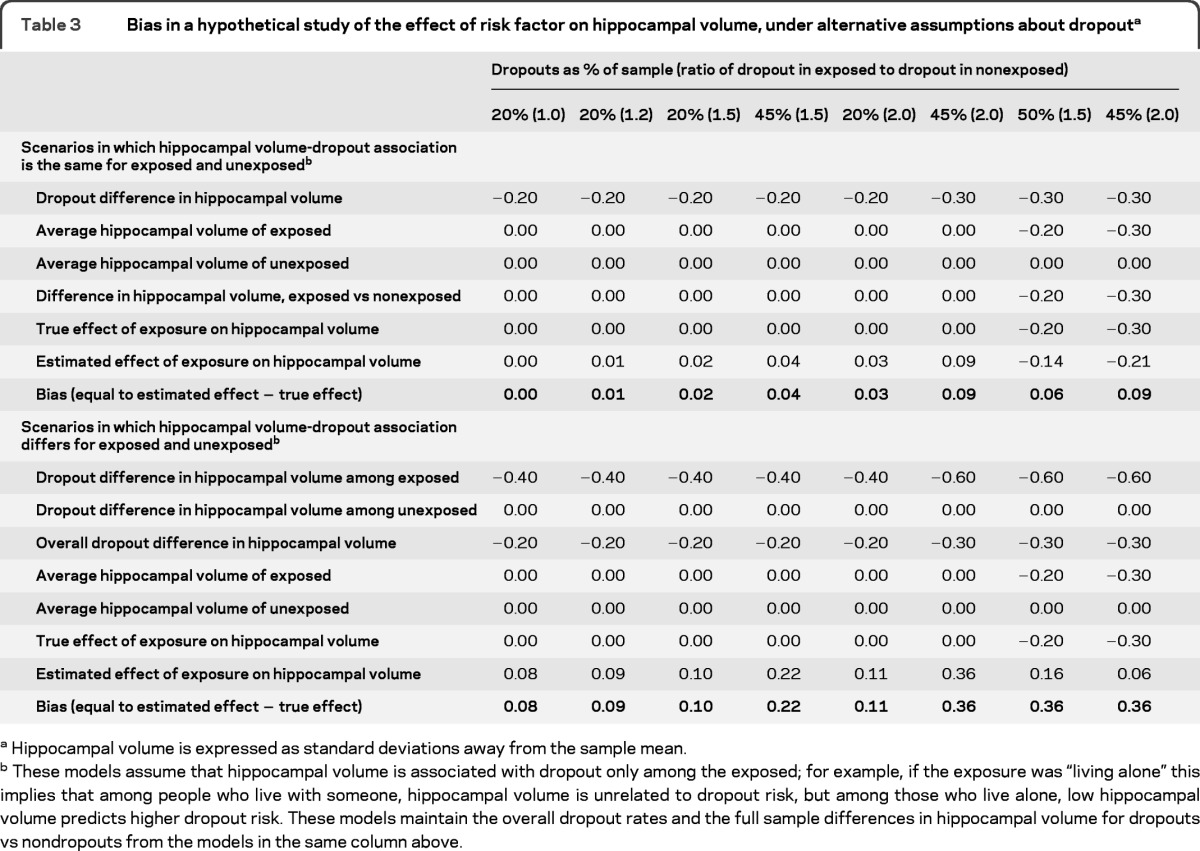
Hippocampal volume is expressed as standard deviations away from the sample mean.
These models assume that hippocampal volume is associated with dropout only among the exposed; for example, if the exposure was “living alone” this implies that among people who live with someone, hippocampal volume is unrelated to dropout risk, but among those who live alone, low hippocampal volume predicts higher dropout risk. These models maintain the overall dropout rates and the full sample differences in hippocampal volume for dropouts vs nondropouts from the models in the same column above.
DISCUSSION
Individuals who dropped out of this elderly French cohort study had evidence of higher WMLV and lower hippocampal volume compared with those who did not drop out. There was mixed evidence with respect to the association between baseline CSF and subsequent dropout. Furthermore, those who dropped out had a history of greater decreases in hippocampal volume and greater increases in CSF compared with those who did not drop out, suggesting substantial differences in underlying cerebrovascular or neurodegenerative disease. These associations were attenuated but not eliminated by adjustment for demographics, self-rated health, elevated depressive symptoms, IADL limitations, and prior cognitive test scores.
Missing data on a variable are considered missing at random if the values for the variable are unrelated to whether it is missing or observed, conditional on (i.e., adjusted for) observed values of that or any other measured characteristics of the individual. In contrast, data are missing not at random if the value of the variable systematically differs among those for whom it is unobserved, even conditional on the observed characteristics of that person.3 If data are missing at random and the process that leads to missingness is unrelated to the process determining the outcome, conventional mixed model−based analyses of the data will produce unbiased effect estimates.27 Our results suggest that this is unlikely to be the case for studies of dementia or cognitive decline.
This finding has 3 critical implications for research on dementia or cognitive aging. First, consistent with previous evidence,28–30 attrition bias compromises generalizability and results in underestimates of the prevalence of dementia in analyses without correction for dropout. Second, estimates of the effect of any hypothesized risk factor on dementia could be substantially biased in cohort studies with moderate to high dropout. Cohort attrition rates of 10%−40% are common in aging cohorts with demanding cognitive or physical assessments.31 If the risk factor under consideration directly affects dropout, the bias may either spuriously attenuate or inflate the estimated association between the risk factor and cognitive decline.32 Many studies do not report whether dropout differs by the primary exposure, but important differences have sometimes been reported33 and probably prevail in many other studies. Effect estimates of scientific or clinical interest are often not much larger than plausible biases due to attrition. In studies with neuroimaging markers, it may be possible to address potential bias from selective dropout using methods such as inverse probability weighting, principal stratification, multiple imputation, or other statistical tools.4,27,34–37 The approach of Wang and Hall27 of using information on an “auxiliary variable” correlated with the unobserved outcome values might be useful. However, most longitudinal studies of cognitive aging do not include MRIs, and even when MRIs are planned, they are typically not available for all or even a representative sample of cohort members. Imputations or sensitivity analyses based on external evidence from studies with MRIs may be valuable to help inform analyses even when MRI measures are not available. For example, we report declines in hippocampal volume approximately 0.3 SD worse among the dropouts compared with those for individuals who did not drop out. If similar associations are established in other cohorts, this finding should inform estimated values of cognitive scores for individuals lost to follow-up. Changes in MRI markers do not perfectly predict future dementia risk, however, so an important future research avenue is to estimate the correspondence between test performance changes and MRI changes.
Finally, our results suggest the possibility of using MRI findings to facilitate follow-up efforts in ongoing cohort studies and reduce attrition. Existing sources of information on dropout risk may be enhanced by incorporating information from MRI scans, when available. The association between MRI markers and attrition is presumably mediated by cognitive skills that facilitate study participation and understanding this process may suggest opportunities to remediate barriers. For example, individuals with incipient memory impairment may be less likely to remember the appointment or to avoid making competing commitments that would preclude participating in the interviews.
Our study has some limitations, including potential generalizability of the 3C sample and possible selection into the MRI sample. CIs for most estimates were wide, so lack of statistical significance does not necessarily imply absence of important associations. Adjustment for a more comprehensive set of background measures might have better accounted for loss to follow-up. Finally, our study had inadequate power to address differential mortality, which could exacerbate dropout bias.4,38–40
We show that dropout is associated with MRI measures of brain features that are likely to influence future dementia risk. As a result, estimates of the effects of risk factors on dementia risk may be biased. If these findings are confirmed in other samples, incorporation of adjustments for selective dropout may substantially improve our ability to identify causal determinants of the onset and trajectory of dementia.
Supplementary Material
GLOSSARY
- BVRT
Benton Visual Retention Test
- CI
confidence interval
- IADL
instrumental activities of daily living
- ICV
intracranial volume
- ISAAC
Isaacs' test of verbal/category fluency
- MMSE
Mini-Mental State Examination
- OR
odds ratio
- TMTB
Trail Making Test B
- WMLV
white matter lesion volume
Footnotes
Supplemental data at www.neurology.org
NOTE ADDED IN PROOF
Since this paper was accepted for publication, a new article was published in Neurology® that is relevant.41
AUTHOR CONTRIBUTIONS
M. Maria Glymour designed the study, conducted the statistical analysis, interpreted the results, and prepared the first draft of the manuscript. Geneviève Chêne assisted with interpretation of the results, proposed supplemental analyses, and revised the manuscript. Christophe Tzourio assisted with interpretation of the results and revised the manuscript. Carole Dufouil helped formulate the analysis plan, interpret the results, and revise the manuscript.
DISCLOSURE
M.M. Glymour has received funding from the following sources in the past 2 years: NIH, American Heart Association, Milton Fund for Harvard Faculty, and the Robert Wood Johnson Foundation. Dr. Glymour serves on the editorial advisory board of Epidemiology and on the advisory board for MRC Centre for Causal Analyses in Translational Epidemiology and receives/has received research support from the NIH, the Robert Wood Johnson Foundation Health & Society Scholars Program, the MacArthur Foundation Network on SES and Health, the Milton Fund for Harvard University Junior Faculty, and the American Heart Association. In the past 2 years, G. Chêne has had scientific responsibilities in projects receiving specific grant support from the French Agency for Research on AIDS and Viral Hepatitis (ANRS), the European Commission (Framework Program 7), UK Medical Research Council, NIH, Fondation Plan Alzheimer, Gilead, Tibotec, Boehringer Ingelheim, GlaxoSmithKline, Roche, Pfizer, Merck, Abbott, Bristol-Myers Squibb, Janssen, and ViiV Healthcare. These grants are managed through her institution or a non-profit society. Dr. Chêne serves as an academic editor of Plos ONE and is on the editorial boards of the Open Infectious Diseases Journal, Open AIDS Journal, and BMC Infectious Diseases. C. Tzourio has received funding from the Fondation Plan Alzheimer. He has served on scientific advisory boards for Merck Sharp and Dohme and Fondation Plan Alzheimer; has received speaker honoraria from Abbott and Fondation Recherche HTA; serves on the editorial advisory boards of Neuroepidemiology, Journal of Hypertension, and Journal of Alzheimer's Disease; and has received research support from Agence Nationale de la Recherche and Fondation Plan Alzheimer for the Three-City Study. C. Dufouil has received funding from the Fondation Plan Alzheimer and provided statistical consulting to the EISAI company. She serves as an Associate Editor for the Journal of Alzheimer's Disease. Go to Neurology.org for full disclosures.
REFERENCES
- 1. Chatfield MD, Brayne CE, Matthews FE. A systematic literature review of attrition between waves in longitudinal studies in the elderly shows a consistent pattern of dropout between differing studies. J Clin Epidemiol 2005; 58: 13–19 [DOI] [PubMed] [Google Scholar]
- 2. Vega S, Benito-León J, Bermejo-Pareja F, et al. Several factors influenced attrition in a population-based elderly cohort: neurological disorders in Central Spain Study. J Clin Epidemiol 2010; 63: 215–222 [DOI] [PubMed] [Google Scholar]
- 3. Little RJ, Rubin DB. Statistical Analysis with Missing Data, 2nd ed. Hoboken, NJ: Wiley; 2002 [Google Scholar]
- 4. Dufouil C, Brayne C, Clayton D. Analysis of longitudinal studies with death and drop-out: a case study. Stat Med 2004; 23: 2215–2226 [DOI] [PubMed] [Google Scholar]
- 5. Weuve J, Tchetgen Tchetgen E, Glymour MM, et al. Accounting for bias due to selective attrition in analyses of cognitive decline: the example of smoking and cognitive decline in older adults. Epidemiology 2012; 23: 119–128 [DOI] [PMC free article] [PubMed] [Google Scholar]
- 6. Glymour MM, Weuve J, Fay ME, Glass TA, Berkman LF. Social ties and cognitive recovery after stroke: does social integration promote cognitive resilience? Neuroepidemiology 2008; 31: 10–20 [DOI] [PMC free article] [PubMed] [Google Scholar]
- 7. Singh Manoux A, Marmot MG, Glymour M, Sabia S, Kivimäki M, Dugravot A. Does cognitive reserve shape cognitive decline? Ann Neurol 2011; 70: 296–304 [DOI] [PMC free article] [PubMed] [Google Scholar]
- 8. Morris MC, Evans DAMD, Hebert LE, Bienias JL. Methodological issues in the study of cognitive decline. Am J Epidemiol 1999; 149: 789–793 [DOI] [PubMed] [Google Scholar]
- 9. Dufouil C, Alperovitch A, Tzourio C. Influence of education on the relationship between white matter lesions and cognition. Neurology 2003; 60: 831–836 [DOI] [PubMed] [Google Scholar]
- 10. Manly JJ, Jacobs DM, Sano M, et al. Effect of literacy on neuropsychological test performance in nondemented, education-matched elders. J Int Neuropsychol Soc 1999; 5: 191–202 [DOI] [PubMed] [Google Scholar]
- 11. Lezak MD. Neuropsychological Assessment, 3rd ed. New York: Oxford University Press; 1995 [Google Scholar]
- 12. Dufouil C, Godin O, Chalmers J, et al. Severe cerebral white matter hyperintensities predict severe cognitive decline in patients with cerebrovascular disease history. Stroke 2009; 40: 2219–2221 [DOI] [PubMed] [Google Scholar]
- 13. Godin O, Tzourio C, Rouaud O, et al. Joint effect of white matter lesions and hippocampal volumes on severity of cognitive decline: the 3C-Dijon MRI study. J Alzheimers Disease 2010; 20: 453–463 [DOI] [PubMed] [Google Scholar]
- 14. Gunning-Dixon FM, Raz N. The cognitive correlates of white matter abnormalities in normal aging: a quantitative review. Neuropsychology 2000; 14: 224–232 [DOI] [PubMed] [Google Scholar]
- 15. Kramer JH, Mungas D, Reed BR, et al. Longitudinal MRI and cognitive change in healthy elderly. Neuropsychology 2007; 21: 412–418 [DOI] [PMC free article] [PubMed] [Google Scholar]
- 16. Debette S, Markus H. The clinical importance of white matter hyperintensities on brain magnetic resonance imaging: systematic review and meta-analysis. BMJ 2010; 341: c3666. [DOI] [PMC free article] [PubMed] [Google Scholar]
- 17. Jack C, Jr, Shiung M, Gunter J, et al. Comparison of different MRI brain atrophy rate measures with clinical disease progression in AD. Neurology 2004; 62: 591–600 [DOI] [PMC free article] [PubMed] [Google Scholar]
- 18. 3C Study Group Vascular factors and risk of dementia: design of the Three-City Study and baseline characteristics of the study population. Neuroepidemiology 2003; 22: 316–325 [DOI] [PubMed] [Google Scholar]
- 19. Maillard P, Delcroix N, Crivello F, et al. An automated procedure for the assessment of white matter hyperintensities by multispectral (T1, T2, PD) MRI and an evaluation of its between-centre reproducibility based on two large community databases Neuroradiology 2008; 50: 31–42 [DOI] [PubMed] [Google Scholar]
- 20. Montlahuc C, Soumare A, Dufouil C, et al. Self-rated health and risk of incident dementia. Neurology 2011; 77: 1457–1464 [DOI] [PubMed] [Google Scholar]
- 21. Radloff LS. The Ces-D scale. Appl Psychol Meas 1977; 1: 385–401 [Google Scholar]
- 22. Lawton MP, Brody EM. Assessment of older people: self-maintaining and instrumental activities of daily living. Gerontologist 1969; 9: 179–186 [PubMed] [Google Scholar]
- 23. Isaacs B, Kennie A. The Set test as an aid to the detection of dementia in old people. Br J Psychiatry 1973; 123: 467–470 [DOI] [PubMed] [Google Scholar]
- 24. Benton A. Manuel Pour l'Application du Test de Rétention Visuelle, 2nd ed. Paris: Centre de Psychologie Appliquée; 1965 [Google Scholar]
- 25. Reitan R. Validity of the Trail Making Test as an indicator of organic brain damage. Percept Mot Skills 1958; 8: 271–276 [Google Scholar]
- 26. Folstein MF, Folstein SE, McHugh PR. “Mini-mental state”: a practical method for grading the cognitive state of patients for the clinician J Psychiatr Res 1975; 12: 189–198 [DOI] [PubMed] [Google Scholar]
- 27. Wang C, Hall CB. Correction of bias from non-random missing longitudinal data using auxiliary information. Stat Med 2010; 29: 671–679 [DOI] [PMC free article] [PubMed] [Google Scholar]
- 28. Tyas SL, Tate RB, Wooldrage K, Manfreda J, Strain LA. Estimating the incidence of dementia: the impact of adjusting for subject attrition using health care utilization data. Ann Epidemiol 2006; 16: 477–484 [DOI] [PubMed] [Google Scholar]
- 29. Brayne C, Spiegelhalter DJ, Dufouil C, et al. Estimating the true extent of cognitive decline in the old old. J Am Geriatr Soc 1999; 47: 1283–1288 [DOI] [PubMed] [Google Scholar]
- 30. Euser SM, Schram MT, Hofman A, Westendorp RGJ, Breteler M. Measuring cognitive function with age: the influence of selection by health and survival. Epidemiology 2008; 19: 440–447 [DOI] [PubMed] [Google Scholar]
- 31. Jagust W, Harvey D, Mungas D, Haan M. Central obesity and the aging brain. Arch Neurol 2005; 62: 1545. [DOI] [PubMed] [Google Scholar]
- 32. Hernán MA, Hernandez-Diaz S, Robins JM. A structural approach to selection bias. Epidemiology 2004; 15: 615–625 [DOI] [PubMed] [Google Scholar]
- 33. Debette S, Seshadri S, Beiser A, et al. Midlife vascular risk factor exposure accelerates structural brain aging and cognitive decline. Neurology 2011; 77: 461–468 [DOI] [PMC free article] [PubMed] [Google Scholar]
- 34. Robins JM, Finkelstein DM. Correcting for noncompliance and dependent censoring in an AIDS clinical trial with inverse probability of censoring weighted (IPCW) log-rank tests. Biometrics 2000; 56: 779–788 [DOI] [PubMed] [Google Scholar]
- 35. Robins JM, Rotnitzky A. Semiparametric efficiency in multivariate regression-models with missing data. J Am Stat Assoc 1995; 90: 122–129 [Google Scholar]
- 36. Frangakis CE, Rubin DB. Principal stratification in causal inference. Biometrics 2002; 58: 21–29 [DOI] [PMC free article] [PubMed] [Google Scholar]
- 37. Zhang JL, Rubin DB. Estimation of causal effects via principal stratification when some outcomes are truncated by “death.” J Educ Behav Stat 2003; 28: 353 [Google Scholar]
- 38. Pavlik VN, de Moraes SA, Szklo M, Knopman DS, Mosley TH, Hyman PJ. Relation between cognitive function and mortality in middle-aged adults: the Atherosclerosis Risk in Communities Study. Am J Epidemiol 2003; 157: 327–334 [DOI] [PubMed] [Google Scholar]
- 39. Nybo H, Petersen HC, Gaist D, et al. Predictors of mortality in 2,249 nonagenarians: the Danish 1905-Cohort Survey. J Am Geriatr Soc 2003; 51: 1365–1373 [DOI] [PubMed] [Google Scholar]
- 40. Bassuk SS, Wypij D, Berkman LF. Cognitive impairment and mortality in the community-dwelling elderly. Am J Epidemiol 2000; 151: 676–688 [DOI] [PubMed] [Google Scholar]
- 41. Lo RY, Jagust WJ. Predicting missing biomarker data in a longitudinal study of Alzheimer disease. Neurology 2012; 78: 1376–1382 [DOI] [PMC free article] [PubMed] [Google Scholar]
Associated Data
This section collects any data citations, data availability statements, or supplementary materials included in this article.