

Abstract
Objective
The ability to perceive facial emotion varies with age. Relative to younger adults (YA), older adults (OA) are less accurate at identifying fear, anger, and sadness, and more accurate at identifying disgust. Because different emotions are conveyed by different parts of the face, changes in visual scanning patterns may account for age-related variability. We investigated the relation between scanning patterns and recognition of facial emotions. Additionally, as frontal-lobe changes with age may affect scanning patterns and emotion recognition, we examined correlations between scanning parameters and performance on executive function tests.
Methods
We recorded eye movements from 16 OA (mean age 68.9) and 16 YA (mean age 19.2) while they categorized facial expressions and non-face control images (landscapes), and administered standard tests of executive function.
Results
OA were less accurate than YA at identifying fear (p<.05, r=.44) and more accurate at identifying disgust (p<.05, r=.39). OA fixated less than YA on the top half of the face for disgust, fearful, happy, neutral, and sad faces (p’s<.05, r’s≥.38), whereas there was no group difference for landscapes. For OA, executive function was correlated with recognition of sad expressions and with scanning patterns for fearful, sad, and surprised expressions.
Conclusion
We report significant age-related differences in visual scanning that are specific to faces. The observed relation between scanning patterns and executive function supports the hypothesis that frontal-lobe changes with age may underlie some changes in emotion recognition.
Keywords: Aging, Emotion Recognition, Visual Scanning, Executive Function, Frontal Lobes
Introduction
Changes in facial emotion recognition that are known to occur with age may directly affect older adults’ social interactions, which may result in withdrawal from social contact (Isaacowitz, Charles, & Carstensen, 2000; Palmore, 1981) or depression (Adams & Moon, 2009). Several studies have shown that older adults are worse than younger adults at identifying facial emotions (anger, fear, and sadness) (Calder et al., 2003; Phillips, Maclean, & Allen, 2002; Suzuki, Hoshino, Takahiro, Shigemasu, & Kawamura, 2007; Wong, Cronin-Golomb, & Neargarder, 2005). Disgust is distinctive in being one emotion that older adults identify with better accuracy than do younger adults (Calder et al., 2003; Suzuki et al., 2007; Wong et al., 2005); although some studies did not find this advantage (Phillips et al., 2002; Orgeta, 2010; Sullivan, Ruffman, & Hutton, 2007). Inconsistencies in the results may have resulted from differences in the characteristics of the generally small samples (e.g., age, depression levels) and limited data points. A meta-analysis of 28 studies of aging and emotion recognition showed that anger and sadness were the most difficult for older adults to identify, whereas they were more accurate than younger adults at recognizing disgust (Ruffman, Henry, Livingstone, & Phillips, 2008).
Functional and anatomical changes in the brain associated with age may contribute to differences in emotion recognition between younger and older adults. For example, in an fMRI study of emotion recognition, Gunning-Dixon and colleagues (2003) reported that older adults, who were slower and less accurate at identifying facial affect than younger adults, did not engage the right amygdala and surrounding regions as did the younger group, and showed less overall involvement of the limbic areas and greater activation of the anterior cingulate cortex. These neural differences may contribute to older adults’ relative deficiency in fear recognition, which appears to rely heavily on the amygdala (Murphy, Nimmo-Smith, & Lawrence, 2003).
In regard to structural changes, the medial frontal lobe, bilateral insula, and thalamus have been found to show significant age-related volume losses (Takahashi, Ishii, Kakigi, & Yokoyama, 2011), and aging effects have also been reported in posterior dorsolateral and ventrolateral prefrontal cortex, ventromedial frontal cortex, and anterior cingulate cortex (Petit-Taboue, Landeau, Desson, Desgranges, & Baron, 1998), structures that are thought to support the processing of facial emotions (Adolphs, 2002a; Grimm et al., 2006; Phillips, Drevets, Rauch, & Lane, 2003). Notably, there is also evidence of age-related differences in neural structures associated with visual attention (Madden et al., 2007). Because visual attention contributes strongly to emotion recognition, changes in visual attention processes that are associated with age may lead to age-related differences in emotion recognition (Wong et al., 2005).
Although important, investigations of neural changes and visual attention to date appear to be insufficient to explain all age-related differences in emotion recognition. We do not yet have a clear understanding of what accounts for the increased accuracy of the recognition of disgust in older adults, or why the recognition of certain emotions (e.g., happiness) is relatively preserved with aging. One under-examined aspect of visual attention—visual scanning patterns—has been related to the detection of emotion, and may explain both deficiencies in and preservation of some aspects of emotion recognition (Wong et al., 2005). The neural network that controls voluntary eye movements involves several structures, including the frontal eye fields (FEF) (Barton, 2001; Petit, Clark, Ingeholm, & Haxby, 1997). This region, part of the frontal lobes, is implicated in the control of visual attention and in mediating spatial organization of exploration with the head and eyes (Mesulam, 1985). Eye movements have been related to emotion interpretation in studies of autism and Asperger syndrome (Harms, Martin, & Wallace, 2010; Kliemann, Dziobek, Hatri, Steimke, & Heekeren, 2010). Visual scanning patterns of faces have also been shown to differ between older and younger adults both topographically and in the nature of scanning and fixating (e.g., increased sampling with more transitions in older adults) (Firestone, Turk-Browne, & Ryan, 2007; Wong et al., 2005).
Researchers studying healthy adults have proposed that visual scanning is strongly influenced by the nature of the task (for review see Henderson, 2003). For example, scanning patterns can differ substantially depending on whether the viewer is engaged in free viewing, memorizing aspects of the image, or examining the emotional connection between individuals in the image (Henderson, Weeks, & Hollingworth, 1999; Land & Hayhoe, 2001; Yarbus, 1967). Such findings have been interpreted to suggest that visual scanning is strongly controlled by top-down cognitive processes, including executive function. There is also evidence that emotional perception abnormalities in older adults may stem from reductions in cognitive capacity, specifically in executive function (Phillips, Scott, Henry, Mowat, & Bell, 2010). Consequently, a key issue to be addressed is to determine whether age-related changes in emotion perception are related to executive function impairments, visual scanning abnormalities, or a combination of both.
Few studies have examined the possible implications of age-related changes in visual scanning for facial emotion processing. Our initial study found a correlation between visual scanning patterns and emotion recognition accuracy in younger and older adults (Wong et al., 2005). We found that older adults, relative to younger adults, made proportionately fewer fixations to the top than to the bottom half of faces. This finding was relevant to emotion recognition because accurate identification of fear, anger, and sadness from facial expressions relies on examination of the upper half of faces, in particular the eyes; happiness and surprise are identifiable from either the top or bottom half of the face; and disgust is most identifiable from the bottom half of the face (Calder, Keane, Young, & Dean, 2000). We found that the relatively poor performance of older than younger adults on anger, fear, and sadness was correlated with a smaller proportion of fixations to the top of the face, whereas their superior recognition of disgust correlated with a greater proportion of fixations to the lower half of the face. In a second study, Sullivan et al., (2007) showed that older adults were less accurate at recognizing emotions that are most easily identified from the eyes, and they spent proportionately less time looking at the eyes than did younger adults. In this study looking at the eyes correlated with emotion recognition accuracy but only in the young adult group.
While both studies provided information about visual scanning patterns and emotional faces, they were limited in two important ways. First, they did not investigate visual scanning patterns of images other than emotional faces to determine if changes were specific to emotion recognition or were the result of a more global change in visual scanning patterns. Second, there were no independent measures of frontal-lobe function, such as tasks of executive function that may support emotion recognition (Adolphs, 2002a; Adolphs, 2002b; Phillips et al., 2003) and that may be related to changes in brain regions controlling eye movements (Barton, 2001).
In the present study, we had two main goals. The first was to examine the specificity of age-related changes in visual scanning patterns to emotional faces. While a number of studies have been conducted to examine the contribution of visual scanning behaviors to emotion recognition abilities in older adults, none have employed a suitable control task, making it difficult to ascertain whether the observed changes in scanning behaviors in older adults contribute specifically to emotion perception abnormalities or whether these changes would be observed for all image types. To help resolve this issue, the present study examined visual scanning behaviors during both a facial emotion recognition task and a non-emotional categorization test with comparable task requirements, the properties of which were established in a previous study (Clark, Neargarder, & Cronin-Golomb, 2008). We introduced a control task of landscape images. Landscapes were chosen because they provided a sufficient number of image categories, and, like faces, they are mono-oriented and are composed of several smaller elements that can be individually assessed and integrated when categorizing the image. We hypothesized that age-related differences in visual scanning would not appear across different types of images but rather would be specific to emotional faces. Our second goal was to investigate the relation of frontal-mediated processes to facial emotion recognition and visual scanning of emotional faces. We addressed this goal by assessing performance on cognitive tests of executive function. Our hypothesis was that performance on tests of executive function would correlate with emotion recognition and scanning patterns.
Methods
Participants
Participants included 16 younger adults (YA) (ages 18–21; mean age 19.2, S.D. 1.0; 5 men and 11 women) and 16 older adults (OA) (ages 62–79; mean age 68.9, S.D. 6.0; 7 men and 9 women) who were recruited from the community. All participants had at least 20/40 corrected near acuity. All were native speakers of English, were not on any psychoactive medications, and had finished at least 12 years of formal education. OA had significantly more years of education than YA, as YA were in the midst of their college education (t[18.8]=4.2, p=.001). Education was included as a covariate in analyses as appropriate. Exclusion criteria included loss of consciousness lasting longer than 10 minutes, any traumatic head injury, any psychiatric or neurological illness, eye disease, or history of substance abuse. They were screened for depression with the Beck Depression Inventory II (BDI; cut-off 13) (Beck, Steer, & Brown, 1996) and for anxiety with the Beck Anxiety Inventory (BAI; cut-off 15) (Beck, Epstein, Brown, & Steer, 1988). The groups did not differ on these measures (BDI: t[30]=.356, p=.73; BAI: t[30]=.549, p=.59). To screen for dementia in OA, the Mini-Mental State Exam (MMSE) (Folstein, Folstein, & McHugh, 1975) was administered. All participants scored at 27/30 or above indicating absence of dementia. All OA were right handed. Two YA were left-handed; the rest were right-handed. Participant characteristics appear in Table 1.
Table 1.
Participant Characteristics
| OA (M/F = 7/9) |
YA (M/F = 5/11) |
|||
|---|---|---|---|---|
| Variable | M | SD | M | SD |
| Age (years)*** | 68.9 | 6.0 | 19.2 | 1.0 |
| Education (years)** | 16.4 | 2.2 | 13.9 | 0.8 |
| Beck Depression Inventory (/63) | 4.2 | 3.6 | 3.7 | 3.6 |
| Beck Anxiety Inventory (/63) | 2.8 | 3.3 | 3.6 | 4.3 |
| Mini-Mental State Exam (/30)* | 28.9 | 0.8 | n/a | n/a |
Note: OA = Older adults; M/F = Male/Female; YA= Younger adults; M = Mean, SD = Standard deviation.
Asterisks indicate that the groups’ means are significantly different at the p<.05 (*), p<.01 (**) or p<.001 (***) level.
The Boston University Institutional Review Board approved the study, and all participants provided written informed consent.
Procedures
Screening
The following assessments ensured that participants had no difficulty with understanding the labels for facial emotion or landscapes used in the main protocol, no difficulty with face discrimination in general, and no abnormalities in basic oculomotor function.
Definition Matching
Participants were given a written task that asked them to match the seven emotion categories (Happy, Sad, Anger, Surprise, Fear, Disgust, and Neutral) and seven landscape categories (Canyon, City, Mountain, Shore, Tropical, Town, and Forest) to their definitions. All participants showed 100% accuracy.
Facial Discrimination Task
The 13-item (short) version of the Benton Test of Facial Recognition (Benton, Sivan, Hamsher, Varney, & Spreen, 1994) was administered to all participants to evaluate their ability to recognize and discriminate unfamiliar faces. This task presents participants with target photographs of unfamiliar faces and requires that they identify images of the target in a group of six photographs that have been taken from different angles or under different lighting conditions. No time limit was placed on responses. Scores were recorded as number correct. OA and YA did not differ significantly on their ability to perform this task (OA mean score: 23.1, SD 1.9; YA mean score: 23.7, SD 1.3; t[28]=1.02, p=.32).
Oculomotor Function
A prosaccade task (reflexive saccade) and an antisaccade task (voluntary saccade) provided measures of oculomotor function and ability to inhibit reflexive saccadic responses, respectively (Olk & Kingstone, 2003). These tasks were identical to those used by Wong et al. (2005) and Clark, Neargarder, and Cronin-Golomb (2010). Each task consisted of black crosses, black rectangles, and black rectangles with an “x” inside them on a white screen. For the prosaccade task, participants were instructed to look toward a target, which appeared either to the left or right of the center. For the antisaccade task, they were instructed to look in the direction opposite the target. Each task included 20 trials and lasted approximately 60 seconds. The groups did not differ on the prosaccade task in percent accuracy (t[28]=.695, p>.05; OA mean: 98.3% correct, SD: 2.5; YA mean: 99.0 % correct, SD: 2.9). YA performed significantly better on the antisaccade task than did OA (t[28]=2.9, p<.01, OA mean: 84.3% correct, SD: 9.4; YA mean: 94.0% correct, SD: 8.1), as expected (Nieuwenhuis, Ridderinkhof, de Jong, Kok, & van der Molen, 2000). Accuracy on neither the prosaccade nor the antisaccade task correlated significantly with accuracy on the emotion recognition task or visual scanning patterns in either group and hence are not discussed further.
Testing
The following experiments were administered in a randomized order across participants. Each individual completed them in one or two testing sessions within one week.
Experiment 1: Emotion and Landscape Identification
The purpose of this experiment was to measure the accuracy of visual recognition of emotion and landscape categories. The behavioral data were compared for the two groups and correlated with visual scanning patterns and neuropsychological measures. Performance on this task was used to estimate participants’ emotion recognition abilities, rather than accuracy rates for recognition of the images included in the eye-tracking experiment (below), as the number of images in this set is larger (10/emotion versus 2/emotion) and provides a better measure of emotion recognition proficiency. The tests were identical to those described in Clark et al. (2008).
Emotion Identification
The participant sat 45 cm away from the screen while viewing black and white photographs of faces. The photographs were drawn from the Ekman & Friesen (1976) Pictures of Facial Affect database. All images were reliably recognized within each emotional category, and were cropped so that only the facial regions were shown. Facial images ranged between 17.1 and 20.3 cm high and measured between 12.5 and 15.0 cm wide. These images subtended a vertical visual angle of 20.8–24.2° and a horizontal visual angle of 15.6–18.3°. Ten faces (5 male and 5 female) were presented for each of the following emotion categories: Anger, Disgust, Fear, Happy, Neutral, Sad, and Surprise. The seven emotion labels were shown below each image, and participants responded by stating the emotion that they felt best fit the image. The experimenter recorded responses, and no feedback was given on the accuracy of these responses. There was no time limit. The order of images was randomized for each participant through use of SuperLab software (Version 1.75; Cedrus Corporation, San Pedro, CA).
Landscape Identification
Landscape recognition was included as a control to examine identification and visual scanning of non-facial, non-emotional stimuli. The protocol was identical to that of emotion identification except for use of landscape images instead of faces. Participants viewed 70 black and white landscapes, 10 for each category: Canyon, City, Forest, Mountain, Shore, Town, and Tropical. Landscape images ranged between 13.7 and 21.4cm high and measured between 13.4 and 21.5cm wide. These images subtended a vertical visual angle of 16.7–25.6° and a horizontal visual angle of 16.7–25.6°. Images from this database were matched on a one-to-one basis, according to recognizability and difficulty levels, to images used in the emotion task (Clark et al., 2008).
Experiment 2: Visual Scanning While Viewing Emotional Faces and Landscapes
The goal of this experiment was to record participants’ eye movements while they visually scanned and categorized facial emotional expressions and landscape images. Images were prepared as in Experiment 1 in regard to such features as sizing and cropping. Eye movements were recorded using the Arrington Research Eye Tracking System (Scottsdale, AZ), which consists of an infrared camera attached to an adjustable stand and software developed to record eye movement (Viewpoint Version 2.11). Our methods were identical to those described by Wong et al. (2005) and Clark et al. (2010). The system had a sampling rate of 30 Hz. A Macintosh G4 Desktop Computer was used to run the software. Recordings were from the left eye of each participant. Calibration was established by presenting nine points on the 17-inch (43.18-cm) computer screen.
Facial Emotional Expressions
Fourteen black-and-white photographs, different from those used in the categorization task, were drawn from the Ekman and Friesen (1976) Pictures of Facial Affect database. Two (1 male, 1 female) images were selected from each of the seven expression categories: Angry, Disgust, Fear, Happy, Neutral, Sad and Surprise.
Landscapes
Fourteen black-and-white photographs, different from those used in the categorization task, were taken from a database of landscape images. Two images were selected from each of the following seven categories: Canyon, City, Forest, Mountain, Shore, Town and Tropical.
Eye Movement Recording
The participant sat 45 cm from the screen with the head secured in a chin rest with a forehead bar. Facial and landscape image sets were presented separately. The order of sets (emotional faces, landscapes) was counterbalanced and the images within the sets were randomized across participants. Images were presented one at a time, each for 8s, in one of four randomized orders (Wong et al., 2005). Images were preceded by a central cross that participants fixated on to control for initial fixation location. Participants were asked to examine the image, as they would look at any photograph, and to decide which category best described the image. Images were followed by a screen displaying the seven emotion or landscape category labels presented for 7s. Participants fixated on the label that they thought best described the image and were verbally queried in cases of ambiguous responses. Responses were recorded manually by the experimenter. To familiarize participants with the task, facial and landscape image sets were each preceded by a practice image, not included in the set of 14 study images, and labels presented for 10s.
Eye movements and fixations were recorded continuously throughout each trial. We limited the amount of data that was analyzed to include that portion of the viewing trial that was most relevant to the decision making process. We calculated the OA and YA groups’ average response times during the emotion categorization and landscape categorization tasks. For the facial emotion categorization task, we found that the OA group’s average response time was 4.16 s (SD = 1.17) and the YA group’s average response time was 3.77 s (SD = 0.66). For the landscape categorization task, the OA group’s average response time was 4.28 s (SD = 1.24) and the YA group’s average response time was 3.66 s (SD = 0.81). We used the OA group’s longest mean reaction time (4.3 s) to determine our cutoff point, as this allowed us to examine the maximum possible time in which the average OA would have made their decision, and thereby omitted extraneous viewing patterns, while retaining the greatest amount of data for analysis. Accordingly, we decided to analyze only the first 4.3 s of the eye tracking data.
Fixations were defined as instances when the x-y coordinates were stable within 1° of visual angle (Loughland, Williams, & Gordon, 2002; Maltz & Shinar, 1999; Williams, Loughland, Gordon, & Davidson, 1999) for at least 50 ms (Dalton et al., 2005; Underwood, Foulsham, van Loon, Humphreys, & Bloyce, 2006). In determining the topographical location of fixations, top and bottom facial regions were defined by a horizontal line across the bridge of the nose. Top regions included the forehead, eyebrows, eyes, and top of the nose, and bottom regions included the nostrils, mouth, and chin. The landscape images were divided into two halves by the horizontal midline.
For each image, we extracted five parameters: (1) Total number of fixations, (2) Total fixation duration (over the total viewing time examined), (3) Mean fixation duration (i.e., mean duration of all fixations made), (4) Number of fixations made to the top versus the bottom regions of the image, (5) Amount of time fixating in the top versus the bottom regions. We determined the number of fixations made to the top and the bottom regions of images and calculated a difference score by subtracting the number of fixations made to the bottom half of the image from those made to the top half of the image. Similar calculations were made to determine the amount of time spent fixating in the top and the bottom regions of the image. Positive numbers indicated a greater number of fixations, or fixation duration, in the top regions of the image. For every participant, we calculated a mean for each of the five visual scanning parameters for each emotional category, which was the average of the fixation patterns made to the two faces for that emotion. As per Clark et al. (2010), for each of the five scanning parameters we calculated a mean that combined all 14 landscape images, which allowed us to obtain a general measure of eye movements in response to non-facial image perception.
Neutral-relative scanning variables
For the faces, we compared scanning patterns for those expressing emotion with those that were emotionally neutral for each group. We examined proportions as follows: total number of fixations on each emotion relative to the number of fixations on neutral faces; total fixation duration for each emotion relative to total fixation duration on neutral faces, and mean fixation duration for each emotion relative to the mean fixation duration on neutral. To compare the top/bottom difference scores for emotional faces to neutral we calculated a difference score of the difference scores, where we subtracted the top/bottom difference score for neutral faces from top/bottom difference score for each emotion, which preserves information with respect to top/bottom preferences in that positive scores indicated a greater proportion of fixations in the top regions versus the bottom regions of a given emotional image than that of neutral images, and negative scores indicated a lesser proportion of fixations to the top regions versus the bottom regions than that of neutral images.
Experiment 3: Neuropsychological Measures of Executive Function
The aim of this experiment was to correlate executive functioning with visual scanning patterns and emotion identification. Visual scanning is partially driven by cognitive processes associated with the demands of the task in a top-down manner (Henderson, Weeks, & Hollingworth, 1999; Land & Hayhoe, 2001; Yarbus, 1967) that may relate to frontal-lobe function. We predicted that scores on tests of frontal-lobe executive function would correlate with visual scanning patterns and accuracy on emotion recognition tasks. We used raw scores for both tasks.
Trail Making Tests A and B (Reitan & Wolfson, 1993)
These tests were administered as per Spreen & Strauss (1998). Trails A requires participants to connect numbers 1 through 25, which are randomly distributed on the page, as quickly as possible. Trails B requires participants to alternate connecting between numbers and letters (1, A, 2, B, etc.) from 1 through 13. Completion times were measured in seconds; lower scores indicate better performance. Our analysis focused on Part B because of its demands on frontal-lobe abilities (Moll, de Oliveira-Souza, Moll, Bramati, & Andreiuolo, 2002; Zakzanis, Mraz, & Graham, 2005). It has been shown that the dorsolateral prefrontal cortex (DLPFC) is activated during Trails B, in addition to the precentral gyrus, cingulate gyrus, and medial frontal gyrus (Moll et al., 2002; Zakzanis et al., 2005). The DLPFC is believed to support executive functions that are drawn upon for emotion identification such as problem-solving, retrieval, organization, concept formation, and working memory.
Stroop Color and Word Test (Golden, 1979)
This test consisted of three conditions of 45 seconds each. The Word condition requires participants to read aloud a list of the names of colors printed in black ink. In the Color condition, participants name the color of ink in which XXXX is printed. In the Color-Word (Interference) condition, participants are asked to name the incongruent color of ink the words are printed in. The interference condition has been shown to require activation of frontal-lobe circuits (Bruck et al., 2001; Rinne et al., 2000). On a modified version of the Stroop task, increased reaction times have been correlated with increased anterior cingulate cortex (ACC) activation (MacDonald, Cohen, Stenger, & Carter, 2000). The ACC has been implicated in a variety of emotional processing tasks (Bishop, Duncan, Brett, & Lawrence, 2004; Bush, Luu, & Posner, 2000; Vuilleumier, Armony, Driver, & Dolan, 2001), and in cognitive processing that may support emotion recognition and decision-making, such as conflict monitoring (Milham & Banich, 2005), resolving conflicts when performing two tasks simultaneously (Dreher & Grafman, 2003), and monitoring errors (Kiehl, Liddle, & Hopfinger, 2000; Van Veen & Carter, 2002). For these reasons, we focused our analysis on the interference scores, and expected to see a relation between these scores and emotion identification as well as visual scanning patterns.
Data Analysis
To compare group performance on the recognition tasks and on the visual scanning parameters, we used repeated measures ANOVAs followed by post hoc analyses when appropriate. In the correlational analyses we used Pearson correlations and adjusted alpha to account for the multiple comparisons made within each experiment. For correlations between emotion recognition accuracy scores and visual scanning patterns, we used a Bonferroni correction (alpha = .05/3 = .017) for the three scanning variables that described fixation characteristics (i.e., total number of fixations, total fixation duration, mean fixation duration), as well as for the two variables that described the topographical characteristics of scanning patterns (number of fixations made to top versus bottom, amount of time fixating in top versus bottom; alpha = .05/2 = .025). For correlations involving the two executive function measures, alpha was reduced to .025. Only those analyses resulting in significant correlations are reported.
Outliers were determined for each group separately for accuracy rates on the facial emotion and landscape categorization tasks, as well as the visual scanning parameters (e.g., total number of fixations, total fixation duration) by calculating the mean +/− two times the standard deviation. We removed all values that were outside of this range. This resulted in a 3.4% reduction of data across groups. Before analyzing visual scanning data, each image file (faces and landscapes) was reviewed for tracking accuracy. The image files that were inaccurate (indicating that either the participant moved while viewing the image or that mechanical difficulties were experienced during data collection) were deleted from the analyses. This process resulted in the deletion of 10.0 % of the OA group’s data and 15.0% of the YA group’s data.
Results
Experiment 1: Emotion and Landscape Identification
To compare the groups on emotion recognition abilities, we used a mixed design ANOVA with factors of group (OA, YA), and emotion (seven emotional categories including neutral). There was a main effect of emotion (F[6,132]=12.0, p<.001), as some emotions were more difficult to identify than others across both groups, consistent with previous reports (Russell, 1994). There was no main effect of group (F[1,22]=.417, p=.525). There was an interaction between group and emotion (F[6,132]=3.3, p<.01). Education did not contribute significantly to the model when entered as a covariate (p=.35) and was therefore removed from the final model. Post-hoc t-tests revealed that relative to YA, OA performed more poorly on fear recognition (t[24.6]=2.4, p<.05, r=.44) and better on disgust recognition (t[29]=2.3, p<.05, r=.39) (Figure 1). There were no differences in accuracy for any of the other emotions. The superior accuracy of the OA than YA group on disgust was not an artifact of OA perseverating on “disgust” as a response to non-disgust faces. Error rates did not differ for the OA and YA groups, with 18.4% of all OA errors and 19.0% of all YA errors resulting from incorrectly labeling other facial images as “disgust.” See Table 2 for error rates by category. Within the OA group, there was a positive correlation between age and performance on disgust (r=.65, p<.01). The older the participants in the OA group were, the better they performed on disgust. There were no other significant correlations between age and accuracy in OA.
Figure 1.

Mean (± standard error of the mean) percentage of facial expression images that were correctly identified by each group.
OA= Older adults; YA= Younger adults. Asterisks indicate that the groups’ means are significantly different at the p < .05 level (*).
Table 2.
Percent of Misclassification Errors Made for Each Emotion by Group
| Anger | Disgust | Fear | Neutral | Happy | Surprise | Sad | All Expressions |
|||||||||
|---|---|---|---|---|---|---|---|---|---|---|---|---|---|---|---|---|
| Misclassification Error: |
OA | YA | OA | YA | OA | YA | OA | YA | OA | YA | OA | YA | OA | YA | OA | YA |
| Anger | - | - | 84.00 | 100.00 | 11.11 | 0 | 30.43 | 47.83 | n/a | 0 | 0 | 0 | 18.52 | 6.25 | 23.31 | 35.91 |
| Disgust | 40.74 | 30.43 | - | - | 6.67 | 11.54 | 30.43 | 34.78 | n/a | 0 | 25.00 | 0 | 18.52 | 56.25 | 18.40 | 19.01 |
| Fear | 22.22 | 21.74 | 0 | 0 | - | - | 0.00 | 0.00 | n/a | 0 | 37.50 | 92.86 | 22.22 | 12.50 | 11.04 | 14.08 |
| Neutral | 14.81 | 8.70 | 0 | 0 | 0 | 0 | - | - | n/a | 100.00 | 6.25 | 0 | 37.04 | 25.00 | 9.20 | 4.93 |
| Happy | 0 | 0 | 0 | 0 | 6.67 | 0 | 0 | 0 | - | - | 31.25 | 7.14 | 0 | 0 | 4.91 | 0.70 |
| Surprise | 7.41 | 8.70 | 4.00 | 0 | 64.44 | 76.92 | 4.35 | 4.35 | n/a | 0 | - | - | 37.00 | 0 | 20.86 | 16.20 |
| Sad | 14.81 | 30.43 | 12.00 | 0 | 11.11 | 11.54 | 34.78 | 13.04 | n/a | 0 | 0 | 0 | - | - | 12.27 | 9.15 |
Note: OA = Older adults; YA= Younger adults;
n/a indicates that no errors were made in categorizing this emotion
Results of the repeated measures ANOVA comparing the two groups on their ability to categorize non-emotional landscape images revealed no significant group differences (main effect of group: F[1,21]=1.3, p=.26; main effect of landscape: F[3.6,75]=8.6, p<.001; group by landscape category interaction: F[3.6,75]=1.1, p=.38). OA and YA recognition rates for each landscape category are displayed in Table 3.
Table 3.
Percent Recognition for Landscape Image Categories in Each Group
| OA | YA | |||
|---|---|---|---|---|
| Landscape | M | SD | M | SD |
| Canyon | 86.0 | 12.4 | 93.3 | 8.2 |
| City | 83.1 | 13.0 | 83.1 | 17.0 |
| Forest | 100.0 | 0.0 | 100.0 | 0.0 |
| Mountain | 94.0 | 5.1 | 91.3 | 9.2 |
| Shore | 90.0 | 10.9 | 85.3 | 13.0 |
| Tropical | 94.7 | 9.2 | 88.7 | 19.2 |
| Town | 78.0 | 14.7 | 74.3 | 13.4 |
| All landscapes | 88.2 | 4.2 | 85.8 | 6.2 |
Note: OA = Older adults; YA= Younger adults; M = Mean, SD = Standard deviation.
To address the question of potential gender differences in emotion recognition (Hall, Carter, & Horgan, 2000; McClure, 2000; Hoffmann, Kessler, Eppel, Rukavina, & Traue, 2010), we conducted independent samples t-tests to compare men and women on recognition accuracy for each emotion, for the OA and YA groups separately. There were no gender differences seen in either group, except for sadness recognition in the YA group, where women were significantly worse at identifying sad facial expressions than men (t[13]=2.4, p<.05). These results should be considered preliminary in light of the sample sizes and the fact that addressing the question of gender difference in our OA and YA groups was not a primary aim of the study.
Experiment 2: Visual Scanning While Viewing Emotional Faces and Landscapes
Our previous study had suggested that OA would look proportionately longer at and make more fixations to the bottom half of the face than the top half as compared to YA (Wong et al., 2005), which was confirmed by our results here: When comparing groups on number of top/bottom fixations, we found a significant main effect of group (F[1,16]=9.0, p<.01), as well as a main effect of emotion category (F[6,96]=3.1, p<.01). There was no emotion category by group interaction (F[6,96]=.525, p=.79). To more closely examine the main effect of group, we conducted post-hoc tests that revealed that OA made a higher proportion of fixations to the bottom than to the top half of faces for expressions of disgust (t[28]=2.2, p<.05, r=.38), fear (t[23]=2.2, p<.05, r=.42), happy (t[28]=2.9, p=.01, r=.48), and neutral (t[25]=2.9, p=.01, r=.50) (Figure 2). There was also a main effect of group when looking at top/bottom fixation duration (F[1,19]=8.8, p<.01). Post-hoc tests showed that compared to YA, OA spent a significantly smaller proportion of time fixating on the top half of the face than the bottom for disgust (t[29]=2.2, p<.05, r=.38), neutral (t[25]=2.5, p<.05, r=.45), and sad expressions (t[27]=2.3, p<.05, r=.40) (Figure 3). Both groups still preferred the top of the face, but this preference was weaker in the OA group. There were no group differences on top/bottom scanning patterns for landscapes: number of top/bottom fixations (t[28] = −1.27, p=.21), top/bottom fixation duration (t[29]= −.50, p=.62). There were no significant group differences on emotional faces or landscapes for total number of fixations, total fixation duration, or mean fixation duration (all p’s>.05). We conducted correlations for each group to determine if any aspect of visual scanning related to accuracy on the emotion recognition task, for each emotion separately. There were no significant correlations for facial expressions for either group.
Figure 2.

Mean difference scores (± standard error of the mean) for the number of fixations made to the top vs. bottom for each facial emotion category. Positive values indicate that more fixations were made to the top half of the face and negative values indicate that more fixations were made to the bottom half.
OA= Older adults, YA= Younger adults. Asterisks indicate that the groups’ means are significantly different at the p < .05 (*) and p ≤ .01 level (**).
Figure 3.

Mean difference scores (± standard error of the mean) for the total duration (ms) of fixations made to the top vs. bottom for each facial emotion category. Positive values indicate that more time was spent fixating on the top half of the face.
OA= Older adults, YA= Younger adults. Asterisks indicate that the groups’ means are significantly different at the p < .05 (*) level.
Neutral-relative scanning variables
Because group differences were observed for number of top/bottom fixations and top/bottom fixation duration on neutral images, any differences we might see between OA and YA when comparing these variables on each emotion relative to neutral could not be attributed to the emotion alone. Therefore, neutral-relative variables for these scanning parameters were not compared across groups. Comparing OA and YA on the neutral-relative variable for total fixation duration across all emotions, we found a main effect of group (F[1,20]=4.52, p=.05). There was no main effect of emotion category (F[5,100]=.70, p=.63) or group by emotion interaction (F[5,100]=1.13, p=.35). To investigate the specificity of the group effect, post-hoc comparisons were conducted revealing that the group result was driven most strongly by findings for disgust (t[24]=2.89, p<.01) (Figure 4). OA spent less time fixating on disgust than neutral and YA spent more time fixating on disgust than neutral as indicated by their mean neutral-relative proportions (OA =0.97, YA =1.03). Across groups, total fixation duration for disgust relative to neutral correlated negatively with disgust accuracy (r=−.48, p=.01). This indicated that less time spent fixating on disgust images relative to neutral (i.e., more scanning) was associated with better disgust recognition in OA and YA; when looking at OA alone (with reduced power due to smaller sample size) this correlation was at the level of a trend (OA: r=−.37, one-tailed p=.10). No additional neutral-relative scanning parameters (total number of fixations, mean fixation duration) were associated with differences between OA and YA (all p’s >.05).
Figure 4.
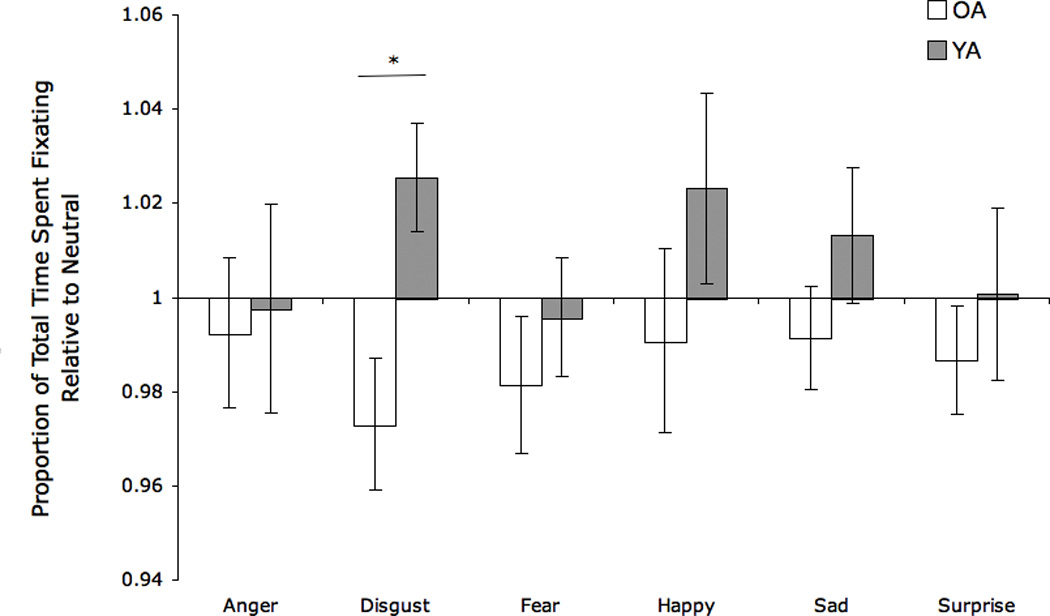
Proportion of total time spent fixating on each emotion category compared to neutral. Higher values (>1.0) indicate more time spent fixating on the emotion than on neutral faces; lower values (<1.0) indicate less time fixating on the emotion than on neutral faces.
OA= Older adults, YA= Younger adults. Asterisks indicate that the groups’ means are significantly different at the p < .01 (**) level.
Experiment 3: Neuropsychological Measures
Trail Making Test
YA were significantly faster than OA on Trails B, as expected (t[28]=2.5, p<.05, r=.43). For the YA group, there were no significant correlations between Trails B and facial emotion recognition accuracy scores or any scanning parameters. For the OA group, time to complete Trails B negatively correlated with recognition of sad faces (r=−.60, p=.02). Performance on Trails B also negatively correlated with total fixation duration on fearful faces (r=−.59, p=.02) and surprise faces (r=−.63, p=.01), and with mean fixation duration on sad faces (r=−.64, p=.01) and surprise faces (r=−.65, p=.01). As total fixation duration is often inversely related to total number of fixations, we observed a positive correlation with total number of fixations made on sad faces (r=.60, p=.02) and surprise faces (r=.62, p=.02). There were no other significant correlations with visual scanning patterns or emotion recognition accuracy in OA. In sum, OA participants with greater executive function difficulties as indexed by Trails B performance spent more time scanning (less time fixating) and sampled more information from (i.e., made more fixations to) fearful, sad, and surprise faces.
Stroop Interference
YA performed significantly better than OA on the Stroop task (interference scores), as expected (t[28]=3.9, p=.001, r=.59). For the OA group, performance on Stroop did not significantly correlate with accuracy on the emotion recognition task. Stroop interference scores in OA were negatively correlated with the number of top/bottom fixations for fearful faces (r=−.7, p=.01). The worse OA performed on the Stroop task, the more they looked at the top versus the bottom half of fearful faces. For the YA group, Stroop task performance was negatively correlated with accuracy on disgust (r=−.621, p=.01). The better YA performed on Stroop, the less accurate they were at identifying disgust. There was also a significant negative correlation between Stroop performance and total fixation duration on disgust faces (r=−.65, p=.01). The worse they performed on the Stroop task, the longer YA spent fixating on disgust facial images.
Summary of Main Results Across Experiments
In regard to emotion recognition accuracy (Experiment 1), we found that relative to YA, OA were worse at fear and better at disgust, and that the performance on disgust faces correlated with age within the OA group (Figure 1). There were no group differences for categorization of landscapes. Examination of visual scanning (Experiment 2) revealed group differences in top/bottom scanning patterns on faces, but not landscapes, with proportionately longer and more frequent fixations on the bottom half of the facial images than YA (Figures 2 & 3). A second set of analyses compared OA and YA on emotional scanning patterns for emotional faces relative to neutral faces and showed that OA spent less time fixating on disgust faces relative to neutral faces than did the YA group (Figure 4), which correlated negatively with disgust recognition accuracy scores across both groups together. Relating executive function (Experiment 3) to the results of the other experiments, we found that poorer OA performance on executive function measures was associated with reduced recognition of sad facial expressions, as well as with increased time scanning and increased sampling of information from fearful, sad, and surprise faces.
Discussion
The present study provides new information on the recognition of emotional faces in aging by (1) attributing the specificity of visual scanning patterns to faces and to non-face stimuli and (2) relating the findings to frontal-lobe executive function. Additionally, we found that compared to YA, OA spent less total time fixating on disgust faces, relative to neutral, which across groups was correlated with higher disgust recognition accuracy.
Age differences in emotion identification
Consistent with the reports of Wong et al. (2005) and Calder et al. (2003), relative to YA, the OA group was less accurate at identifying fear and more accurate at identifying disgust. Within the OA group, age correlated with performance on disgust: the older the participants were, the better able they were to identify disgust. Additional deficits in identifying anger and sadness have previously been reported, though not consistently. Suzuki et al. (2007) found deficits in recognizing sadness, but not fear or anger, whereas Calder et al. (2003) found OA deficits in recognizing fear and anger, but not sadness. Wong et al. (2005) found deficits for all three emotions. It appears that although these emotions are more difficult for OA to recognize, their performance may not always be significantly worse than YA, possibly owing to variability associated with small sample sizes or to the use of different methods (e.g., stimuli) to assess emotion recognition.
Visual scanning of emotional faces
We replicated Wong et al.’s (2005) finding that OA looked for a shorter proportion of time and made proportionately fewer fixations to the top half than the bottom half of the face than YA on expressions of disgust, fear, happy, and neutral.
The top/bottom scanning patterns did not correlate with accuracy of identification of these emotions for either group, as they did in Wong et al. (2005), who employed a more stringent criterion than we employed in the current study for defining fixations (i.e., stable fixations of ≥100 ms within 0.003° of visual angle, versus ≥50 ms within 1°, respectively). This change in the definition of fixations was made in order to gain a fuller estimation of scanning behaviors in OA and YA participants, and is in line with research that supports a shorter threshold for fixation duration (Dalton et al., 2005; Underwood et al., 2006) within a larger region of the visual field (i.e., 1° of visual angle, Loughland et al., 2002; Maltz & Shinar, 1999; Williams et al., 1999). Although the top/bottom fixation pattern previously seen with OA (Wong et al., 2005) was replicated in the present study, the strength of the correlations may have been affected by the change in the definition of fixations.
Across the OA and YA groups, less time spent fixating on disgust faces relative to neutral (i.e., more scanning) was associated with better disgust recognition, and the OA group spent less total time fixating on disgust faces relative to neutral than did YA. This group difference in performance may reflect age-related differences in the integrity or connectivity of structures or pathways important to the perception of disgust, such as the insula. Further research is needed to determine the substrates of this age-group difference.
Specificity of age effects to facial emotional recognition
In order to interpret the observed age effects with respect to facial emotion recognition, we introduced a control task that used complex scenes that had been matched for difficulty of categorization to facial emotions (Clark et al., 2008). The lack of significant differences between the OA and YA groups on landscape categorization accuracy or visual scanning patterns when looking at landscapes provides strong evidence that the age-related differences in visual scanning patterns we observed during facial emotion recognition were specific to this category of visual stimuli. That is, there is not a general process affecting image scanning, such as global changes in the FEF as considered in Wong et al., 2005; rather, a more specific process must drive the observed age-associated changes in visual scanning of faces. The FEF may still be affected, especially as we do see changes in frontal-lobe function (executive function) with age, but FEF abnormalities are not likely to be the sole driving force of visual scanning differences between younger and older adults. In relation to topographical scanning behaviors (top-bottom fixation patterns), notably, our results indicate that age-related changes in visual scanning of facial images occur during viewing of both emotional and neutral faces but not non-facial images, suggesting age-specific changes in the strategies utilized during facial analysis regardless of the degree of emotional content present in the face.
Frontal-lobe function and age-related effects on facial emotion
We investigated the possible role of the frontal lobe in the observed age effects because of its prominence in executive functioning and in controlling eye movements, processes that both underlie facial emotion recognition abilities. We found that OA performed more poorly than YA on the neuropsychological measures examining frontal-lobe function (Trails B and Stroop Interference), as well as on the antisaccade test, which requires response inhibition. These findings accord with research showing age-related deficits on tasks of executive function (e.g., Raz, Dahle, Rodrigue, Kennedy, & Land, 2011). OA did not perform worse than YA on the tests that are not considered probes of executive function, the Benton Facial Discrimination Task and the prosaccade task. Normal prosaccades indicate that OA have intact basic eye movements, and normal performance on the facial discrimination task demonstrates an intact ability to discriminate faces apart from facial emotion.
In OA there was a significant correlation between accuracy of recognition of sad faces and performance on Trails B, though this did not hold for the other emotion categories or for the other neuropsychological tests of frontal-lobe function. This finding indicates that age-related abnormalities in frontal-lobe regions implicated in this task (e.g., DLPFC, cingulate gyrus, and medial frontal gyrus: Moll et al., 2002; Zakzanis et al., 2005) may contribute to reductions in sadness recognition in OA. We make this suggestion despite not having also observed a correlation between Trails B and sadness recognition in the YA group, which may have been obscured due to the restricted variability in the YA group’s performance, both in terms of sadness recognition (standard deviation in YA=8.5 and in OA=14.5) and Trails B performance (standard deviation in YA=7.9 and in OA=12.3). The interpretation of our results is restricted to this particular sample in regard to size and participant characteristics; additional research is needed to further explore this implication.
Similar to the findings of Phillips et al. (2010), we did not find a strong association between emotion recognition and Stroop performance in OA. By contrast, in the YA group, we observed a significant negative correlation between Stroop performance and accuracy on disgust, indicting that the better the YA participants performed on the Stroop task, the worse they were at identifying disgust. Because the dorsal ACC is actively engaged when completing the Stroop (MacDonald et al., 2000), this result suggests that there may be an aspect of frontal-lobe functioning, potentially involving the ACC, that actually inhibits the recognition of disgust in YA; if this activation pattern changes with age, disgust accuracy may improve. While our findings are in line with those from the study by Phillips and colleagues, in that we observed differences in the degree to which certain executive function measures correlated with performance on our emotion recognition task, we consider these results to be preliminary given our small sample size.
We observed significant correlations between performance on executive function tasks and visual scanning patterns (total fixation duration, mean fixation duration, total number of fixations, and top/bottom fixation patterns) in both groups. OA participants with greater executive function difficulties as indexed by Trails B performance spent more time scanning (less time fixating) and sampled more information from (i.e., made more fixations to) fearful, sad, and surprise faces. Our OA group demonstrated significant impairments in fear recognition, and although we did not see a significant difficulty in the recognition of sadness and surprise in the OA group, these emotions have been shown in other studies to be more difficult for OA than YA. Accordingly, this scanning pattern may be a marker for emotion recognition difficulty, as we also observed a correlation between poorer Trails B performance and emotion recognition impairments. Additionally, we saw with neutral-relative scanning parameters that more scanning of disgust faces relative to neutral faces actually correlated with better performance. It is possible that older adults find that the strategy of increased scanning is somehow helpful when looking at disgust faces, but not for other emotions. Interestingly, in YA, Stroop interference scores negatively correlated with fixation duration on disgust images and disgust recognition. Those YA who performed less well on Stroop spent more time fixating on disgust images and performed better on disgust.
In the OA group, those with poorer executive function abilities looked more at the top half of facial expressions. They made more fixations to the top half of the face relative to the bottom on fearful faces; they also tended to make more numerous fixations with shorter durations on fearful, surprised, and sad images. These changes were most commonly observed for expressions that OA have been reported to experience difficulty interpreting (Calder et al., 2003, Suzuki et al., 2007, Wong et al., 2005). Spending more time analyzing facial images (i.e., sampling more regions), particularly the top portions of facial expressions, may have served as a compensatory strategy for, or it may simply be a marker of, difficulties associated with decision making when assessing the emotional content of these facial expressions, which are noted to contain more emotional information in the eye region (Calder et al., 2000). Our data are generally consistent with the findings of Firestone et al. (2007) that older adults spent more time scanning with a greater number of shorter fixations than did younger adults. In addition, older adults in that study showed a decreased ability to recognize faces (not emotions), and the authors indicated that scanning patterns (time fixating versus scanning) may affect facial recognition. Overall it seems that in OA, poorer executive function correlates with more scanning and less total time fixating on emotional images. These correlations may reflect an effect of frontal-lobe changes associated with aging (Raz, 2000) on emotion recognition.
Conclusions
Our results comparing faces and landscapes indicate that visual scanning patterns are not globally affected in older adults, but rather that processes specific to viewing emotional faces may change with age. Additionally it appears that executive function is correlated with both emotion recognition and visual scanning patterns, supporting the hypothesis that frontal-lobe changes with age may contribute to changes observed in emotion processing. Our findings show that emotion recognition is a complex process involving visual attention, as indexed by scanning patterns, and higher level processing including executive function, which may itself contribute to patterns of visual scanning. Further research on the relation of facial emotion recognition, visual attention, and frontally-mediated cognition may support the development of interventions for older adults, with the aim of improving emotion recognition in everyday interactions and enhancing quality of life.
Acknowledgments
This work was supported by an American Parkinson Disease Association medical student fellowship (KC); a Ruth L. Kirschstein National Research Service Award from the National Institute on Aging (F31 AG026166) and a Clara Mayo Research Award from the Department of Psychology, Boston University (UC), and the National Institute of Neurological Disorders and Stroke (R01 NS050446 and R01 NS052914) (ACG).
We thank all of the individuals who participated in this study. We are also grateful to Sandy Neargarder, Ph.D., for advice on data analysis; to Thomas Laudate, Ph.D. and Bruce Reese, M.A., for technical assistance; and to Robert Nebes, Ph.D., for helpful discussions of earlier versions of this manuscript.
Footnotes
The study was presented in part at the annual meeting of the International Neuropsychological Society, 2007.
References
- Adams KB, Moon H. Subthreshold depression: Characteristics and risk factors among vulnerable elders. Aging & Mental Health. 2009;13(5):682–692. doi: 10.1080/13607860902774501. [DOI] [PubMed] [Google Scholar]
- Adolphs R. Neural systems for recognizing emotion. Current Opinion in Neurobiology. 2002a;12:169–177. doi: 10.1016/s0959-4388(02)00301-x. [DOI] [PubMed] [Google Scholar]
- Adolphs R. Recognizing emotion from facial expressions: Psychological and neurological mechanisms. Behavioral and Cognitive Neuroscience Reviews. 2002b;1(1):21–62. doi: 10.1177/1534582302001001003. [DOI] [PubMed] [Google Scholar]
- Barton JJS. Brain damage and eye movements. In: Behrmann M, editor. Handbook of neuropsychology. 2 ed. Vol. 4. Amsterdam: Elsevier; 2001. pp. 15–44. [Google Scholar]
- Beck AT, Epstein N, Brown G, Steer RA. An inventory for measuring clinical anxiety: psychometric properties. Journal of Consulting and Clinical Psychology. 1988;56:893–897. doi: 10.1037//0022-006x.56.6.893. [DOI] [PubMed] [Google Scholar]
- Beck AT, Steer RA, Brown GK. Beck Depression Inventory Manual. 2nd ed. San Antonio, TX: Psychological Corporation; 1996. [Google Scholar]
- Benton AL, Sivan AB, Hamsher K, de S, Varney NR, Spreen O. Contributions to neuropsychological assessment: A clinical manual. Second edition. New York: Oxford University Press; 1994. pp. 35–52. [Google Scholar]
- Bishop S, Duncan J, Brett M, Lawrence AD. Prefrontal cortical function and anxiety: Controlling attention to threat-related stimuli. Nature Neuroscience. 2004;7:184–188. doi: 10.1038/nn1173. [DOI] [PubMed] [Google Scholar]
- Bruck A, Portin R, Lindell A, Laihinen A, Bergman J, Haaparanta M, et al. Positron emission tomography shows that impaired frontal lobe functioning in Parkinson's disease is related to dopaminergic hypofunction in the caudate nucleus. Neuroscience Letters. 2001;311(2):81–84. doi: 10.1016/s0304-3940(01)02124-3. [DOI] [PubMed] [Google Scholar]
- Bush G, Luu P, Posner MI. Cognitive and emotional influences in anterior cingulate cortex. Trends in Cognitive Sciences. 2000;4(6):215–222. doi: 10.1016/s1364-6613(00)01483-2. [DOI] [PubMed] [Google Scholar]
- Calder AJ, Keane J, Manly T, Sprengelmeyer R, Scott S, Nimmo-Smith I, et al. Facial expression recognition across the adult life span. Neuropsychologia. 2003;41:195–202. doi: 10.1016/s0028-3932(02)00149-5. [DOI] [PubMed] [Google Scholar]
- Calder AJ, Keane J, Young AW, Dean M. Configural information in facial expression perception. Journal of Experimental Psychology: Human Perception and Performance. 2000;26(2):527–551. doi: 10.1037//0096-1523.26.2.527. [DOI] [PubMed] [Google Scholar]
- Clark U, Neargarder S, Cronin-Golomb A. Specific impairments in the recognition of emotional facial expressions in Parkinson’s disease. Neuropsychologia. 2008;46(9):2300–2309. doi: 10.1016/j.neuropsychologia.2008.03.014. [DOI] [PMC free article] [PubMed] [Google Scholar]
- Clark U, Neargarder S, Cronin-Golomb A. Visual exploration of emotional facial expressions in Parkinson’s disease. Neuropsychologia. 2010;48(7):1901–1913. doi: 10.1016/j.neuropsychologia.2010.03.006. [DOI] [PMC free article] [PubMed] [Google Scholar]
- Dalton KM, Nacewicz BM, Johnstone T, Schaefer HS, Gernsbacher MA, Goldsmith HH, et al. Gaze fixation and the neural circuitry of face processing in autism. Nature Neuroscience. 2005;8(4):519–526. doi: 10.1038/nn1421. [DOI] [PMC free article] [PubMed] [Google Scholar]
- Dreher JC, Grafman J. Dissociating the roles of the rostral anterior cingulate and the lateral prefrontal cortices in performing two tasks simultaneously or successively. Cerebral Cortex. 2003;13(4):329–339. doi: 10.1093/cercor/13.4.329. [DOI] [PubMed] [Google Scholar]
- Ekman P, Friesen WV. Pictures of facial affect. Palo Alto, CA: Consulting Psychologists Press; 1976. [Google Scholar]
- Firestone A, Turk-Browne NB, Ryan JD. Age-related deficits in face recognition are related to underlying changes in scanning behavior. Aging, Neuropsychology, and Cognition. 2007;14(6):594–607. doi: 10.1080/13825580600899717. [DOI] [PubMed] [Google Scholar]
- Folstein M, Folstein S, McHugh PR. “Mini-mental state”: A practical method for grading the cognitive state of patients for the clinician. Journal of Psychiatric Research. 1975;12:189–198. doi: 10.1016/0022-3956(75)90026-6. [DOI] [PubMed] [Google Scholar]
- Golden CJ. Stroop Color and Word Test. Chicago: Stoelting; 1979. [Google Scholar]
- Grimm S, Schmidt CF, Bermpohl F, Heinzel A, Dahlem Y, Wyss M, et al. Segregated neural representation of distinct emotion dimensions in the prefrontal cortex—an fMRI study. NeuroImage. 2006;30:325–340. doi: 10.1016/j.neuroimage.2005.09.006. [DOI] [PubMed] [Google Scholar]
- Gunning-Dixon FM, Gur RC, Perkins AC, Schroeder L, Turner T, Turetsky BI, et al. Age-related differences in brain activation during emotional face processing. Neurobiology of Aging. 2003;24:285–295. doi: 10.1016/s0197-4580(02)00099-4. [DOI] [PubMed] [Google Scholar]
- Hall JA, Carter J, Horgan T. Gender differences in the nonverbal communication of emotion. In: Fischer A, editor. Gender and emotion: Social psychological perspectives. Paris: Cambridge University Press; 2000. pp. 97–117. [Google Scholar]
- Harms MB, Martin A, Wallace GL. Facial emotion recognition in autism spectrum disorders: A review of behavioral and neuroimaging studies. Neuropsychology Review. 2010;20:290–322. doi: 10.1007/s11065-010-9138-6. [DOI] [PubMed] [Google Scholar]
- Henderson JM. Human gaze control during real-world scene perception. Trends in Cognitive Sciences. 2003;7(11):498–504. doi: 10.1016/j.tics.2003.09.006. [DOI] [PubMed] [Google Scholar]
- Henderson JM, Weeks PA, Jr, Hollingworth A. The effects of semantic consistency on eye movements during complex scene viewing. Journal of Experimental Psychology: Human Perception and Performance. 1999;25(1):210–228. [Google Scholar]
- Hoffmann H, Kessler H, Eppel T, Rukavina S, Traue HC. Expression intensity, gender and facial emotion recognition: Women recognize only subtle facial emotions better than men. Acta Pscyhologica. 2010;135:278–283. doi: 10.1016/j.actpsy.2010.07.012. [DOI] [PubMed] [Google Scholar]
- Isaacowitz DM, Charles ST, Carstensen LL. Emotion and cognition. In: Craik FIM, Salthouse TA, editors. The handbook of aging and cognition. 2nd ed. Mahwah, NJ: Erlbaum; 2000. pp. 593–633. [Google Scholar]
- Kiehl KA, Liddle PF, Hopfinger JB. Error processing and the rostral anterior cingulate: An event-related fMRI study. Psychophysiology. 2000;37:216–223. [PubMed] [Google Scholar]
- Kliemann D, Dziobek I, Hatri A, Steimke R, Heekeren HR. Atypical reflexive gaze patterns on emotional faces in autism spectrum disorders. The Journal of Neuroscience. 2010;30(37):12281–12287. doi: 10.1523/JNEUROSCI.0688-10.2010. [DOI] [PMC free article] [PubMed] [Google Scholar]
- Land MF, Hayhoe M. In what ways do eye movements contribute to everyday activities? Vision Research. 2001;41(25):3559–3565. doi: 10.1016/s0042-6989(01)00102-x. [DOI] [PubMed] [Google Scholar]
- Loughland CM, Williams LM, Gordon E. Visual scanpaths to positive and negative facial emotions in an outpatient schizophrenia sample. Schizophrenia Research. 2002;55(1–2):159–170. doi: 10.1016/s0920-9964(01)00186-4. [DOI] [PubMed] [Google Scholar]
- MacDonald AW, 3rd, Cohen JD, Stenger VA, Carter CS. Dissociating the role of the dorsolateral prefrontal and anterior cingulate cortex in cognitive control. Science. 2000;288(5472):1835–1838. doi: 10.1126/science.288.5472.1835. [DOI] [PubMed] [Google Scholar]
- Madden DJ, Spaniol J, Whiting WL, Bucur B, Provenzale JM, Cabeza R, et al. Adult age differences in the functional neuroanatomy of visual attention: A combined fMRI and DTI study. Neurobiology of Aging. 2007;28:459–476. doi: 10.1016/j.neurobiolaging.2006.01.005. [DOI] [PMC free article] [PubMed] [Google Scholar]
- Maltz M, Shinar D. Eye movements of younger and older drivers. Human Factors. 1999;41(1):15–25. doi: 10.1518/001872099779577282. [DOI] [PubMed] [Google Scholar]
- McClure EB. A meta-analytic review of sex differences in facial expression processing and their development in infants, children, and adolescents. Psychological Bulletin. 2000;126:424–453. doi: 10.1037/0033-2909.126.3.424. [DOI] [PubMed] [Google Scholar]
- Mesulam MM. Attention, confusional states, and neglect. In: Mesulam MM, editor. Principles of behavioral neurology. Philadelphia: Davis; 1985. pp. 125–168. [Google Scholar]
- Milham MP, Banich MT. Anterior cingulate cortex: An fMRI analysis of conflict specificity & functional differentiation. Human Brain Mapping. 2005;25:328–335. doi: 10.1002/hbm.20110. [DOI] [PMC free article] [PubMed] [Google Scholar]
- Moll J, de Oliveira-Souza R, Moll FT, Bramati IE, Andreiuolo PA. The cerebral correlates of set-shifting: an fMRI study of the trail making test. Arquivos de Neuro-psiquiatria. 2002;60(4):900–905. doi: 10.1590/s0004-282x2002000600002. [DOI] [PubMed] [Google Scholar]
- Murphy FC, Nimmo-Smith I, Lawrence AD. Functional Neuroanatomy of Emotions: A meta-analysis. Cognitive, Affective, & Behavioral Neuroscience 2003. 2003;3(3):207–233. doi: 10.3758/cabn.3.3.207. [DOI] [PubMed] [Google Scholar]
- Nieuwenhuis SN, Ridderinkhof KR, de Jong R, Kok A, van der Molen MW. Inhibitory inefficiency and failures of intention activation: Age-related decline in the control of saccadic eye movements. Psychology and Aging. 2000;15:635–647. doi: 10.1037//0882-7974.15.4.635. [DOI] [PubMed] [Google Scholar]
- Olk B, Kingstone A. Why are antisaccades slower than prosaccades? A novel finding using a new paradigm. Neuroreport. 2003;14(1):151–155. doi: 10.1097/00001756-200301200-00028. [DOI] [PubMed] [Google Scholar]
- Orgeta V. Effects of age and task difficulty on recognition of facial affect. Journal of Gerontology B Psychological Sciences and Social Sciences. 2010;65B(3):323–327. doi: 10.1093/geronb/gbq007. [DOI] [PubMed] [Google Scholar]
- Palmore E. Social patterns in normal aging: Findings from the Duke Longitudinal Study. Durham, NC: Duke University Press; 1981. [Google Scholar]
- Petit L, Clark VP, Ingeholm J, Haxby JV. Dissociation of saccade-related and pursuit-related activation in human frontal eye fields as revealed by fMRI. The American Physiological Society. 1997:3386–3390. doi: 10.1152/jn.1997.77.6.3386. [DOI] [PubMed] [Google Scholar]
- Petit-Taboue MC, Landeau B, Desson JF, Desgranges B, Baron JC. Effects of healthy aging on the regional cerebral metabolic rate of glucose assessed with statistical parametric mapping. NeuroImage. 1998;7:176–184. doi: 10.1006/nimg.1997.0318. [DOI] [PubMed] [Google Scholar]
- Phillips ML, Drevets WC, Rauch SL, Lane R. Neurobiology of emotion perception I: The neural basis of normal emotion perception. Biological Psychiatry. 2003;54(5):504–514. doi: 10.1016/s0006-3223(03)00168-9. [DOI] [PubMed] [Google Scholar]
- Phillips LH, Maclean RDJ, Allen R. Age and the Understanding of Emotions: Neuropsychological and Sociocognitive Perspectives. Journal of Gerontology B Psychological Sciences and Social Sciences. 2002;57(6):526–530. doi: 10.1093/geronb/57.6.p526. [DOI] [PubMed] [Google Scholar]
- Phillips LH, Scott C, Henry JD, Mowat D, Bell JS. Emotion perception in Alzheimer's disease and mood disorder in old age. Psychology and Aging. 2010;25(1):38–47. doi: 10.1037/a0017369. [DOI] [PubMed] [Google Scholar]
- Raz N. Aging of the brain and its impact on cognitive performance: Integration of structural and functional findings. In: Craik FIM, Salthouse TA, editors. The handbook of aging and cognition. 2nd ed. Mahwah, NJ: Erlbaum; 2000. pp. 1–90. [Google Scholar]
- Raz N, Dahle CL, Rodrigue KM, Kennedy KM, Land S. Effects of age, genes, and pulse pressure on executive functions in healthy adults. Neurobiology of Aging. 2011;32(6):1124–1137. doi: 10.1016/j.neurobiolaging.2009.05.015. [DOI] [PMC free article] [PubMed] [Google Scholar]
- Reitan RM, Wolfson D. The Halstead–Reitan Neuropsychological Test Battery: Theory and clinical interpretation. 2nd ed. Tuscon, AZ: Neuropsychology Press; 1993. [Google Scholar]
- Rinne JO, Portin R, Ruottinen H, Nurmi E, Bergman J, Haaparanta M, et al. Cognitive impairment and the brain dopaminergic system in Parkinson disease: [18F]fluorodopa positron emission tomographic study. Archives of Neurology. 2000;57(4):470–475. doi: 10.1001/archneur.57.4.470. [DOI] [PubMed] [Google Scholar]
- Ruffman T, Henry JD, Livingstone V, Phillips LH. A meta-analytic review of emotion recognition and aging: implications for neuropsychological models of aging. Neuroscience and Behavioral Reviews. 2008;32:863–881. doi: 10.1016/j.neubiorev.2008.01.001. [DOI] [PubMed] [Google Scholar]
- Russell JA. Is there universal recognition of emotion from facial expression? A review of the cross-cultural studies. Psychol Bull. 1994;115(1):102–141. doi: 10.1037/0033-2909.115.1.102. [DOI] [PubMed] [Google Scholar]
- Spreen O, Strauss E. A compendium of neuropsychological tests: Administration, norms, and commentary. 2nd ed. New York: Oxford University Press; 1998. [Google Scholar]
- Sullivan S, Ruffman T, Hutton SB. Age differences in emotion recognition skills and the visual scanning of emotion faces. Journal of Gerontology: Psychological Sciences. 2007;62B(1):53–60. doi: 10.1093/geronb/62.1.p53. [DOI] [PubMed] [Google Scholar]
- Suzuki A, Hoshino, Takahiro, Shigemasu K, Kawamura M. Decline or improvement? Age-related differences in facial expression recognition. Biological Psychology. 2007;74:75–84. doi: 10.1016/j.biopsycho.2006.07.003. [DOI] [PubMed] [Google Scholar]
- Takahashi R, Ishii K, Kakigi T, Yokoyama K. Gender and age differences in normal adult human brain: Voxel-based morphometric study. Human Brain Mapping. 2011;32(7):1050–1058. doi: 10.1002/hbm.21088. [DOI] [PMC free article] [PubMed] [Google Scholar]
- Underwood G, Foulsham T, van Loon E, Humphreys L, Bloyce J. Eye movements during scene inspection: A test of the saliency map hypothesis. European Journal of Cognitive Psychology. 2006;18(3):321–342. [Google Scholar]
- Van Veen V, Carter CS. The timing of action monitoring processes in anterior cingulate cortex. Journal of Cognitive Neuroscience. 2002;14:593–602. doi: 10.1162/08989290260045837. [DOI] [PubMed] [Google Scholar]
- Vuilleumier P, Armony JL, Driver J, Dolan RJ. Effects of attention and emotion on face processing in the human brain: An event-related fMRI study. Neuron. 2001;30:829–841. doi: 10.1016/s0896-6273(01)00328-2. [DOI] [PubMed] [Google Scholar]
- Williams LM, Loughland CM, Gordon E, Davidson D. Visual scanpaths in schizophrenia: Is there a deficit in face recognition? Schizophrenia Research. 1999;40:189–199. doi: 10.1016/s0920-9964(99)00056-0. [DOI] [PubMed] [Google Scholar]
- Wong B, Cronin-Golomb A, Neargarder S. Patterns of visual scanning as predictors of emotion identification in normal aging. Neuropsychology. 2005;19(6):739–749. doi: 10.1037/0894-4105.19.6.739. [DOI] [PubMed] [Google Scholar]
- Yarbus AL. Eye movements and vision. New York: Plenum Press; 1967. [Google Scholar]
- Zakzanis KK, Mraz R, Graham SJ. An fMRI study of the Trail Making Test. Neuropsychologia. 2005;43(13):1878–1886. doi: 10.1016/j.neuropsychologia.2005.03.013. [DOI] [PubMed] [Google Scholar]