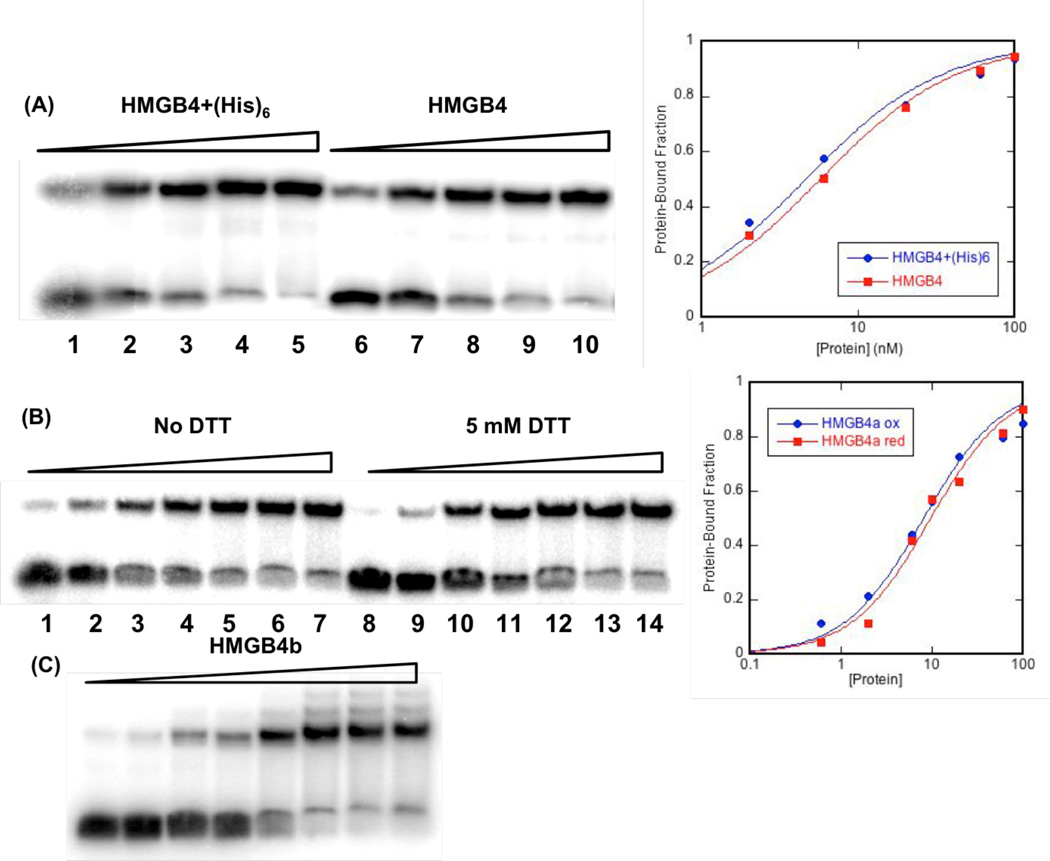
Figure 4.
(A) EMSA analysis of the titration of platinated 25TGGA (1 nM) with full-length HMGB4 with or without a (His)6 tag at concentrations of 2 nM (lanes 1, 6), 6 nM (lanes 2, 7), 20 nM (lanes 3, 8), 60 nM (lanes 4, 9), and 100 nM (lanes 5, 10) (left) and a plot of the protein-bound DNA fraction vs protein concentration (right). (B) EMSA analysis of HMGB4a bound to the platinated 25TGGA (1 nM) under reducing (5 mM DTT) or non-reducing conditions (left) and a plot of protein-bound DNA fraction vs concentrations of HMGB4a (right). Protein concentrations were 0.6 nM (lanes 1, 8), 2 nM (lanes 2, 9), 6 nM (lanes 3, 10), 10 nM (lanes 4, 11), 20 nM (lanes 5, 12), 60 nM (lanes 6, 13), and 100 nM (lanes 7, 14) (C) EMSA analysis of HMGB4b bound to a cisplatin-modified DNA probe (15 nM). Protein concentrations were 31.25, 62.5, 125, 250, 500, 1000, 2000, and 4000 nM.

