

Abstract
Cytotoxic T-lymphocyte-associated protein 4 (CTLA-4) is a surface receptor on activated T cells that delivers an inhibitory signal, serving as an immune checkpoint. Treatment with anti-CTLA-4 antibodies can induce clinical responses to different malignancies, but the nature of the induced antigen-specific recognition is largely unknown. Using microarrays spotted with over 8000 human proteins, we assessed the diversity of antibody responses modulated by treatment with CTLA-4-blockade and granulocyte macrophage colony-stimulating factor (GM-CSF). We find that advanced prostate cancer patients who clinically respond to treatment also develop enhanced antibody responses to a higher number of antigens than non-responders. These induced antibody responses targeted antigens to which preexisting antibodies are more likely to be present in the clinical responders compared to non-responders. The majority of antibody responses are patient-specific, but immune responses against antigens shared among clinical responders are also detected. One of these shared antigens is p21-activated kinase 6 (Pak6), which is expressed in prostate cancer and to which CD4+ T cell responses were also induced. Moreover, immunization with Pak6 can be both immunogenic and protective in mouse tumor models. These results demonstrate that immune checkpoint blockade modulates antigen-specific responses to both individualized and shared antigens, some of which can mediate anti-tumor responses.
Introduction
Cancer immunotherapy relies on the induction of effector T cells to mediate tumor regression. Activation of these T cells requires recognition of specific antigens in concert with costimulatory signals from the CD28 receptor on T cells. CD28, which is constitutively expressed on T cells binds to the CD80 and CD86 molecules present on the cell surface of antigen-presenting cells (APC) and delivers signals required by naïve T cells to become activated and proliferate (1). Once activated, these T cells transiently up-regulate the cytotoxic T-lymphocyte-associated protein 4 (CTLA-4) receptor on their cell surface, which interacts with the same ligands as CD28, but serves as an immune checkpoint, inhibiting cell cycle progression and IL-2 production (2). Thus, CTLA-4 signaling provides negative feedback to activated T cells, thereby dampening an immune response. Blocking CTLA-4 with anti-CTLA-4 antibodies enhances effector T cell responses and can induce T cell-mediated rejection of certain tumors in mouse models (3). Anti-CTLA-4 antibody treatment possesses anti-tumor activity in cancer patients with different tumor types (4), and is an FDA-approved drug shown to improve survival of patients with metastatic melanoma. Clinical trials in many other cancers are underway including two phase III trials in men with metastatic castration resistant prostate cancer (CRPC) (www.ClinicalTrials.gov, Identifiers: NCT00861614 and NCT01057810).
CTLA-4 blockade has been shown to induce T cell and humoral immunity to antigens in mice that are vaccinated with defined antigenic peptides (5) or whole cell tumor vaccines (6). In cancer patients, CTLA-4 blockade can induce antibodies to the cancer-testis antigen, NY-ESO-1 (7), but these responses are not tightly associated with clinical responses for prostate cancer (8) and therefore may not mediate the antitumor effects seen. CTLA-4 blockade can also induce antibodies to MHC class I chain-related protein A (MICA) in melanoma patients vaccinated with irradiated, autologous tumor cells transduced to express granulocyte macrophage colony-stimulating factor (GM-CSF) (9). GM-CSF is a cytokine that regulates the survival, proliferation, differentiation and function of granulocytes, macrophages and dendritic cells (10, 11) that has been shown to synergize with CTLA-4 in pre-clinical and clinical trials (12). CTLA-4-blockade can also induce significant clinical responses without a concomitant vaccine. This treatment presumably potentiates an adaptive immune response to the endogenous tumor antigens, but the immunologic targets that mediate anti-tumor activity are largely unknown.
We performed a phase I trial where a combination of anti-CTLA-4 antibody (ipilimumab, Bristol-Myer Squibb), and GM-CSF (sargramostim, Sanofi) is administered to patients with metastatic CRPC who had not received any prior chemotherapy or immunotherapy. We found that this treatment induced clinical responses at or above a dose threshold of 3 mg/kg of anti-CTLA-4 (8). At dose levels of 3 mg/kg and 10 mg/kg of anti-CTLA-4, 5 out of 11 evaluable patients had a prostate specific antigen (PSA) response to the treatment, defined by a serum PSA level decline of 50% or greater. Based on this criterion, we could separate the study subjects into clinical responders (patients 19, 20, 24, 33, 36) and non-responders (patients 21, 22, 23, 28, 34, 35; Fig. 1A). As these patients did not receive cancer vaccines as part of their treatment, this clinical study provides an opportunity to determine the endogenous antigens against which immune responses are induced with immune checkpoint blockade-based immunotherapy. High-density human protein arrays were used to profile the antigen-specific immune responses in these prostate cancer patients receiving anti-CTLA-4 antibody and GM-CSF. We find that clinical responders develop antigen-specific immune responses distinct for clinical non-responders. We also demonstrate that an identified shared autoantigen can also serve as a novel tumor-associated antigen.
FIGURE 1. Modulation of antigen-specific IgG responses with CTLA-4 blockade.

(A) Serum PSA levels of prostate cancer patients treated with CTLA4 blockade normalized to the baseline level are plotted over weeks after the initiation of treatment. Subjects received ipilimumab at either 3 mg/kg (filled symbols) or 10 mg/kg (open symbols). PBMCs and sera from these patients were used for subsequent experiments. (B) Scatter plot analysis of median centered log2 transformed and normalized fluorescence intensities are plotted for pre-treatment (x-axis) and post-treatment (y-axis) sera from clinical responders (subjects 19, 20, 24, 33, and 36) and (C) non-responders (subjects 21, 22, 23, 34, and 35). Diagonal lines delineate 4 fold change of the difference between post-and pre-treatment intensities above and below the x=y axis. (D) Box plots of up-modulated (upper panel) and down-modulated (lower panel) antibodies with 4 fold change for non-responders and responders. The box bounds the middle 50% of the values and the median is denoted by the thick line. The whisker lines span 1.5 times the interquartile range. Data points beyond that are considered as outliers and are shown as circles. Two-sided Wilcoxon rank sum test p-value for the difference in the number of up-modulated antibodies between non-responders and responders is 0.0043 and in the number of down modulated antibodies is 0.429. (*) denotes a significant p-value < 0.05.
Material and Methods
Clinical Trial
A phase I/II trial combined escalating doses of anti-CTLA-4 antibody (ipilimumab, Bristol-Myer Squibb) with a fixed dose of GM-CSF (sargramostim, Sanofi) was performed to assess for safety, feasibility, and immunogenicity in patients with CRPC (NCT00064129) (8). Patients received up to four doses of anti-CTLA-4 antibodies at the specified doses. These doses were given in four-week cycles with GM-CSF administered daily on the first 14 days of these cycles. Cycles of GM-CSF treatment could continue until disease progression or toxicity. Patients’ characteristics are summarized in Supplementary Table I. Sera and cryopreserved PBMC from study subjects who received ipilimumab at the 3 mg/kg (n=6) and 10 mg/kg (n=6) doses were used in this study. A sixth patient in the 10 mg/kg cohort discontinued the study after 2 months due to disease progression, so post-treatment samples were not available in that patient. Informed consent was obtained for investigations on humans.
IgG profiling with high-density protein microarrays
Sera from pre-treatment and from post-treatment (month 6) were diluted 1:500 in probing buffer and used to blot protein arrays (Invitrogen) according to manufacturer’s instructions. Antibodies bound to the spotted proteins were detected by using anti-human IgG conjugated to Alexafluor 647 (Invitrogen) and fluorescence was acquired with a GenePix fluorescence microarray axon scanner (Molecular Devices, Sunnyvale, CA).
Statistical analysis
Preprocessing: The data were transformed into log2 intensity values. Spots whose log2 intensity values were below array specific low-intensity cut-offs were excluded from analyses by setting them as missing. The array specific low-intensity thresholds were determined as the 75th percentile of the log2 intensity values of the negative control spots. Duplicate spots were averaged. The data were then normalized using quantile normalization to ensure that the intensities had the same empirical distribution across arrays. Lastly, each array was median-centered.
Unsupervised clustering of protein arrays: Cluster and Treeview software (13) were used for unsupervised clustering of the data with Pearson correlation and complete linkage. All protein array data has been deposited in NCBI GEO under the accession number GSE39688 <http://www.ncbi.nlm.nih.gov/geo/query/acc.cgi?acc=GSE39688> and is MIAME compliant .
For each array, an antigen was identified as being detected if its value was above the median. To determine the number of up and down modulated antibodies, the difference in log2 intensity values of pre-and post-treatment samples were taken for each patient to identify antigens that are detected differentially due to treatment. Number of antibodies with at least two or four fold difference {difference in log2 intensity values =+/− 1 or +/−2} between pre-and post-treatment samples were compared between responders and non-responders by performing 2-sided Wilcoxon’s rank sum test and using the 5% level of significance.
To determine the number of up-modulated antibodies that have preexisting levels or not in the pre-treatment serum, normal mixture modeling with estimation-maximization (EM) as implemented in mclust package in R (14) was applied to the raw intensities for each pre-treatment and post-treatment array to identify the boundary between non-preexisting and preexisting (Supplementary Fig. 1A, B). Normal mixture modeling assumes that the data consists of two or more subsets which have different distributions (normal distributions with different parameters) and tries to identify the distributions and hence the antibodies which belong to those distributions by using EM algorithm. The raw intensities were subjected to pre-processing as before and all log2 values were centered to the boundary and values below the boundary were set to zero. The number of antibodies up-modulated by two or four fold in the post-treatment serum that were preexisting in the pre-treatment serum was compared with the number of similarly up-modulated antibodies that were non-preexisting in the pre-treatment serum for each patient. Fisher’s exact tests were performed for each patient and the p-values were adjusted for multiple comparisons by Bonferroni method. An adjusted p-value cutoff of 0.05 was used to determine significance. Odds ratios were estimated from conditional Maximum Likelihood Estimates (MLE). Multiplicative poisson regression model with the number of antibodies up-modulated as the dependent variable and clinical response status and pre-treatment preexisting or not status as dependent variables were fitted to see if there was any interaction between clinical response and pre-treatment antibodies.
All statistical analyses were performed by using R/Bioconductor software (14, 15) unless otherwise mentioned.
Intracellular cytokine staining
PBMCs were incubated with media alone (IMDM, 5% human sera, 2 mM L-glutamine, 100 U/ml Penicillin/0.1 mg/ml streptomycin), or with 10 μg/ml of baculoviral purified human PAK6 or CAMK2N1 protein, or 50 ng/ml of PMA and 500 ng/ml of ionomycin. Anti-human CD28 antibody (BD) and anti-human CD49d antibody (BD) were added at a final concentration of 1 μg/ml for 48 h. GolgiStop buffer (BD) was added at a final concentration of 1 μg/ml for the last 6 h. The cells were stained with 1 μg/ml of all antibodies unless otherwise noted. Cells were first stained with APC-conjugated anti-human CD3 antibody (Biolegend), Pacific blue-conjugated anti-human CD4 (Biolegend), PE-Cy7-conjugated anti-human CD8 (Biolegend), and APC-conjugated anti-human CD20 (BD), for 1 h at room temperature and fixed and permeabilized with standard methods (Biolegend Fox Fix/Perm buffer). Cells were then stained intracellularly with Alexa 700-conjugated anti-human IFN-γ (Biolegend) or PE-conjugated anti-human IL-17A antibody (eBioscience), and assessed by flow cytometry. Results were analyzed with Flowjo software (TreeStar).
Western blotting and Immunohistochemistry
Cell lines were lysed in lysis buffer (20 mM HEPES pH 7.4, 150 mM NaCl, 1.5 mM MgCl2, 1 mM EGTA, 10% Triton X-100, and protease inhibitors) and 30 μg of total protein was loaded per lane of a SDS-PAGE. Primary antibodies used for Western blotting: Goat anti-human Pak6 at 1:400 dilutions (R&D, AF4265, 1 μg/μl); mouse anti-human β-actin at 1:10,000 dilutions (Sigma, A1978, 2 μg/μl). Secondary antibodies: HRP-conjugated anti-goat IgG (Upstate, 1 μg/μl) or HRP-conjugated anti-mouse IgG (Upstate, 1 μg/μl) at 1:5000 dilutions.
Paraffin-embedded prostate tumors were baked, deparaffinized and rehydrated in the following order with xylene, 100% EtOH, 95% EtOH, 70% EtOH, and distilled water. The slides were then pressure cooked in 10 mM citrate buffer pH 6.0, washed in distilled water and in PBS with 0.05% Tween 20 (PBST) and incubated in 3% H2O2 in PBS for 15 min. Slides were first blocked with normal goat serum (Vector Labs, S-1000) diluted 1:10 and incubated with the primary staining antibodies (Rabbit anti-human Pak6, Novus Biologicals, 1 μg/μl or normal rabbit IgG control, Dako, 1 μg/μl) at 1:200 dilutions overnight at 4°C. The slides were next incubated with biotinylated goat anti-rabbit (Vector Labs, BA-1000, 1.5 μg/μl) at 1:200 dilutions, ABC-HRP (Vector Labs, PK-6100 Vectastain ABC kit) at 1:100 dilutions, and with DAB (Sigma, D5905) for 5 min at room temperature. Images were obtained with an Olympus microscope (BX41) with attachment (U-DO3) and camera (Micropublisher 5.0). The objective lens used was 20x/0.4 Plan and the resulting magnification was 200x. The acquisition software used was QCapture.
T cell proliferation assay
C57BL/6 and FVB mice were immunized twice with CFA plus PBS or CFA plus Pak6 protein (100 mg/mouse) (3 mice in each immunized group), fourteen days apart. After an additional fourteen days, the mice were sacrificed, and sera and cells from the inguinal draining lymph nodes were obtained. Lymphocytes derived from draining lymph nodes were co-cultured in triplicate at 3×10⁵ cells/well with media alone (RPMI-1640, 10% FBS, 2 mM L-glutamine, 25 mM HEPES, 0.1 mM non-essential amino acids, 100 U/ml Penicillin/0.1 mg/ml streptomycin) (negative control), or with 0.5 μg/ml, 2.5 μg/ml, or 5 μg/ml of baculoviral purified Pak6 or CAMK2N1 proteins, or with 5 ng/ml of Staphylococcus aureus enterotoxin A (SEA) (Sigma) (positive control) for four days at 37°C. Cells were pulsed with 1 mCi/well of [3H]-thymidine (16), harvested after 24 h, and DNA was collected onto a membrane filter. Radioactive counts per min were determined with a MicroBeta counter (Perkin Elmer). Assays were performed in triplicate wells. Animal care was performed in accordance with institutional guidelines. Immunized mice were monitored for clinical signs of autoimmunity including manifestation rash and weight loss. Normal tissues including prostate, seminal vesicles, testis, liver, and brain were assessed for inflammatory infiltrates by H&E staining.
ELISPOT
2 × 10⁵ PBMCs from spleen cells of immunized mice as described for proliferation assay were plated in media per well in triplicates in MultiScreen filter plates (Millipore) coated with 1 μg/ml capture anti-human IFN-γ antibodies in PBS and previously blocked with media. Cells were incubated at 37°C for 24 h. Plates were washed with PBS, incubated overnight with 1 μg/ml of detection anti-human IFN-γ biotin conjugated antibodies in PBS and detected with streptavidin-horse radish peroxidase and AEC substrate (BD Biosciences). Assays were performed in triplicate wells.
Tumor challenge
C57BL/6 and FVB mice (5 mice in each group) were immunized with CFA plus PBS and CFA plus Pak6 (100 mg) twice, fourteen days apart. 2 × 10⁵ Tramp cells for C57BL/6 or 2 × 10⁵ Myc-Cap cells for FVB mice were injected subcutaneously into their flank fourteen days after the last immunization. Tumor growth was monitored three times a week. Per institutional protocol, mice were euthanized when the tumor size reached 2 cm in maximal dimension.
Results
Modulation of autoantibody responses with CTLA-4 blockade based treatment
Subjects were classified as clinical responders or non-responders by whether the individual experienced a 50% or greater decline in their serum PSA levels (Supplementary Table 2). Clinical responders had stable bone scans on treatment, and one of the clinical responders had regression of liver metastasis (8). The median time to PSA level progression in clinical responders was 416 days (range 336-2000+ days) compared with 103 days (range 73-176) in the non-responders. Pre-and post-treatment sera of the treated study subjects were used to screen for IgG antibodies that bind to high-density protein arrays containing 8274 unique recombinant human proteins that were spotted in duplicate on glass slides. These protein arrays have been validated for detecting antibodies to known and potentially novel tumor-associated antigens (17). We observed that anti-CTLA-4 and GM-CSF treatment modulate antibody responses to a variety of different autoantigens. Antibody responses to specific antigens are both up- and down-modulated following treatment. The intensity values were quantile-normalized, log2 transformed, and centered with respect to the global median. Scatter plots of the fluorescence intensities were analyzed comparing pre-treatment to post-treatment levels for each patient (Fig. 1B and 1C). Up-modulated and down-modulated antibody responses between pre-and post-treatment antibody intensities were compared between responders and non-responders. Clinical responders have a higher frequency of four-fold up-modulated antibodies with treatment compared to the non-responders (Two-sided Wilcoxon rank sum test, p < 0.05), whereas there is no significant difference in down-modulated antibodies between the two groups (Fig. 1D).
Detection of patient-specific and shared autoantibody responses induced by treatment
Unsupervised hierarchical clustering of the patients and antigens were carried out with Pearson correlation as the distance metric and complete linkage as the agglomeration method (Fig. 2A). Pre-and post-treatment sera from individual patients cluster together, indicating that modulated immune responses are of a lesser magnitude than differences between patients. Interestingly, the antibody profiles of the clinical responders 19, 20, and 36 cluster together while responders 24 and 33 do not. The majority of the immune responses (both up and down-modulated antibodies) are unique for each patient, but there are also antigens shared across some patients (Fig. 2B). Of the up-modulated antibodies with pre-versus post-differences greater than four fold, 18.5% of the antigens induced in patients 19 and 20 are shared. The overlap between other responders is considerably less. The overlap between the responders versus the non-responders is minimal. The list of shared antigens to which antibodies are up-modulated by four fold is shown in Table I. Interestingly, most of these antigens with antibody responses represent cell cycle-related or nuclear antigens, and approximately 30% of the antigens identified are kinases. Of the down-modulated antibodies, the antigens detected are largely unique between patients with very few shared antigens.
FIGURE 2. Profiling of antibody responses in cancer patients to CTLA-4 blockade and GM-CSF with protein microarrays.

(A) Unsupervised clustering of median centered log2 transformed and normalized fluorescence intensities in pre-treatment and post-treatment sera of 11 evaluable patients binding to proteins spotted on the arrays. Responders are highlighted in red and non-responders in black. (B) Venn diagram showing the number of up-modulated antibodies that are shared (shown by number in overlaps) or are unique in the 11 patients. Responders are represented by pink circles and non-responders in blue. Sizes of circles approximate the number of antigens.
Table I. List of shared antigens up modulated by 4 folds with anti-CTLA-4 and GM-CSF treatment.
| Patients | No. of shared antigens |
Entrez Gene ID |
Gene Symbol |
Description |
|---|---|---|---|---|
| 19 and 20 | 10 | 558 4916 695 53944 4350 1454 904 56924 1455 3815 |
AXL NTRK3 BTK CSNK1G1 MPG CSNK1E CCNT1 PAK6 CSNK1G2 KIT |
AXL receptor tyrosine kinase Neurotrophic tyrosine kinase, receptor, type 3 Bruton agammaglobulinemia tyrosine kinase Casein kinase 1, gamma 1 N-methylpurine-DNA glycosylase Casein kinase 1, epsilon Cyclin T1 p21 protein (Cdc42/Rac)-activated kinase 6 Casein kinase 1, gamma 2 v-kit Hardy-Zuckerman 4 feline sarcoma viral oncogene homolog |
| 19 and 24 | 2 | 199 1745 |
AIF1 DLX1 |
Allograft inflammatory factor 1 Distal-less homeobox 1 |
| 20 and 33 | 2 | 4145 5347 |
MATK PLK1 |
Megakaryocyte-associated tyrosine kinase polo-like kinase 1 |
| 20 and 24 | 1 | 1453 | CSNK1D | Casein kinase 1, delta |
| 24 and 33 | 1 | 121355 | GTSF1 | Gametocyte specific factor 1 |
| 24 and 36 | 1 | 51155 | HN1 | Hematological and neurological expressed 1 |
| 24 and 21 | 1 | 29995 | LMCD1 | LIM and cysteine-rich domains 1 |
| 24 and 22 | 1 | 90011 | KIR3DX1 | Killer cell immunoglobulin-like receptor, three domains, X1 |
| 36 and 23 | 1 | 81442 | OR6N2 | Olfactory receptor, family 6, subfamily N, member 2 |
| 36 and 34 | 1 | 116496 | C1orf24 | Chromosome 1 open reading frame 24 |
| 22 and 23 | 1 | 2556 | GABRA3 | Gamma-aminobutyric acid A receptor, alpha 3 |
| 22 and 28 | 1 | 389125 | MUSTN1 | Musculoskeletal, embryonic nuclear protein 1 |
Antibodies distribution induced by anti-CTLA-4 and GM-CSF
To examine whether the antibody responses enhanced by treatment are derived from pre-existing immune responses or from de novo responses, the raw fluorescence intensity values of both pre-treatment sera and post-treatment sera were first plotted in order of increasing intensities for each array (Supplementary Fig. 1A, B). Normal mixture modeling with estimation-maximization (EM) as implemented in mclust package in R (14) was applied to the raw intensities for each pre-treatment and post-treatment array to identify the boundary between antigens to which antibodies are present at baseline (i.e. preexisting) and antigens to which antibodies are not present at baseline (i.e. non-preexisting). Antibodies that were up-modulated by two fold in the post-treatment serum with respect to the pre-treatment serum were distributed either to the non-preexisting group or the preexisting group (Fig. 3A, left panel). Odds ratios were then calculated to assess for the association between up-modulated antibody responses and preexisting antibody status compared to non-preexisting (Fig. 3A, right panel). A positive odds ratio denotes a higher probability of developing antibodies to an antigen with a pre-treatment preexisting antibody response. Two-sided Fisher’s exact tests were performed for each patient, and p-values were adjusted for multiple comparisons with the Bonferroni method. All the clinical responders and four out of six of the non-responders have significant up-modulation of antibodies that were preexisting compared to not, indicating that the up-modulated antibodies by CTLA-4 blockade are more likely to be preexisting. Moreover, the clinical responders have a higher median odds ratio (39.6) compared to the clinical non-responders (12.2), indicating that clinical responders were more likely to have up-modulated antibody responses to antigens that were preexisting.
FIGURE 3. Association between up-modulated antibodies with preexisting or non-preexisting antibody responses.

Normal mixture modeling with estimation-maximization (EM) was used to define the boundary for determining the presence or absence of preexisting antibodies. (A) The left panel shows the number of two fold up-modulated antibodies in the post-treatment serum to antigens where there are no preexisting antibodies (light grey) and to antigens where there are preexisting antibodies (dark grey) in the pre-treatment serum for each patient. The right pane shows log odds ratios comparing two fold up modulation for preexisting versus non-preexisting antibody groups for each patient. Significant log odds ratio values are shown as solid circles (significance determined as Bonferroni adjusted p-value < 0.05 from performing 2-sided Fisher’s exact test for each patient). (B) Interaction plot using multiplicative poisson regression model with the number of antibodies up-modulated, clinical response status and pre-treatment preexisting or not status as dependent variables. Response main effect p-value: 2.6e-08; pre-treatment preexisting main effect p-value: 1.6e-05; and interaction p-value: 1.8e-06.
To determine if there is any interaction between clinical response and enhancement of antibody response to antigens that were preexisting, a multiplicative poisson regression model was fitted with the number of antibodies up-modulated,clinical response status and pre-treatment preexisting or not status as dependent variables. With this analysis, there is a significant interactive effect between clinical response and preexisting antibodies (p-values: response main effect 2.6e-08, preexisting main effect 1.6e-05, interaction 1.8e-06) (Fig. 3B). The interaction plot shows that the responders have a higher number of antibodies that were preexisting compared to the non-responders and the number of up-modulated antibodies that were non-preexisting was similar for both responders and non-responders. For four fold increase in up-modulated antibodies, the interaction showed the same trend as two fold up-modulation of antibodies (Supplementary Fig. 1D, E).
Induced immune responses to an antigen associated with clinical response
To examine whether any of the shared antigens could be relevant for tumor recognition, we focused on patients 19 and 20, who were clinical responders and shared the highest number of antigens. In order to prioritize the candidates for further study, up-modulated antibody responses were further sorted based upon their post-treatment intensities to look for common candidates that have the highest signal intensities. One of these shared antigens is p21-activated kinase 6 (Pak6), a 75-kDa protein with a predicted N-terminal Cdc42/Rac interactive binding domain and a C-terminal kinase domain (18). Increases in antibody intensities to Pak6 were observed while antibody intensities to the control antigen Influenza A H3N2 were not modulated with treatment (Fig. 4A). Detection of induced antibodies to Pak6 protein could also be detected by ELISA (Supplementary Fig. 1F).
FIGURE 4. Detection of antibody and T cell responses to the candidate antigen Pak6.

(A) Images of protein arrays showing levels of human IgG binding to Pak6 protein in the pre-treatment and post-treatment sera of clinical responders (patients 19 and 20). Control proteins and antibodies are also shown. Numbers shown below the Pak6 and influenza A antigen are the median-centered log2 transformed and normalized fluorescence values. (B) Flow cytometry of pre-treatment and post-treatment PBMCs from clinical responders (patients 19 and 20) and flow cytometry of post-treatment PBMCs from a clinical non-responder (patient 23) that had been incubated with media alone, Pak6 protein, CAMK protein, or PMA plus ionomycin for 48 h and then stained for CD4 and intracellular IFN-γ and IL-17. CD4+ T cells were gated upon and analyzed for cytokine production. Axes are log10 fluorescence of IFN-γ (y axis) and IL-17 (x axis) staining. The number in each quadrant indicates the percentage of cells in that quadrant.
Antigen specific CD4+ T cells responses to Pak6 were assessed ex vivo from cryopreserved peripheral blood mononuclear cells (PBMCs).. As shown in Fig. 4B, patients 19 and 20 (both clinical responders) have increased percentage of IFN-γ producing CD4+ T cells post-treatment when co-incubated with Pak6, but not with another baculoviral purified protein, calcium/calmodulin-dependent protein kinase (CAMK). IL-17 or IL-4 production in response to these antigens was not detected. No T cell response is observed with PBMCs from patient 23 (a clinical non-responder) to Pak6. These results show that antigen-specific T cells responses to antigens identified by our antibody screen can also be enhanced following treatment with CTLA-4 blockade.
Western blotting and immunohistochemical staining was performed to assess Pak6 expression in prostate cancers. Compared to two immortalized, non-tumorigenic, human prostate epithelial cell lines, PWR-1E (19) and RWPE (20), which expressed Pak6, we observed that Pak6 expression was higher in several prostate cancer cell lines, such as PC3 and CWR22, was similar for DU145, and was lower in LNCAP (Fig.5A). Expression of Pak6 is thus variable in prostate cancer cell lines suggesting aberrant regulation of the protein in cancer cells. Expression of Pak6 was also observed in immunohistochemical staining of 16 primary human prostate tumors as has been previously observed for prostate tumors and the prostate tumor biopsy from patient 20 similarly demonstrated a high level of expression of Pak6 (Fig. 5B). Prostate biopsies were not available from patient 19.
FIGURE 5. Expression and localization of Pak6 in prostate cancer.
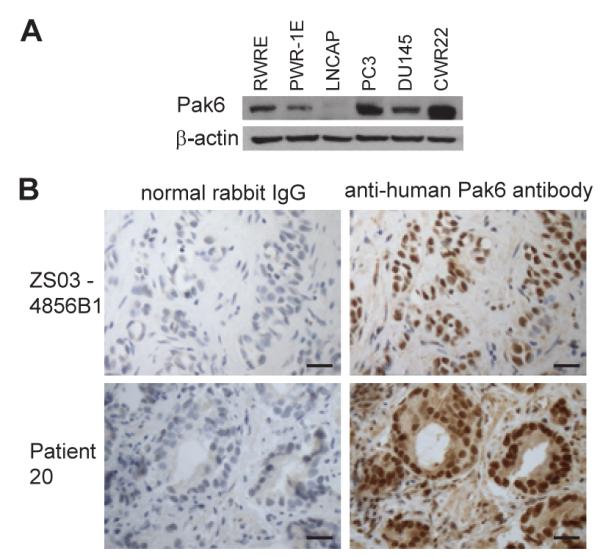
(A) Western blots of prostate cancer cell lines (LNCAP, PC3, DU145 and CWR22) and human prostate epithelial cell lines (PWR-1E and RWPE) carried out with anti-Pak6 and anti-β-actin antibody. (B) Immunohistochemistry of responder patient 20’s prostate tumor biopsy and a representative prostate tumor with anti-Pak6 antibodies and with control rabbit IgG are shown. Scale bar represents 50 μm.
Immunization with Pak6 protects mice to tumor challenge
To determine whether Pak6 can be immunogenic in vivo, we immunized mice with recombinant human Pak6 mixed with complete Freund’s adjuvant (CFA). Immunization with a xenogeneic homologue may enhance immunogenicity to self-antigens (21). Human Pak6 shares 92% protein homology with mouse Pak6. While spontaneous immune responses to Pak6 were not detected, immunization with recombinant purified human Pak6 protein led to the generation of Pak6 specific antibodies (Fig. 6A) and proliferative T cell responses to human Pak6 protein (Fig. 6B). IFN-γ T cell responses to both human and mouse Pak6 proteins were also observed with splenocytes from mice immunized with human Pak6 (Supplementary Fig. 2). Mice did not develop any apparent toxicity with this immunization, including signs of autoimmunity.
FIGURE 6. Immunogenicity and anti-tumor activity of Pak6 immunization.

(A) Western blots carried out with sera from C57BL/6 and FVB mice immunized twice with PBS plus CFA or with human Pak6 plus CFA (3 mice/group. (B) Proliferation assays carried out with inguinal lymph nodes cells pooled from immunized C57BL/6 and FVB mice incubated with media alone or with the protein as shown. Concentrations are in μg/ml. Proliferation was measured as radioactive counts per min (CPM) of [3H]-thymidine incorporation. Error bars denote ± standard deviations of triplicate wells. (C) Kaplan-Meier survival curve of tumor challenge for C57BL/6 and FVB mice immunized twice with PBS plus CFA or human Pak6 plus CFA (5 mice/group) and challenged 14 days later with Tramp cells. Tumors were measured three times a week and mice were sacrificed when the tumor size reached 2 cm per institutional guidelines. p-values were calculated by using the log rank test (SPSS, IBM). (*) denotes a significant p-value < 0.05.
To assess whether inducing an immune response to Pak6 can lead to antitumor activity, we again immunized mice with either PBS or Pak6 protein and then challenged these mice with syngeneic prostate cancer cell lines. Fourteen days after the second immunization, treated C57BL/6 mice were challenged with 2×10⁵ Tramp mouse prostate cancer cells (22), and treated FVB mice were injected with 2×10⁵ Myc-Cap mouse prostate cancer cells (23). Both cell lines expressed endogenous mouse Pak6. Immunization with Pak6 induces anti-tumor responses in both the Tramp and Myc-Cap models of prostate cancer (Fig. 6C). These results indicate that immunity to Pak6 can contribute to anti-tumor effects in vivo against prostate cancer cells expressing endogenous mouse Pak6.
Discussion
CTLA-4 blockade is currently being evaluated clinically in many different solid and hematologic malignancies. Treatment with anti-CTLA-4 antibodies presumably potentiates immunosurveillance to endogenous tumor antigens by relieving a crucial immune checkpoint. However, the specific endogenous antigen response has been difficult to define, particularly in the absence of a co-administered vaccine where the vaccine antigens may be known. Nevertheless CTLA-4 blockade can induce clinical responses in the absence of a vaccine. None of our patients received an administered tumor vaccine as part of their treatment, so their clinical effects must be dependent on endogenous antigens. By using protein microarrays representing approximately one third of the human proteome, we were able to profile the antibody responses induced with treatment to a broad spectrum of autoantigens. Moreover, a significant proportion of patients clinically responded to our treatment allowing us to examine whether antigen-specific responses could distinguish the clinical responders from non-responders.
Based upon these antibody responses, clinical responders developed a broader immune response as seen by the induced antibodies to a greater number of endogenous antigens compared to the non-responders. This difference was observed at four fold but not at two fold up-modulation of antibodies indicating that the induced responses were also at higher intensities for the responders compared to the non-responders. The modulated antibody responses were quite diverse, and there was very little overlap between the antigens identified in responders versus the non-responders. These results show that patients who can clinically respond to treatment may also be immunologically distinct from non-responders based on their autoantibody profiles. These differences could reflect the capacity of tumors in different patients to avoid immunosurveillance. Alternatively, the clinical responders may have tumors that are inherently more immunogenic or may have differing levels of tumor associated immunosuppression. The majority of the antigens are unique for each patient, which could also reflect the diversity of their T and B cell repertoires and/or the heterogeneity of antigens expressed in prostate tumors. Although common pathways could be affected in cancer, different genetic alterations are observed in cancer patients (24, 25), which can give rise to individualized antigenic milieu. Therefore, by modulating the immune system to recognize patient specific endogenous antigens, CTLA-4 blockade could represent a form of personalized immunotherapy.
Another unresolved question regarding the treatment’s mechanism of action is whether CTLA-4 blockade enhances pre-existing immune responses, or whether the treatment potentiates de novo antigen-specific responses. In all of our patients, we did not see any modulation of antibody responses to the control antigen Influenza A H3N2, supporting the notion that the treatment-induced modulation of antibodies reflects the antigen milieu in the host. Antibody responses were in fact induced to antigens both with and without detectable preexisting antibodies prior to treatment. This is exemplified with Pak6, to which patient 19 had low levels of antibody prior to treatment while patient 20 had undetectable levels prior to treatment. Interestingly, clinical responders were more likely than non-responders to generate antibodies against antigens to which preexisting antibodies could be detected. These results suggest that induction of preexisting rather than de novo (non-preexisting) immune responses may be important in generating antitumor activity in CTLA-4 blockade therapy. With one of the clinical responders (patient 19), detectable preexisting IgG to Pak6 could be detected, but no T cell response to Pak6 could be detected at baseline. Following treatment, a CD4 T cell response to Pak6 was induced coinciding with an enhancement of IgG responses. These results would indicate that an immune response to Pak6 was generated spontaneously in the patient, but was subsequently dampened perhaps by tumor-induced immunosuppression. Nevertheless, relieving a crucial immunologic checkpoint with CTLA-4 blockade may be sufficient to recover immune responses to such tumor associated antigens.
Antibodies that were down-modulated were also detected in CTLA-4 blockade therapy. However, the number of down-modulated antibodies between the responders and non-responders were not significantly different. Total levels of IgG were not significantly changed with treatment, so these changes could not be due to dilution. However, the mechanism for down-modulation of antibodies by CTLA-4 blockade is unclear at present.
Most of the antigens with induced autoantibodies following treatment were intracellular proteins. Presumably, immune responses could have been initiated to these antigens as they are released from dying cells, especially since tumor cells have a propensity for increased cell turnover as well as for apoptosis and necrosis (26). All of our patients received and clinically progressed on androgen deprivation therapy, which would have also induced cancer cell death and release of antigens. However, there may be insufficient danger signals to drive an effective immune response in the absence of CTLA-4 blockade. The antigen that we focused upon, Pak6, could be considered a novel tumor-associated antigen. Pak6 is expressed in prostate cancer and is known to co-translocate into the nucleus with androgen receptor (AR) in response to androgen and inhibits the transcriptional activity of AR (18). Alterations in Pak6 itself or in the regulation and expression of Pak6 could render Pak6 more immunogenic. Indeed, missense mutations have already been detected in Pak6 in the prostate cancer cell lines PC3 and LAPC9 as well as in primary prostate cancer (MSKCC Prostate Oncogenome Project, http://cbio.mskcc.org/prostate-portal/). Pak6 has to be recognized by T cells to mediate anti-tumor effects. As we have demonstrated, Pak6-specific T cell responses are induced in the immunized mice, and Pak6-specific T cell responses could be detected directly in the post-treatment blood of the clinical responders who have induced antibody responses to this antigen. The patients’ reactive T cells produced IFN-γ to Pak6 that was consistent with a Th1 response and were of a magnitude beyond what has been spontaneously detected with previously described prostate-associated antigens (27).
Whether these autoantigens represent immune targets that can mediate antitumor immunity or represent bystander antigens resulting from tumor cell death in human remains a critical question. Nevertheless, we found that Pak6 immunization can lead to tumor protection in both the Myc-Cap and Tramp transplantable models of prostate cancer, indicating that inducing immunity to such a self-protein can in fact lead to antitumor responses. However, the protection afforded by Pak6 immunization was not complete, suggesting that immune recognition of other antigens can also contribute to anti-tumor responses. Knockdown of Pak6 with siRNA has been shown to inhibit prostate cancer growth in nude mice (28) and increase radiosensitivity of prostate cancer cell lines (29), further supporting Pak6 as a viable target for cancer therapy.
While our patient cohort is relatively small, the number of clinical responses we observed provided a unique opportunity to characterize how the breadth of the antigen immune response induced by treatment is associated with clinical outcome. Our results with Pak6 represent only one of the antigens that we have identified with our approach. Nevertheless, immune responses to more than one cancer antigen will likely be required for maximal efficacy. As more treated patients are analyzed with this antibody profiling, other novel antigens will undoubtedly be identified including additional shared targets. Moreover, this approach may provide us with an immunologic perspective not only into molecular aberrations in these tumors, but also the heterogeneity of these alterations between patients. Alternatively, patients who developed treatment-induced immune-related adverse events may also provide unique opportunities to perhaps identify relevant autoantigens that might mediate these side effects. We did not see specific toxicities (e.g. only three patients had diarrhea) at sufficient frequency to assess for these associations. Nevertheless, defining an immune profile that is associated with specific side effects could also allow for improved patient selection for these immune therapies, especially as ipilimumab is more widely used. Finally, understanding the nature and targets of the adaptive immune response elicited by immune checkpoint blockade could result in the development of improved multi-targeted vaccines, which could direct the immune response more specifically to the tumor, thus increasing the therapeutic efficacy and perhaps reducing the frequency of immune mediated side effects seen with immunotherapy.
Supplementary Material
Acknowledgements
We would like to acknowledge the UCSF Tissue Core for sectioning; Loretta Chan of the UCSF Mt. Zion IHC Core Laboratory for immunohistochemistry staining; Vivian Huey from the Department of Hematology/Oncology for obtaining patients’ tissue samples; and Vivian Weinberg from the UCSF Biostatistics and Computational Biology Core Facility for her assistance.
This work was supported by National Cancer Institute R01-CA136753 (V.D., and L.F), Peter Michael Foundation (S.K.), UCSF Prostate SPORE (J.S., E.J.S., and L.F), and Prostate Cancer Foundation (Y.H. and E.J.S.). Equipment support was provided by the UCSF Clinical and Translational Science Institute NIH NCRR UL1 RR024131.
Footnotes
Disclosures
The authors declare that they have no conflicts of interest.
References
- 1.Greenwald RJ, Freeman GJ, Sharpe AH. The B7 family revisited. Annu Rev Immunol. 2005;23:515–548. doi: 10.1146/annurev.immunol.23.021704.115611. [DOI] [PubMed] [Google Scholar]
- 2.Brucher J, Domke I, Schroder CH, Kirchner H. Experimental infection of inbred mice with herpes simplex virus. VI. Effect of interferon on in vitro virus replication in macrophages. Arch Virol. 1984;82:83–93. doi: 10.1007/BF01309370. [DOI] [PubMed] [Google Scholar]
- 3.Leach DR, Krummel MF, Allison JP. Enhancement of antitumor immunity by CTLA-4 blockade. Science. 1996;271:1734–1736. doi: 10.1126/science.271.5256.1734. [DOI] [PubMed] [Google Scholar]
- 4.Link KA, Balasubramaniam S, Sharma A, Comstock CE, Godoy-Tundidor S, Powers N, Cao KH, Haelens A, Claessens F, Revelo MP, Knudsen KE. Targeting the BAF57 SWI/SNF subunit in prostate cancer: a novel platform to control androgen receptor activity. Cancer Res. 2008;68:4551–4558. doi: 10.1158/0008-5472.CAN-07-6392. [DOI] [PMC free article] [PubMed] [Google Scholar]
- 5.Hernandez J, Ko A, Sherman LA. CTLA-4 blockade enhances the CTL responses to the p53 self-tumor antigen. J Immunol. 2001;166:3908–3914. doi: 10.4049/jimmunol.166.6.3908. [DOI] [PubMed] [Google Scholar]
- 6.Fasso M, Waitz R, Hou Y, Rim T, Greenberg NM, Shastri N, Fong L, Allison JP. SPAS-1 (stimulator of prostatic adenocarcinoma-specific T cells)/SH3GLB2: A prostate tumor antigen identified by CTLA-4 blockade. Proc Natl Acad Sci U S A. 2008;105:3509–3514. doi: 10.1073/pnas.0712269105. [DOI] [PMC free article] [PubMed] [Google Scholar]
- 7.Yuan J, Gnjatic S, Li H, Powel S, Gallardo HF, Ritter E, Ku GY, Jungbluth AA, Segal NH, Rasalan TS, Manukian G, Xu Y, Roman RA, Terzulli SL, Heywood M, Pogoriler E, Ritter G, Old LJ, Allison JP, Wolchok JD. CTLA-4 blockade enhances polyfunctional NY-ESO-1 specific T cell responses in metastatic melanoma patients with clinical benefit. Proc Natl Acad Sci U S A. 2008;105:20410–20415. doi: 10.1073/pnas.0810114105. [DOI] [PMC free article] [PubMed] [Google Scholar]
- 8.Fong L, Kwek SS, O’Brien S, Kavanagh B, McNeel DG, Weinberg V, Lin AM, Rosenberg J, Ryan CJ, Rini BI, Small EJ. Potentiating endogenous antitumor immunity to prostate cancer through combination immunotherapy with CTLA4 blockade and GM-CSF. Cancer Res. 2009;69:609–615. doi: 10.1158/0008-5472.CAN-08-3529. [DOI] [PubMed] [Google Scholar]
- 9.Jinushi M, Hodi FS, Dranoff G. Therapy-induced antibodies to MHC class I chain-related protein A antagonize immune suppression and stimulate antitumor cytotoxicity. Proc Natl Acad Sci U S A. 2006;103:9190–9195. doi: 10.1073/pnas.0603503103. [DOI] [PMC free article] [PubMed] [Google Scholar]
- 10.Armitage JO. Emerging applications of recombinant human granulocyte-macrophage colony-stimulating factor. Blood. 1998;92:4491–4508. [PubMed] [Google Scholar]
- 11.Markowicz S, Engleman EG. Granulocyte-macrophage colony-stimulating factor promotes differentiation and survival of human peripheral blood dendritic cells in vitro. J Clin Invest. 1990;85:955–961. doi: 10.1172/JCI114525. [DOI] [PMC free article] [PubMed] [Google Scholar]
- 12.Hurwitz AA, Yu TF, Leach DR, Allison JP. CTLA-4 blockade synergizes with tumor-derived granulocyte-macrophage colony-stimulating factor for treatment of an experimental mammary carcinoma. Proc Natl Acad Sci U S A. 1998;95:10067–10071. doi: 10.1073/pnas.95.17.10067. [DOI] [PMC free article] [PubMed] [Google Scholar]
- 13.Eisen MB, Spellman PT, Brown PO, Botstein D. Cluster analysis and display of genome-wide expression patterns. Proc Natl Acad Sci U S A. 1998;95:14863–14868. doi: 10.1073/pnas.95.25.14863. [DOI] [PMC free article] [PubMed] [Google Scholar]
- 14.Team RDC. R: A Language and Environment for Statistical Computing. R Foundation for Statistical Computing; Vienna, Austria: 2005. [Google Scholar]
- 15.Gentleman RC, Carey VJ, Bates DM, Bolstad B, Dettling M, Dudoit S, Ellis B, Gautier L, Ge Y, Gentry J, Hornik K, Hothorn T, Huber W, Iacus S, Irizarry R, Leisch F, Li C, Maechler M, Rossini AJ, Sawitzki G, Smith C, Smyth G, Tierney L, Yang JY, Zhang J. Bioconductor: open software development for computational biology and bioinformatics. Genome Biol. 2004;5:R80. doi: 10.1186/gb-2004-5-10-r80. [DOI] [PMC free article] [PubMed] [Google Scholar]
- 16.Biragyn A, Ruffini PA, Leifer CA, Klyushnenkova E, Shakhov A, Chertov O, Shirakawa AK, Farber JM, Segal DM, Oppenheim JJ, Kwak LW. Toll-like receptor 4-dependent activation of dendritic cells by beta-defensin 2. Science. 2002;298:1025–1029. doi: 10.1126/science.1075565. [DOI] [PubMed] [Google Scholar]
- 17.Hudson ME, Pozdnyakova I, Haines K, Mor G, Snyder M. Identification of differentially expressed proteins in ovarian cancer using high-density protein microarrays. Proc Natl Acad Sci U S A. 2007;104:17494–17499. doi: 10.1073/pnas.0708572104. [DOI] [PMC free article] [PubMed] [Google Scholar]
- 18.Yang F, Li X, Sharma M, Zarnegar M, Lim B, Sun Z. Androgen receptor specifically interacts with a novel p21-activated kinase, PAK6. J Biol Chem. 2001;276:15345–15353. doi: 10.1074/jbc.M010311200. [DOI] [PubMed] [Google Scholar]
- 19.Webber MM, Bello D, Kleinman HK, Wartinger DD, Williams DE, Rhim JS. Prostate specific antigen and androgen receptor induction and characterization of an immortalized adult human prostatic epithelial cell line. Carcinogenesis. 1996;17:1641–1646. doi: 10.1093/carcin/17.8.1641. [DOI] [PubMed] [Google Scholar]
- 20.Webber MM, Bello D, Kleinman HK, Hoffman MP. Acinar differentiation by non-malignant immortalized human prostatic epithelial cells and its loss by malignant cells. Carcinogenesis. 1997;18:1225–1231. doi: 10.1093/carcin/18.6.1225. [DOI] [PubMed] [Google Scholar]
- 21.Fong L, Ruegg CL, Brockstedt D, Engleman EG, Laus R. Induction of tissue-specific autoimmune prostatitis with prostatic acid phosphatase immunization: implications for immunotherapy of prostate cancer. J Immunol. 1997;159:3113–3117. [PubMed] [Google Scholar]
- 22.Foster BA, Gingrich JR, Kwon ED, Madias C, Greenberg NM. Characterization of prostatic epithelial cell lines derived from transgenic adenocarcinoma of the mouse prostate (TRAMP) model. Cancer Res. 1997;57:3325–3330. [PubMed] [Google Scholar]
- 23.Watson PA, Ellwood-Yen K, King JC, Wongvipat J, Lebeau MM, Sawyers CL. Context-dependent hormone-refractory progression revealed through characterization of a novel murine prostate cancer cell line. Cancer Res. 2005;65:11565–11571. doi: 10.1158/0008-5472.CAN-05-3441. [DOI] [PubMed] [Google Scholar]
- 24.Jones S, Zhang X, Parsons DW, Lin JC, Leary RJ, Angenendt P, Mankoo P, Carter H, Kamiyama H, Jimeno A, Hong SM, Fu B, Lin MT, Calhoun ES, Kamiyama M, Walter K, Nikolskaya T, Nikolsky Y, Hartigan J, Smith DR, Hidalgo M, Leach SD, Klein AP, Jaffee EM, Goggins M, Maitra A, Iacobuzio-Donahue C, Eshleman JR, Kern SE, Hruban RH, Karchin R, Papadopoulos N, Parmigiani G, Vogelstein B, Velculescu VE, Kinzler KW. Core signaling pathways in human pancreatic cancers revealed by global genomic analyses. Science. 2008;321:1801–1806. doi: 10.1126/science.1164368. [DOI] [PMC free article] [PubMed] [Google Scholar]
- 25.Taylor BS, Schultz N, Hieronymus H, Gopalan A, Xiao Y, Carver BS, Arora VK, Kaushik P, Cerami E, Reva B, Antipin Y, Mitsiades N, Landers T, Dolgalev I, Major JE, Wilson M, Socci ND, Lash AE, Heguy A, Eastham JA, Scher HI, Reuter VE, Scardino PT, Sander C, Sawyers CL, Gerald WL. Integrative genomic profiling of human prostate cancer. Cancer Cell. 18:11–22. doi: 10.1016/j.ccr.2010.05.026. [DOI] [PMC free article] [PubMed] [Google Scholar]
- 26.Tesniere A, Panaretakis T, Kepp O, Apetoh L, Ghiringhelli F, Zitvogel L, Kroemer G. Molecular characteristics of immunogenic cancer cell death. Cell Death Differ. 2008;15:3–12. doi: 10.1038/sj.cdd.4402269. [DOI] [PubMed] [Google Scholar]
- 27.McNeel DG, Nguyen LD, Ellis WJ, Higano CS, Lange PH, Disis ML. Naturally occurring prostate cancer antigen-specific T cell responses of a Th1 phenotype can be detected in patients with prostate cancer. Prostate. 2001;47:222–229. doi: 10.1002/pros.1066. [DOI] [PubMed] [Google Scholar]
- 28.Wen X, Li X, Liao B, Liu Y, Wu J, Yuan X, Ouyang B, Sun Q, Gao X. Knockdown of p21-activated kinase 6 inhibits prostate cancer growth and enhances chemosensitivity to docetaxel. Urology. 2009;73:1407–1411. doi: 10.1016/j.urology.2008.09.041. [DOI] [PubMed] [Google Scholar]
- 29.Zhang M, Siedow M, Saia G, Chakravarti A. Inhibition of p21-activated kinase 6 (PAK6) increases radiosensitivity of prostate cancer cells. Prostate. 70:807–816. doi: 10.1002/pros.21114. [DOI] [PMC free article] [PubMed] [Google Scholar]
Associated Data
This section collects any data citations, data availability statements, or supplementary materials included in this article.