

Abstract
BACKGROUND AND PURPOSE
Activation of the intrarenal renin-angiotensin system (RAS) and increased renal medullary hydrogen peroxide (H2O2) contribute to hypertension. We examined whether H2O2 mediated hypertension and intrarenal RAS activation induced by angiotensin II (Ang II).
EXPERIMENTAL APPROACH
Ang II (200 ng·kg−1·min−1) or saline were infused in Sprague Dawley rats from day 0 to day 14. Polyethylene glycol (PEG)-catalase (10 000 U·kg−1·day−1) was given to Ang II-treated rats, from day 7 to day 14. Systolic blood pressure was measured throughout the study. H2O2, angiotensin AT1 receptor and Nox4 expression and nuclear factor-κB (NF-κB) activation were evaluated in the kidney. Plasma and urinary H2O2 and angiotensinogen were also measured.
KEY RESULTS
Ang II increased H2O2, AT1 receptor and Nox4 expression and NF-κB activation in the renal medulla, but not in the cortex. Ang II raised plasma and urinary H2O2 levels, increased urinary angiotensinogen but reduced plasma angiotensinogen. PEG-catalase had a short-term antihypertensive effect and transiently suppressed urinary angiotensinogen. PEG-catalase decreased renal medullary expression of AT1 receptors and Nox4 in Ang II-infused rats. Renal medullary NF-κB activation was correlated with local H2O2 levels and urinary angiotensinogen excretion. Loss of antihypertensive efficacy was associated with an eightfold increase of plasma angiotensinogen.
CONCLUSIONS AND IMPLICATIONS
The renal medulla is a major target for Ang II-induced redox dysfunction. H2O2 appears to be the key mediator enhancing intrarenal RAS activation and decreasing systemic RAS activity. The specific control of renal medullary H2O2 levels may provide future grounds for the treatment of hypertension.
Keywords: angiotensin II, H2O2, renal medulla, nuclear factor-κB, AT1 receptor, Nox4, angiotensinogen
Introduction
During the last two decades, it has been clearly established that reactive oxygen species (ROS) contribute to the pathophysiology of several diseases, not only by direct toxicity, as initially proposed in the 1950s, but also, and maybe more importantly, by altering signalling pathways that regulate cell and organ functions (Droge, 2002; Jones, 2008). Among ROS, the superoxide anion (O2•−) and hydrogen peroxide (H2O2) have been recognized as major signalling molecules involved in physiological and pathophysiological processes both in experimental models and humans (Ardanaz and Pagano, 2006; Paravicini and Touyz, 2006; Valko et al., 2007). Arterial hypertension is a highly prevalent disease, contributing to an elevated incidence of serious cardiovascular and renal adverse events (Chobanian et al., 2003). However, despite the existence of several antihypertensive drugs, the control of hypertension remains elusive in many patients and is responsible for a high mortality and morbidity worldwide. Besides the problem of non-compliance with medication, the multifactorial nature of the disease and the activation of counterregulatory mechanisms in response to antihypertensive treatment also contribute to this disappointing scenario (Chobanian et al., 2003; Giles, 2006; Ferrario, 2010). Therefore, the development of new therapeutic approaches capable of controlling the multiple processes involved in the pathophysiology of hypertension remains an important and unfulfilled objective.
Emerging evidence suggests that H2O2 is a paracrine mediator of cardiovascular and renal dysfunction (Makino et al., 2003; Ardanaz and Pagano, 2006). Pro-hypertensive effects of H2O2 include increased spinal sympathetic outflow (Lin et al., 2003), increased vasoconstriction (Rodriguez-Martinez et al., 1998; Gao and Lee, 2001; Gao et al., 2003; 2004; Thakali et al., 2006), vascular hypertrophy and hyperplasia (Ardanaz and Pagano, 2006; Sousa et al., 2008), and decreased diuresis and natriuresis (Chen et al., 2003; Asghar et al., 2006). In line with this postulate, catalase, an H2O2-detoxifying enzyme, has been shown to reduce the pressor responses to angiotensin II (Ang II) and noradrenaline (Yang et al., 2003), and to prevent the hypertension induced by the infusion of H2O2 in the renal medulla (Makino et al., 2003). Our group has also demonstrated that vascular and urinary levels of H2O2 are markedly increased in a model of hypertension with activation of the renin–angiotensin system (RAS) and that the treatment with polyethylene glycol (PEG)-catalase prevents the rise in blood pressure and vascular hyperplasia (Sousa et al., 2008).
Although blood pressure control is achieved through the combined action of diverse central and peripheral effector sites, overwhelming evidence suggests that renal dysfunction contributes to the pathogenesis of all forms of hypertension (Cowley et al., 1995). Of note, Ang II-induced hypertension was shown to be primarily mediated by renal angiotensin AT1 receptors (Crowley et al., 2006; receptor nomenclature follows Alexander et al., 2011). In addition, changes within the renal medulla were demonstrated to have an important effect on water and sodium excretion, thereby influencing the long-term control of arterial pressure (Cowley, 2008). Studies in spontaneously hypertensive rats (SHR) also suggested that renal dysfunction begins as subtle alterations in the renal medulla in the absence of changes within the renal cortex (Cowley et al., 1995). Furthermore, gene expression analysis revealed that the renal outer medulla has an increased vulnerability to non-pressor levels of Ang II (Yuan et al., 2003). The RAS is a well-known regulator of sodium and water balance, as well as arterial pressure. Recently, it has been proposed that intrarenal RAS activation plays a major role in the development of hypertension and renal injury, even when there is no clear evidence of increased systemic RAS activity (Kobori et al., 2007).
Ang II activates NADPH oxidases within the blood vessels, kidney and brain, leading to increased generation of ROS, such as O2- and H2O2, which are involved in diverse signalling functions (Garrido and Griendling, 2009). H2O2 activates the transcription factor NF-κB (Morigi et al., 2002; Fardoun et al., 2007; Ungvari et al., 2007), which is known to regulate the expression of several genes involved in sodium homeostasis and blood pressure control, including the gene of angiotensinogen, the precursor of Ang II (Brasier et al., 2000). Interestingly, Ang II-induced hypertension is associated with activation of intrarenal RAS as shown by the increased urinary excretion of angiotensinogen and intrarenal Ang II levels (Kobori et al., 2004). Therefore, this study assessed the contribution of H2O2 to the hypertension and intrarenal RAS activation induced by Ang II. In particular, the effects of Ang II in the renal medulla were compared with those in the renal cortex. Furthermore, as H2O2 acts at many sites of cardiovascular regulation, we tested if PEG-catalase has an antihypertensive therapeutic effect in this model, apart from its previously demonstrated efficacy in preventing the rise in blood pressure induced by RAS activation.
Methods
Animals and experimental design
All animal care and experimental procedures complied with the European Community guidelines for the use of experimental animals (Directive 86/609/EEC and Decision 1999/575/EC). The results of all studies involving animals are reported in accordance with the ARRIVE guidelines for reporting experiments involving animals (McGrath et al., 2010). Male Sprague Dawley rats (250–300 g; 64 animals in total) were used.
This study was divided in three parts.
Part I was designed to evaluate the effects of Ang II infusion (200 ng·kg−1·min−1, s.c. from day 0 to day 14) on systemic and renal markers of redox status and RAS activation. Saline-infused (s.c.) rats (Sham) were used as controls.
In Part II, we assessed the effects of H2O2 neutralization on blood pressure, redox status and RAS activation in Ang II-hypertensive rats. PEG-catalase (10 000 U·kg−1·day−1, i.p. bolus) was given to Ang II-infused rats from day 7 to day 14. Untreated Ang II-infused rats were used as controls. Preliminary experiments demonstrated that PEG-catalase did not affect blood pressure and H2O2 levels in Sham-treated rats.
Part III was designed to evaluate the effect of a 3-day treatment with PEG-catalase (10 000 U.kg−1.day−1, i.p. bolus, from day 7 to day 10) on RAS activation in Sham and Ang II-infused rats. In addition, we analysed the protein expression of Nox4 and also Nox1 at this earlier time point.
Ang II or saline were infused using Alzet osmotic mini-pumps (model 2002; Alza, Palo Alto, CA, USA) implanted under ketamine (60 mg·kg−1) plus medetomidine (0.25 mg·kg−1) (i.p.) anaesthesia. Rats were placed in metabolic cages to allow collection of urine over 24 h. Animals were killed on day 14 (Part I and II) or on day 10 (Part III) under sodium pentobarbitone (60 mg·kg−1, i.p.) anaesthesia. Blood was withdrawn from the left ventricle to heparinized tubes (H2O2 assay) or to EDTA-containing tubes (angiotensinogen assay). Plasma was obtained by centrifugation of blood (10 min at 500×g, at 4°C; H2O2 assay or 20 min at 1000×g, at 4°C; angiotensinogen assay). The kidneys were perfused with saline before excision and then dissected into cortex and total medulla. Samples used for H2O2 measurement were promptly processed. Renal nuclear extracts were immediately prepared before storing at −80°C. The other samples were stored at −80°C until analysis.
Systolic blood pressure
Systolic blood pressure (SBP) was measured in conscious animals by non-invasive (tail-cuff) and invasive (i.a.) methods throughout the study. A photoelectric pulse detector (LE 5000, Letica, Barcelona, Spain) was used for tail-cuff measurements. Five determinations were made each time and the means used for further calculations. All the rats underwent a 7-day training period to adapt to the blood pressure measurement methodology. Direct determinations of SBP were made in some rats from each group by implantation of an indwelling catheter. The rats were anaesthetized with a mixture of ketamine (60 mg·kg−1) and medetomidine (0.25 mg·kg−1) (i.p.), and a polyethylene catheter (PE-10) was placed in the abdominal aorta via the left femoral artery. The distal end was joined to PE-50 tubbing and tunnelled subcutaneously to the dorsum of the neck where it was exteriorized. After a recovery period, the arterial catheter was connected to a pressure transducer (TRA-021, Letica), and blood pressure signals were recorded on a polygraph (Unigraph 2000-5.6, Letica) in conscious, unrestrained animals.
Protein assay
Protein concentration was quantified by the Bio-Rad protein assay.
Evaluation of H2O2 levels
H2O2 was measured using the Amplex Red Hydrogen Peroxide Assay Kit (Molecular Probes, Alfagene, Carcavelos, Portugal). Urinary H2O2 excretion was evaluated in 24-h urine samples as previously described (Sousa et al., 2008). Plasma H2O2 levels were measured in aliquots of the same sample mixed with sodium azide (52 mmol·L−1) to block H2O2 degradation, or with catalase (1000 IU) to remove H2O2 in the plasma. The difference in H2O2 levels between the plasma azide and catalase samples reflects plasma H2O2 production (Lacy et al., 1998; 2000).
The renal medulla or cortex were incubated in oxygenated Krebs-HEPES (composition in mmol L−1 : NaCl 118, KCl 4.5, CaCl2 2.5, MgCl2 1.2, KH2PO4 1.2, Na-HEPES 25, NaHCO3 25 and glucose 5; pH 7.4), at 37°C. Sixty minutes later, H2O2 was measured in the incubation medium. These experiments were also performed in the presence of inhibitors of NADPH oxidase (diphenylene iodonium, DPI, 500 µmol·L−1; apocynin 500 µmol·L−1), xanthine oxidase (oxypurinol, 500 µmol·L−1), NOS (nitro-L-arginine methylester, L-NAME, 500 µmol·L−1) and catalase (aminotriazole, 50 mmol·L−1).
NADPH oxidase activity
Renal medulla or cortex were homogenized in cold HEPES buffer (25 mmol·L−1) containing EDTA (1 mmol·L−1), PMSF (0.5 mmol·L−1) and protease inhibitors (5 µg·mL−1 aprotinin, 5 µg·mL−1 leupeptin and 5 µg·mL−1 pepstatin). Sample homogenates (≍25 µg) were incubated with dihydroethidium (20 µmol·L−1) and salmon testes DNA (0.5 mg·mL−1), with NADPH (1 mmol·L−1) in a microplate, at 37°C for 15 min. Ethidium fluorescence was measured at 475 nm excitation and 610 nm emission using a fluorescence microplate reader (Spectromax Gemini, Molecular Devices, Sunnyvale, CA, USA). Superoxide dismutase (SOD) (2000 IU·mL−1), a O2- detoxifying enzyme, was used to confirm the specificity of the method. To determine whether NADPH oxidase was the source of O2-, an inhibitor of NADPH oxidase (DPI, 500 µmol·L−1) was used. The effect of L-NAME (500 µmol·L−1) was also tested to exclude the possible contribution of endothelial NOS inhibition to the DPI effect. Results were expressed as the DPI-inhibitable NADPH-dependent O2•− generation (fluorescence arbitrary units per min per mg of protein), after subtracting the values obtained in the presence of DPI from the corresponding sample wells in the absence of inhibitors.
Antioxidant enzyme activity
SOD, catalase and glutathione peroxidase (GPx) activities were evaluated in the renal medulla or cortex by microplate spectrophotometric assays as previously described (Sousa et al., 2008).
Analysis of NF-κB activation
Nuclear extracts were prepared as previously described by Dinis-Oliveira et al., (2007). Evaluation of NF-κB activation was carried by a fluorescent electrophoretic mobility shift assay (fEMSA) using Cyano dye Cy5-labelled oligonucleotide duplexes (Metabion International, Martinsried, Germany) as specific probes and an automatic DNA sequencer (ALF-Express DNA Sequencer, Amersham Pharmacia Biotech, Freiburg, Germany) for analysis. The NF-κB binding assay was performed as previously reported (Dinis-Oliveira et al., 2007). Specificity of the DNA-protein complexes was confirmed by the addition of a 50-fold excess of either unlabeled specific or non-specific competitors. The subunit composition of NF-κB complexes was evaluated by preincubation of nuclear extracts with polyclonal antibodies against p50 and p65 units (Santa Cruz Biotechnology, Santa Cruz, CA, USA). Signals were analyzed by an ALFwin 1.03 fragment analyser (Amersham Pharmacia Biotech). Binding activities were determined as arbitrary units corresponding to the area under curve and further expressed as n-fold activation vs. Sham (part I) or Ang II (part II).
Western blot analysis
Total lysate of renal medullary or cortical homogenates were used for Nox4 and Nox1 detection. The angiotensin AT1 receptor was analysed in the membrane fraction of renal medulla or renal cortex samples. Samples of protein (50 µg) were loaded and separated by a 12% SDS-PAGE gel electrophoresis. Proteins were transferred onto nitrocellulose membranes, blocked for 1 h and incubated overnight at 4°C with specific antibody against Nox4 (sc-21860, 1:200, Santa Cruz Biotechnology or ET3174-1, 1:200, Epitomics, Burlingame, CA, USA), Nox1 (sc-5821, 1:200, Santa Cruz Biotechnology) or AT1 receptor (sc-1173, 1:500, Santa Cruz Biotechnology). After washing, membranes were incubated for 1 h at room temperature with fluorescent labeled secondary antibodies. All membranes were scanned with an Odyssey Infrared Imaging System (LI-COR Biosciences, Lincoln, NE, USA). Band intensities were normalized to β-actin (sc-47778, 1:10000, Santa Cruz Biotechnology).
Evaluation of angiotensinogen
Angiotensinogen was measured by an elisa assay kit (Rat Total Angiotensinogen Assay Kit, IBL International GmbH, Hamburg, Germany) (Kobori et al., 2008). Plasma and urine samples were collected on day 10 and on day 14. Urine samples were collected in the presence of an inhibitor cocktail (0.6 mL distilled water containing 50 µg pepstatin A, 10 mg sodium azide, 300 nmol enalaprilat and 125 µmol EDTA) to avoid further angiotensinogen formation and/or degradation (Kobori et al., 2003).
Statistical analysis
Results are expressed as mean ± SEM. Statistical analysis was performed using unpaired Student's t-test or one-way anova followed by a Tukey's multiple comparison test, where appropriate. P values of less than 0.05 were considered significant. Pearson's single regression analysis was used to estimate correlations between sets of parametric data.
Materials
Ketamine and medetomidine were purchased from Merial Portuguesa (Sintra, Portugal) and Laboratórios Pfizer (Oeiras, Portugal), respectively. Other drugs and chemicals were purchased from Sigma (St. Louis, MO, USA).
Results
Effects of Ang II or Ang II + PEG – catalase on SBP
The baseline SBP was similar in all experimental groups before surgery. Ang II significantly increased SBP when compared with sham-operated group (P < 0.05, Figure 1A). PEG-catalase had a significant (P < 0.05, Figure 1B) but short-term antihypertensive effect that lasted only for 3 days after the beginning of catalase administration (Figure 1B). The SBP of sham-operated rats was not affected by PEG-catalase treatment (data not shown). Under our experimental conditions, a significant correlation (r2= 0.762, r= 0.87, P= 0.001, n= 10) was found between tail-cuff and i.a. measurements of SBP (Figure 1C).
Figure 1.
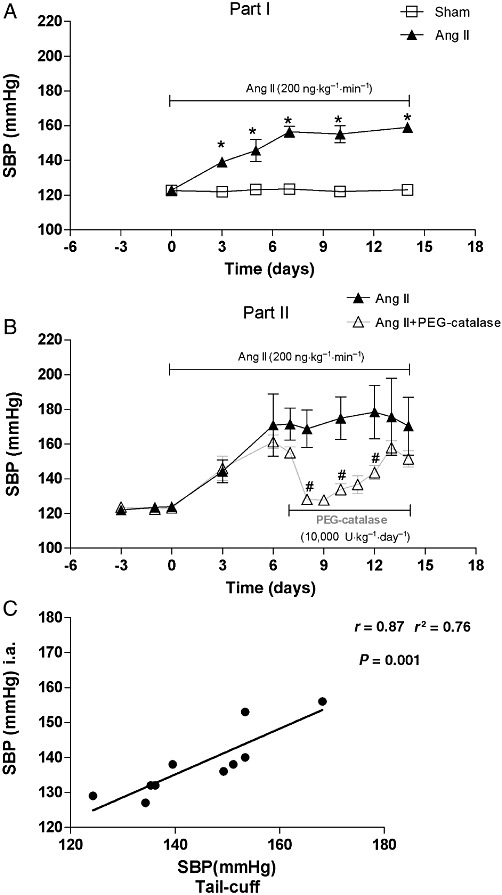
SBP in Sham, Ang II and Ang II + PEG-catalase-treated rats: (A, B) SBP measured by tail-cuff; (C) Correlation between SBP measured by tail-cuff and by i.a. pressures. Results are mean ± SEM (part I, n= 15; part II, n= 6–9).*P < 0.05 significantly different from sham, #P < 0.05 significantly different from Ang II.
Effects of Ang II or Ang II + PEG – catalase on H2O2 levels
Ang II significantly increased H2O2 levels in plasma, 24 h urine and renal medulla when compared with sham-operated group (P < 0.05, Figure 2). PEG-catalase decreased systemic, urinary and renal medullary H2O2 levels in Ang II-infused rats (P < 0.05, Figure 2). No significant changes were observed in renal cortical H2O2 production in Ang II- or Ang II + PEG-catalase-treated rats (Figure 2). Plasma and urinary H2O2 levels of sham rats were not significantly altered by PEG-catalase treatment (data not shown).
Figure 2.
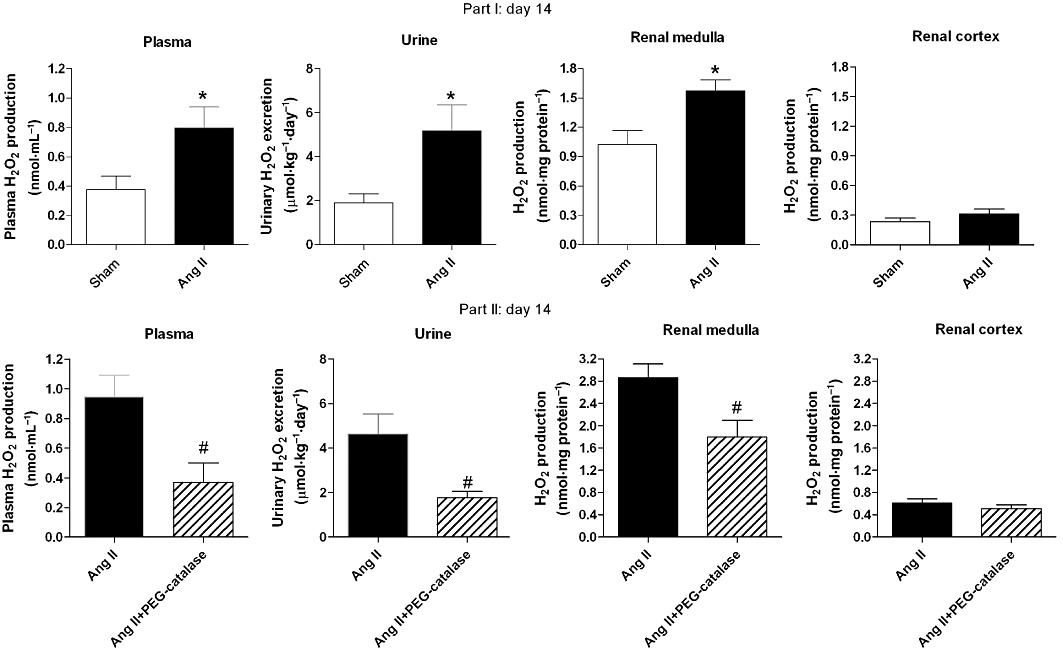
Plasma, urinary and renal H2O2 levels on day 14. Results are mean ± SEM (part I, n= 15; part II, n= 6–9). *P < 0.05 significantly different from sham; #P < 0.05 significantly different from Ang II.
Effects of inhibitors of H2O2 production/metabolism on renal H2O2 levels
DPI and apocynin significantly reduced the renal medullary levels of H2O2 and abolished the difference observed between sham-operated and Ang II-treated rats (Table 1). DPI and apocynin had no effect in H2O2 production in the renal cortex of Ang II-treated rats (Table 1). Aminotriazole markedly increased H2O2 levels both in the renal medulla and cortex (Table 1). Neither oxypurinol nor L-NAME, altered H2O2 production in the renal medulla and cortex (Table 1).
Table 1.
Effect of inhibitors of H2O2 production or metabolism on renal H2O2 levels
| H2O2 production (nmol.mg protein−1) | ||||
|---|---|---|---|---|
| Renal medulla | Renal cortex | |||
| Sham | Ang II | Sham | Ang II | |
| Krebs–HEPES (control) | 1.02 ± 0.14 | 1.57 ± 0.11* | 0.23 ± 0.04 | 0.31 ± 0.05 |
| DPI, 500 µM | 0.45 ± 0.05 | 0.54 ± 0.05# | 0.20 ± 0.07 | 0.26 ± 0.06 |
| Apocynin, 500 µM | 0.29 ± 0.06# | 0.31 ± 0.03# | 0.04 ± 0.01 | 0.11 ± 0.03 |
| Oxypurinol, 500 µM | 0.91 ± 0.14 | 1.07 ± 0.19 | 0.17 ± 0.09 | 0.13 ± 0.05 |
| L-NAME, 500 µM | 1.34 ± 0.12 | 1.64 ± 0.19 | 0.40 ± 0.09 | 0.43 ± 0.09 |
| Aminotriazole, 50 mM | 2.58 ± 0.18# | 2.63 ± 0.18# | 0.79 ± 0.10# | 0.71 ± 0.13# |
Results are mean ± SEM. n= 6–9.
P < 0.05 vs. sham.
P < 0.05 vs. tissue in the absence of inhibitor.
Effects of Ang II on renal NADPH oxidase activity
The DPI-inhibitable, NADPH-dependent, O2•− generation was significantly increased in the renal medulla of Ang II-hypertensive rats (P < 0.05, Figure 3), while no change was observed in the renal cortex (Figure 3). Furthermore, L-NAME did not affect NADPH-dependent O2•− generation in the renal medulla of Ang II-hypertensive rats (340.6 ± 30.2 vs. 396.5 ± 26.6 RFU·min−1·mg−1 protein, P= 0.20).
Figure 3.
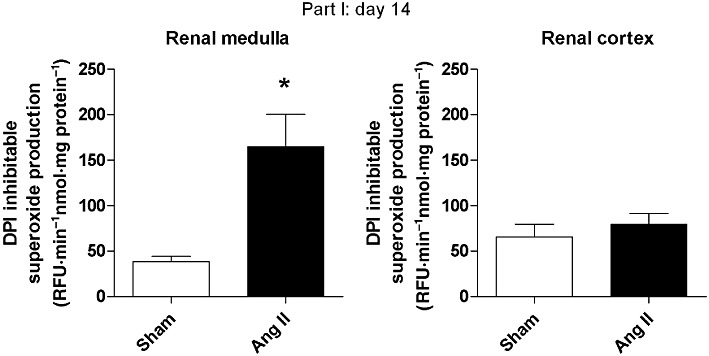
Renal NADPH oxidase activity (as superoxide anion (O2.-) production) on day 14. Results are mean ± SEM (part I, n= 6). *P < 0.05 significantly different from sham.
Effects of Ang II or Ang II + PEG – catalase on renal antioxidant enzyme activity
Ang II increased SOD activity both in the renal medulla and cortex (P < 0.05, Figure 4). Ang II raised the activity of catalase in the renal medulla and the activity of GPx in the renal cortex (P < 0.05, Figure 4). PEG-catalase treatment significantly decreased GPx activity in the renal medulla of Ang II-infused rats (P < 0.05, Figure 4), but did not change antioxidant enzyme activities in the renal cortex (Figure 4).
Figure 4.
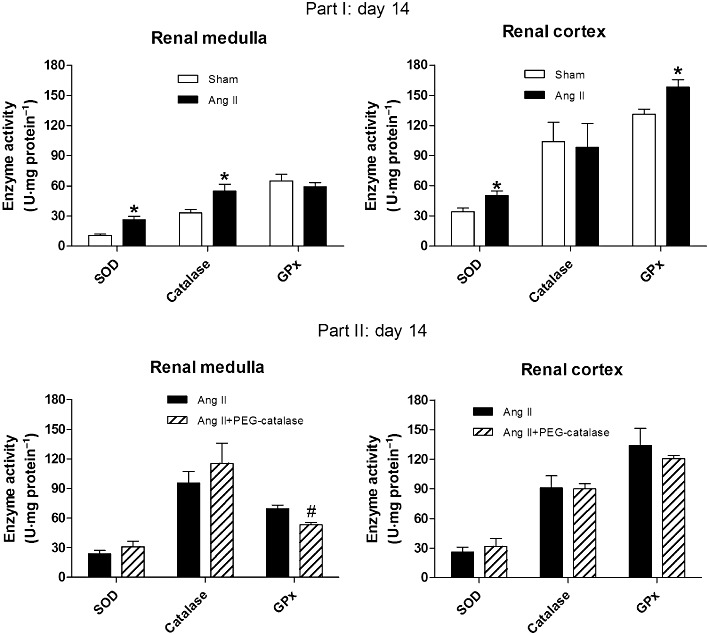
Effects of Ang II, with or without PEG-catalase, on renal antioxidant enzyme (SOD, catalase and GPx) activity on day 14. Results are mean ± SEM. *P < 0.05 significantly different from sham; #P < 0.05 significantly different from Ang II (part I, n= 7; part II, n= 6–9).
Effects of Ang II and PEG-catalase on renal Nox4, Nox1 and angiotensin AT1 receptor protein expression
Representative immunoblots for Nox4, Nox1 and AT1 receptors are shown in Figures 5–8. On day 14, Ang II infusion significantly increased the expression of Nox4 and AT1 receptors in the renal medulla, but not in the renal cortex (P < 0.05, Figures 5 and 6). Treatment with PEG-catalase abolished these effects in the renal medulla (P < 0.05) and did not alter expression in the renal cortex (Figures 5 and 6). As PEG-catalase had an antihypertensive effect in the first 3 days of the treatment, we also investigated if there were changes in the expression of Nox4 and also Nox1 at this earlier time point. We observed that on day 10, Ang II-infused rats had already an increased expression of Nox4 in the renal medulla (P < 0.05, Figure 7), but not in the renal cortex. Again, PEG-catalase treatment markedly reduced Nox4 expression in the renal medulla (P < 0.05, Figure 7). No differences were observed for renal medullary or cortical Nox1 expression between the studied groups (Figure 8).
Figure 5.
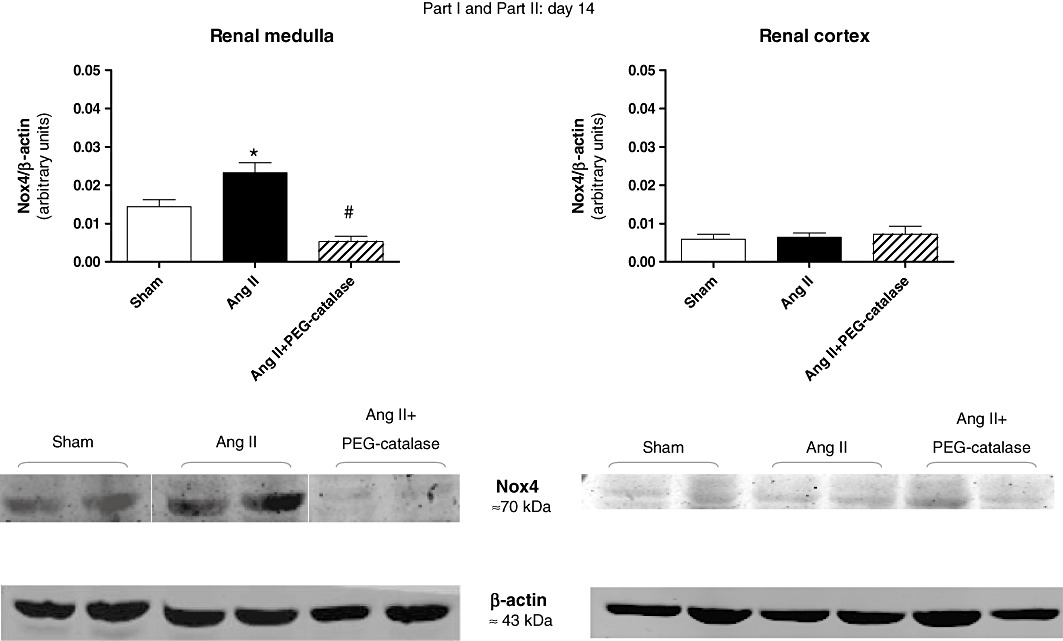
Effects of Ang II, with or without PEG-catalase, on renal Nox4 protein expression on day 14. Data shown are representative immunoblots with summary bar graphs mean ± SEM values, part I and II, n= 5–9). *P < 0.05 significantly different from sham; #P < 0.05 significantly different from Ang II.
Figure 8.
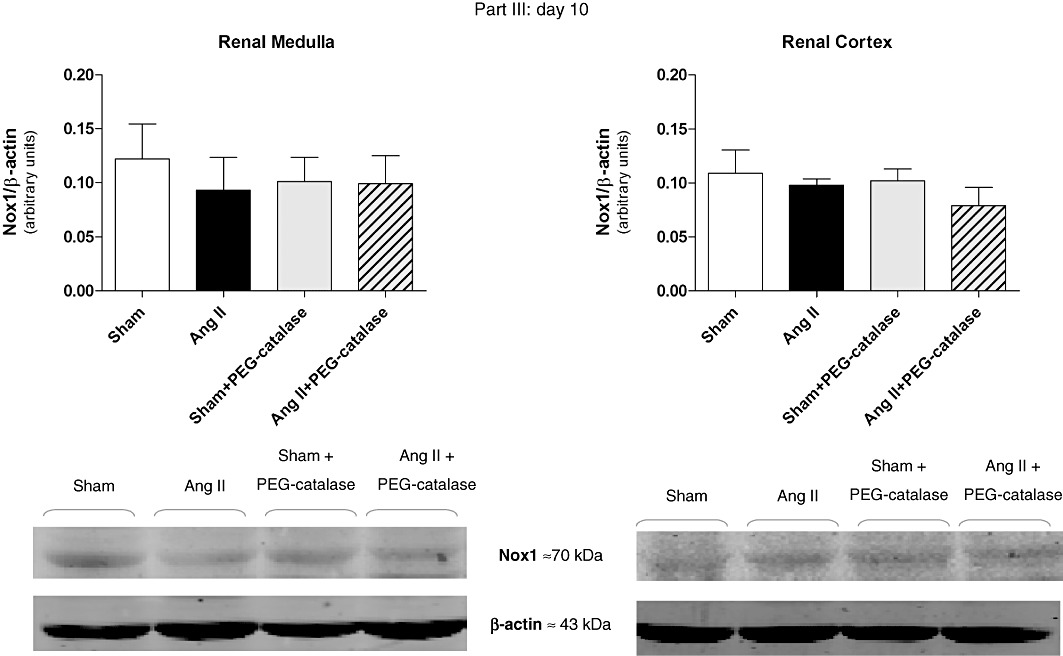
Earlier (day 10) effects of Ang II, with or without PEG-catalase, on renal Nox1 protein expression on day 10. Data are expressed as representative immunoblots with summary bar graphs (mean ± SEM values), part III, n= 4–7.
Figure 6.
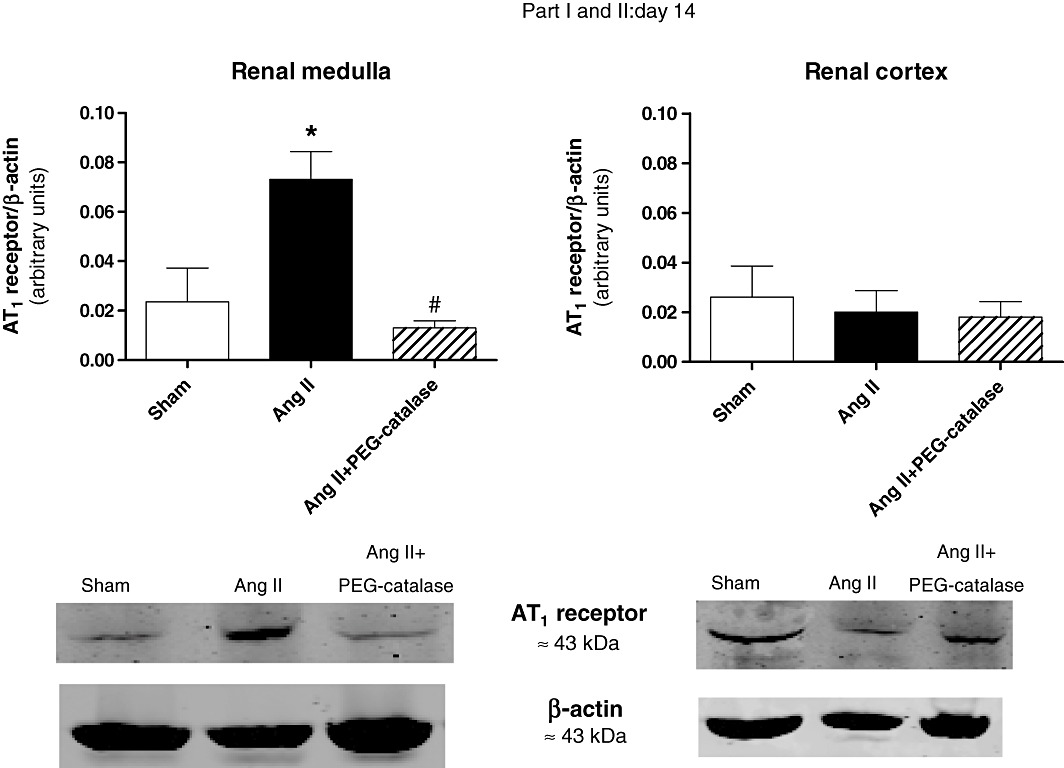
Effects of Ang II, with or without PEG-catalase, on renal angiotensin AT1 receptor protein expression on day 14. Data shown are representative immunoblots with summary bar graphs (mean ± SEM values, part I and II, n= 4–6). *P < 0.05 significantly different from sham; #P < 0.05 significantly different from Ang II.
Figure 7.
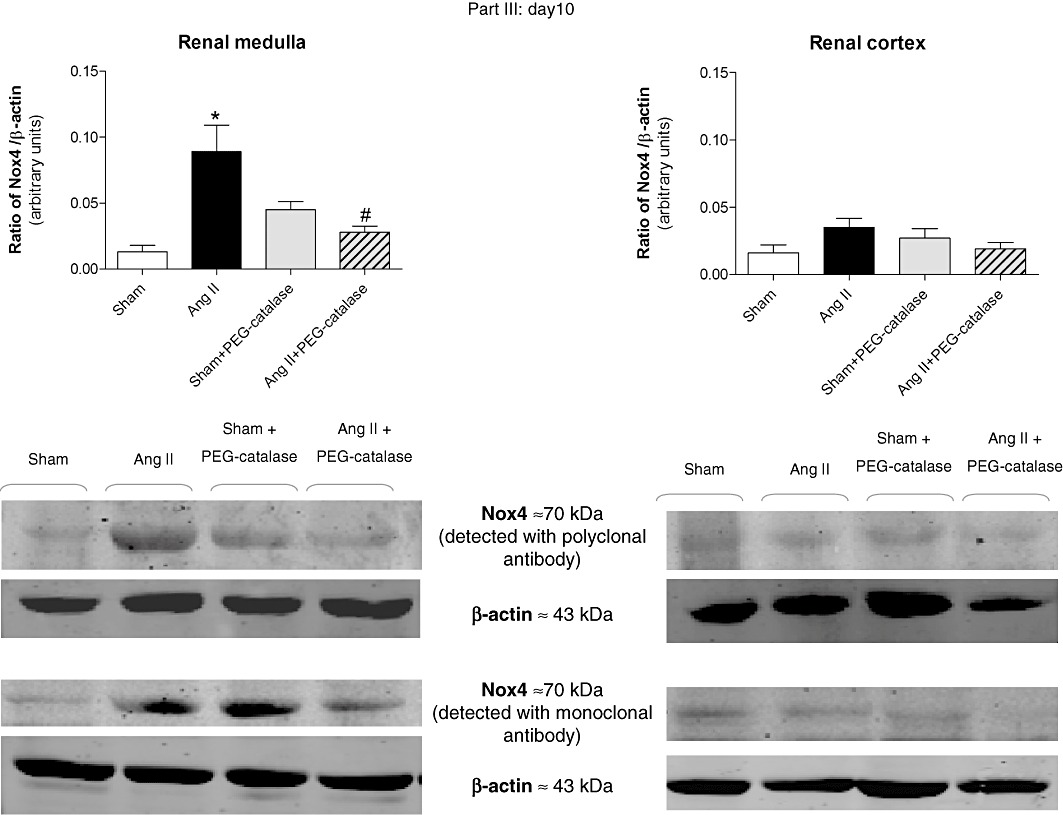
Earlier (day 10) effects of Ang II, with or without PEG-catalase, on renal Nox4 protein expression. Data shown are representative immunoblots obtained with different antibodies against Nox4. Bar graphs represent mean ± SEM values; part III, n= 4–8. *P < 0.05 significantly different from sham; #P < 0.05 significantly different from Ang II.
Effects of Ang II or Ang + PEG-catalase on renal NF-κB activation
Representative fEMSA gels are shown in Figure 9 and revealed the presence of two specific DNA-NF-κB bands (Figure 9A). Both NF-κB bands (complex I and II) were reduced by the p50 antibody. In addition, the antibody against the p65 subunit abolished the signal intensity of the upper band (complex I). (Figure 9A) Although this antibody also partially interfered with the signal intensity of the lower band (complex II) (Figure 9A), this effect is due to a cross-reactivity of this polyclonal antibody with the p50 subunit (Bruggeman et al., 2001). These results suggest that complex II is a p50/p50 homodimer, and complex I consists of a p50/p65 heterodimer, which is in accordance with previous results from other groups (Bourcier et al., 1997; Jamaluddin et al., 2000). Ang II enhanced the activation of the p50/p50 homodimer in the renal medulla, but not in the renal cortex (Table 2 and Figure 9B). Furthermore, neither the medulla nor the cortex of Ang II-hypertensive rats showed significant changes in p60/p50 heterodimer activation (Table 2 and Figure 9B). Treatment of Ang II-infused rats with PEG-catalase did not significantly reduce NF-κB activation in the renal medulla, but increased both NF-κB homodimer and heterodimer binding in the renal cortex (Table 2 and Figure 9C).
Figure 9.
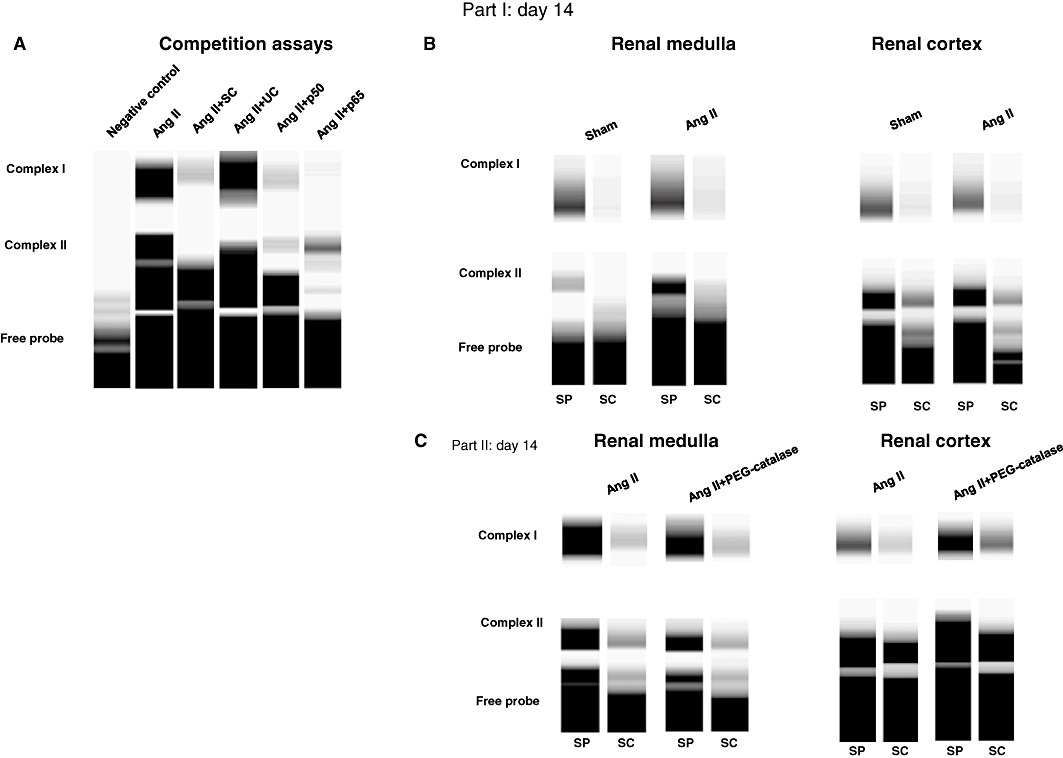
Representative fEMSA gels demonstrating renal NF-κB binding: (A) competition assays showing the composition of NF-κB complexes. SP,specific probe; SC,specific competitor; UC, non-specific competitor. (B, C) Effect of Ang II or Ang II + PEG-catalase treatment on renal NF-κB activation on day 14.
Table 2.
Densitometric quantification of NF-κB activation
| NF-κB activation (n-fold vs. sham) | ||
|---|---|---|
| p50/p50 homodimer | p50/p65 heterodimer | |
| Renal medulla | ||
| Sham | 1.00 ± 0.00 | 1.00 ± 0.00 |
| Ang II | 3.47 ± 0.34* | 1.02 ± 0.27 |
| Renal cortex | ||
| Sham | 1.00 ± 0.00 | 1.00 ± 0.00 |
| Ang II | 1.10 ± 0.18 | 1.24 ± 0.17 |
| NF-κB activation (n-fold vs. Ang II) | ||
|---|---|---|
| p50/p50 homodimer | p50/p65 heterodimer | |
| Renal medulla | ||
| Ang II | 1.00 ± 0.00 | 1.00 ± 0.00 |
| Ang II + PEG-catalase | 0.61 ± 0.11 | 0.86 ± 0.28 |
| Renal cortex | ||
| Ang II | 1.00 ± 0.00 | 1.00 ± 0.00 |
| Ang II + PEG-catalase | 1.34 ± 0.14# | 1.37 ± 0.07# |
Results are expressed as n-fold variation vs. sham or Ang II and correspond to the mean ± SEM of 3–6 independent experiments; n= 5–9 rats per group.
P < 0.05 vs. sham.
P < 0.05 vs. Ang II.
Effects of Ang II and PEG-catalase on plasma and urinary angiotensinogen
On day 14, urinary angiotensinogen, a marker of intrarenal RAS activation (Kobori et al., 2003; 2009), was markedly increased by Ang II infusion, when compared with sham-operated rats (P < 0.05, Figure 10A). In contrast, Ang II reduced plasma angiotensinogen by 50% (Figure 10A). Treatment with PEG-catalase, from day 7 to day 14, of Ang II-infused rats did not significantly change the effect of Ang II on urinary angiotensinogen (Figure 10B), but caused an eight-fold increase in plasma angiotensinogen (P < 0.05, Figure 10B). As PEG-catalase significantly reduced blood pressure in the first 3 days of the treatment, we also looked for changes in intrarenal or systemic angiotensinogen at this time point. PEG-catalase markedly suppressed intrarenal angiotensinogen levels (P < 0.05, Figure 10C) in the initial phase of the treatment and did not alter plasma levels in Ang II-infused rats (Figure 10C). Moreover, PEG-catalase did not affect intrarenal or systemic levels of angiotensinogen in sham-operated rats (Figure 10C).
Figure 10.
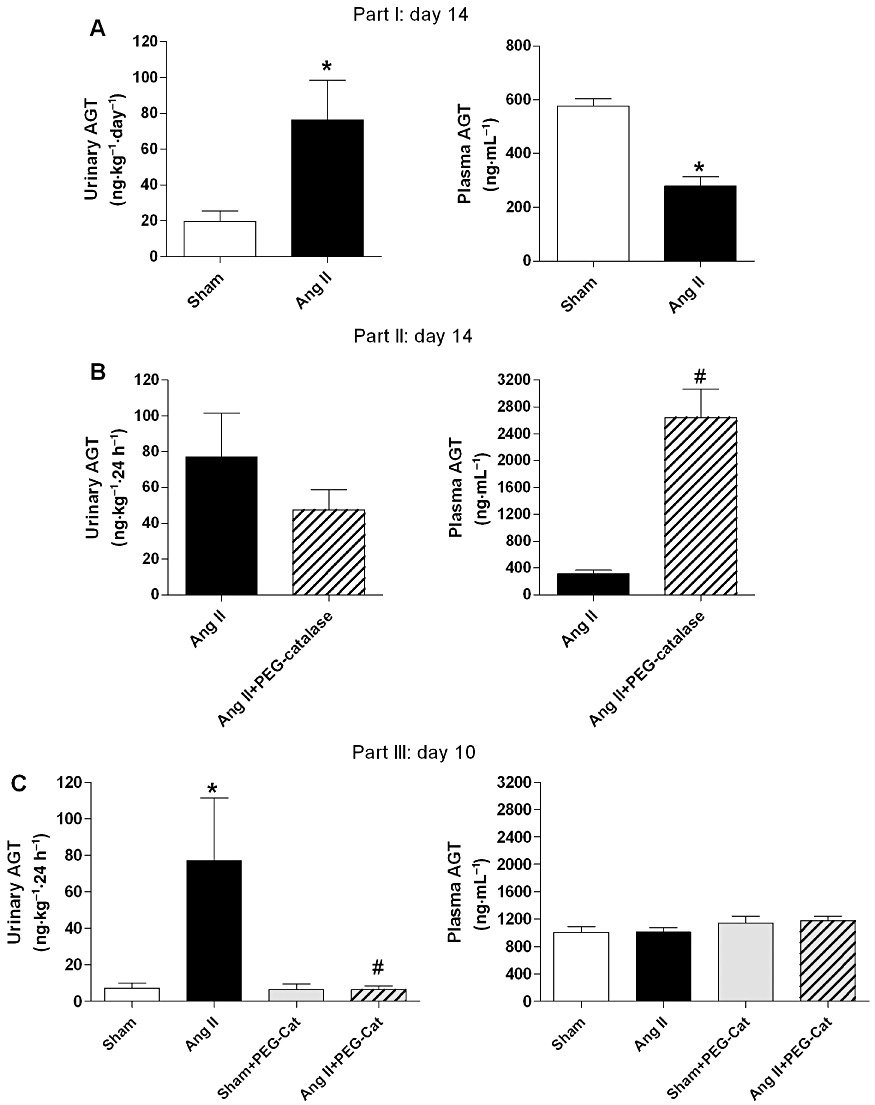
Effects of Ang II, with or without PEG-catalase, on urinary and plasma angiotensinogen (AGT) levels on day 14 (A and B) and on day 10 (C). Results are mean ± SEM (part I, II and III, n= 6–9). *P < 0.05 significantly different from sham; #P < 0.05 significantly different from Ang II.
Correlation between H2O2 production and NF-κB homodimer activation in the renal medulla
A positive correlation (r2= 0.46, r= 0.68, P= 0.0005, n= 22) was observed between H2O2 production and NF-κB p50/p50 homodimer activation in the renal medulla (Figure 11A).
Figure 11.
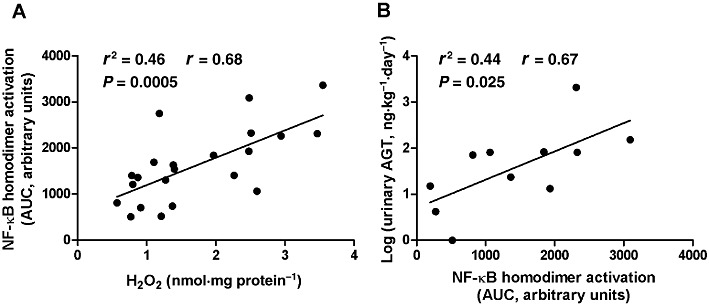
Correlation analysis between: renal medullary H2O2 and NF-κB homodimer activation (A); renal medullary NF-κB homodimer activation and log (urinary angiotensinogen; AGT) (B).
Correlation between NF-κB homodimer activation in the renal medulla and urinary angiotensinogen levels
Urinary angiotensinogen levels deviated from the normal distribution (P < 0.001). However, when a logarithmic transformation was applied, log (urinary angiotensinogen) values showed a normal distribution (P= 0.50). Hence, log (urinary angiotensinogen) values were used to evaluate the correlation between NF-κB activation and urinary angiotensinogen. NF-κB homodimer activation in the renal medulla was significantly and positively correlated with log (urinary angiotensinogen) (r2= 0.44, r= 0.67, P= 0.025, n= 11) (Figure 11B).
Discussion and conclusions
The present study provides strong evidence that the renal medulla is a major target for Ang II-induced dysfunction in redox signalling. We found that Ang II increases H2O2 production and NF-κB activation, as well as angiotensin AT1 receptor and Nox4 expression, in the renal medulla, whereas no change was observed in the renal cortex. Among the inhibitors tested, only DPI and apocynin reduced the renal medullary H2O2 production. Although the use of apocynin as a specific NADPH oxidase inhibitor has been questioned (Vejrazka et al., 2005; Heumuller et al., 2008), the limitations described do not apply to all experimental conditions. The lack of apocynin activation due to the absence of myeloperoxidase (MPO) is not likely to occur in the kidney, as MPO expression and activity has been demonstrated in this organ (Malle et al., 2003). Even though we cannot exclude a putative scavenging effect of apocynin, inhibition of H2O2 production was also induced by DPI which does not scavenge ROS. Furthermore, the failure of inhibitors of NOS or xanthine oxidase to reduce H2O2 generation excludes the contribution of these enzymes to the DPI effect. Thus, it appears that NADPH oxidases are the main sources of H2O2 in the renal medulla.
Renal tissues express several functional NADPH oxidase isoforms (Nox1, Nox2 and Nox4). Nevertheless, the extensive abundance of Nox4 in the kidney suggests its intimate involvement in the regulation of renal-specific functions (Geiszt et al., 2000; Nistala et al., 2008; Garrido and Griendling, 2009). Our results also suggest that in the kidney, Nox4 has a higher responsiveness to Ang II than Nox1, in contrast to what is described in vascular cells (Dikalov et al., 2008). There has been controversy regarding the cortico-medullary differences in Nox4 expression (Schluter et al., 2006; Orient et al., 2007; Nistala et al., 2008; Sedeek et al., 2010). In our study, renal cortical Nox4 was barely detectable and was not affected by the treatments. On the other hand, the renal medulla had a higher Nox4 expression that was further enhanced by Ang II infusion. Although Ang II up-regulated Nox4 in renal cortical cells in vitro (Block et al., 2008), the physiological relevance of this effect has not been sufficiently established. Furthermore, in vivo studies demonstrated that the renal cortex has a high resistance to Ang II-induced oxidative stress (Wesseling et al., 2005), while the renal medulla exhibits a genetic vulnerability to the injurious effects of Ang II (Yuan et al., 2003). Indeed, we observed that the renal cortex, besides having higher basal antioxidant activity than the renal medulla, also presented lesser changes in H2O2-neutralizing enzymes after Ang II infusion. While the renal medulla exhibited a marked increase in the activity of catalase, the renal cortex showed only a modest rise of GPx. These facts reflect the regional differences in renal H2O2 production, since catalase and GPx are differentially required for the clearance of high or low levels of H2O2, respectively. Nevertheless, a similar rise in total SOD activity was observed in both kidney regions probably due to a stimulatory effect of Ang II on chaperone proteins for Cu, Zn-SOD (Gongora et al., 2006).
H2O2 propagates its own production through the feed-forward activation of pro-oxidant enzymes, including NADPH oxidases (Ardanaz and Pagano, 2006). Recent in vitro studies reported that Nox2, Nox4 and Nox5 were stimulated by H2O2 in blood cells and cardiac fibroblasts (Colston et al., 2005; El Jamali et al., 2008; El Jamali et al., 2010). Interestingly, we observed that a 7-day treatment with PEG-catalase almost abolished Nox4 expression in the renal medulla of Ang II-infused rats. This indicates that H2O2 stimulates Nox4 expression in the kidney, thus creating a vicious cycle that prolongs the redox pathological signalling.
Ang II stimulates intra-renal production of angiotensinogen through activation of AT1 receptors, leading to increased Ang II levels in the kidney (Kobori et al., 2004). This mechanism amplifies the deleterious effects of Ang II on renal function and contributes to the progression of hypertension (Kobori et al., 2007). Our present data strongly suggest that renal medullary H2O2 mediated the Ang II-induced activation of the intra-renal RAS. We observed that Ang II-hypertensive rats had not only an increased urinary excretion of angiotensinogen but also an enhanced expression of AT1 receptors in the renal medulla. The selective activation of renal medullary AT1 receptors has also been described in other studies. For example, in rats with myocardial infarct, a condition associated with RAS activation in the kidney, there is an up-regulation of AT1 receptor mRNA in the renal medulla, but not in the renal cortex (Milik et al., 2006). These facts indicate that the renal medulla is an important site for the regulation of the intra-renal RAS. Of note, the reduction of renal medullary AT1 receptor expression in rats treated simultaneously with Ang II and PEG-catalase suggests that H2O2 stimulates AT1 receptor activation. In addition, H2O2 is known to activate NF-κB, a transcription factor that regulates the expression of angiotensinogen and other genes involved in blood pressure homeostasis (Brasier et al., 2000; Morigi et al., 2002; Fardoun et al., 2007). In the present study, we found that Ang II markedly activates NF-κB homodimers in the renal medulla, but not in the renal cortex. Furthermore, no significant changes of NF-κB p50/p65 heterodimers were observed. It is generally accepted that NF-KB p50/p65 heterodimer complexes stimulate gene transcription, while NF-κB p50/p50 homodimers are mostly associated with transcriptional repression (Guan et al., 2005; Pereira and Oakley, 2008). Nevertheless, Jamaluddin et al., 2000 demonstrated that in hepatocytes, Ang II induces an alternative pattern of NF-κB activation, characterized by enhanced nuclear translocation of NF-κB homodimers and unaltered NF-κB p50/p65 heterodimer binding. Moreover, these authors also suggested that the NF-κB homodimer may contain latent transcriptional activity that mediates the stimulatory effect of Ang II on angiotensinogen expression. Interestingly, we observed that NF-κB homodimer activation in the renal medulla was not only positively correlated with renal medullary production of H2O2, but also with the urinary excretion of angiotensinogen. This suggests that the Ang II-induced increase in intrarenal angiotensinogen production is related to the redox changes in the renal medulla, which are probably driven by H2O2.
It has been previously reported that hypertensive patients exhibit higher plasma levels of H2O2, which directly correlate with increased RAS activity and target organ dysfunction (Lacy et al., 1998; 2000). Our study also shows that Ang II-hypertensive rats have increased systemic and urinary H2O2 levels. Since we previously demonstrated that PEG-catalase prevents the development of hypertension induced by RAS activation (Sousa et al., 2008), we expected that it would also lower blood pressure in Ang II-infused rats. However, PEG-catalase had only a short-term effectiveness despite the sustained reduction in H2O2 levels. Although blood pressure was markedly decreased during the first days of PEG-catalase administration, this effect was reversed at the end of the treatment, suggesting the existence of counter-regulatory mechanisms. Interestingly, the loss of antihypertensive efficacy of PEG-catalase was associated with a significant increase in systemic angiotensinogen levels, in opposition to the down-regulation induced by Ang II alone. There is evidence that the increase of circulating angiotensinogen levels leads to a rise of blood pressure (Cholewa and Mattson, 2005). Furthermore, the angiotensinogen metabolite, angiotensin (1–12), can serve as a substrate for Ang II formation in the absence of renin (Nagata et al., 2006; Ferrario, 2010). Therefore, the dysregulation of systemic angiotensinogen levels may explain the loss of PEG-catalase antihypertensive efficacy. In contrast, the initial lowering of blood pressure is likely to be caused by the significant suppression of intrarenal angiotensinogen levels observed in the first days of PEG-catalase administration. The transient nature of this effect is probably due to the marked rise of systemic angiotensinogen, resulting in the elevation of circulating Ang II levels and subsequent increase of angiotensinogen production in the kidney. Of note, an intriguing data of our study was the enhancement of renal cortical NF-κB activity caused by PEG-catalase. Altogether, these facts suggest that when renal medullary events are blocked, there is an alternative activation of the renal cortex by Ang II that contributes to overcome the antihypertensive effect of PEG-catalase.
Our results not only reinforce the concept that circulating and renal RAS are distinctly regulated (Kobori et al., 2002; 2007), but also propose that H2O2 acts as a differential modulator of these systems. In line with this hypothesis is the recent finding that H2O2 has either stimulatory or inhibitory effects on angiotensinogen expression depending on the cell type (Okada et al., 2010). The putative mechanisms whereby Ang II or H2O2 may increase renal or systemic RAS activation are depicted in Figure 12.
Figure 12.
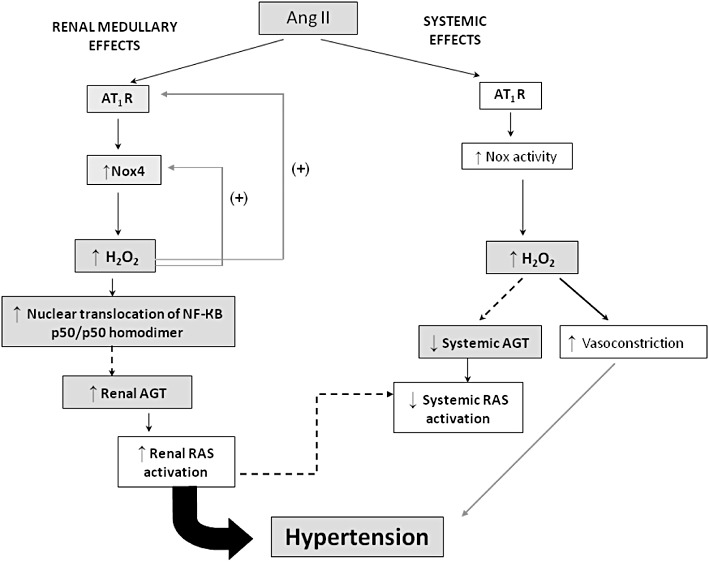
Putative mechanisms involved in the regulation of BP and RAS activation by Ang II and H2O2. Dashed arrows represent the predicted pathways for intrarenal and systemic RAS activation. Coloured (grey) rectangles indicate the effects observed in the present study. In the renal medulla, the activation of angiotensin AT1 receptors (AT1R) by Ang II increases NADPH oxidase-derived H2O2 production. H2O2 further enhances the sensitivity to Ang II effects by stimulating the expression of AT1 receptors and Nox4. Increased H2O2 levels augment the nuclear translocation of NF-κB homodimer in the renal medulla. These events appear to trigger an increase of angiotensinogen (AGT) production in the kidney, causing a subsequent enhancement of intrarenal RAS activation that contributes to hypertension. Ang II increases systemic (non-renal) production of H2O2, probably through AT1 receptor-dependent stimulation of Nox enzymes. Systemic H2O2 increases peripheral vasoconstriction, which also elevates blood pressure. Simultaneously, there is a reduction of systemic AGT levels by Ang II that probably attenuates the systemic RAS activity in order to prevent a sudden malignant rise of blood pressure. Down-regulation of circulating RAS may be partly mediated by systemic H2O2 levels and/or by renal RAS activity.
In summary, this study demonstrates that the renal medulla is a primary target of Ang II-induced redox dysfunction and highlights H2O2 as a key player in the amplification of Ang II effects. We conclude that increased H2O2 levels contribute to Ang II-induced hypertension and intrarenal RAS activation. Even so, sustained treatment with PEG-catalase had a short-term antihypertensive effectiveness probably due to the dysregulation of systemic angiotensinogen production. Thus, it appears that the regulation of systemic or intrarenal RAS activation involves fine-tuning processes dependent on H2O2 levels.
Acknowledgments
This work was supported by FEDER funds via COMPETE and by national funds through FCT – Portuguese Foundation for Science and Technology (project grant: PTDC/SAU-TOX/114166/2009 and postdoctoral fellowship: SFRH/BPD/21863/2005). The authors thank Dr Carla Sousa for the excellent technical assistance in the NF-κB analysis.
Glossary
- Ang II
angiotensin II
- DPI
diphenylene iodonium
- EMSA
electrophoretic mobility shift assay
- fEMSA
fluorescent electrophoretic mobility shift assay
- GPx
glutathione peroxidase
- L-NAME
nitro-L-arginine methylester
- MPO
myeloperoxidase
- PEG
polyethylene glycol
- RAS
renin-angiotensin system
- RFU
relative fluorescence units
- ROS
reactive oxygen species
- SBP
systolic blood pressure
- SHR
spontaneously hypertensive rats
- SOD
superoxide dismutase
Conflict of interest
None.
References
- Alexander SPH, Mathie A, Peters JA. Guide to Receptors and Channels (GRAC) Br J Pharmacol. (5th edn.) 2011;164(Suppl. 1):S1–S324. doi: 10.1111/j.1476-5381.2011.01649_1.x. [DOI] [PMC free article] [PubMed] [Google Scholar]
- Ardanaz N, Pagano PJ. Hydrogen peroxide as a paracrine vascular mediator: regulation and signaling leading to dysfunction. Exp Biol Med (Maywood) 2006;231:237–251. doi: 10.1177/153537020623100302. [DOI] [PubMed] [Google Scholar]
- Asghar M, Banday AA, Fardoun RZ, Lokhandwala MF. Hydrogen peroxide causes uncoupling of dopamine D1-like receptors from G proteins via a mechanism involving protein kinase C and G-protein-coupled receptor kinase 2. Free Radic Biol Med. 2006;40:13–20. doi: 10.1016/j.freeradbiomed.2005.08.018. [DOI] [PubMed] [Google Scholar]
- Block K, Eid A, Griendling KK, Lee DY, Wittrant Y, Gorin Y. Nox4 NAD(P)H oxidase mediates Src-dependent tyrosine phosphorylation of PDK-1 in response to angiotensin II: role in mesangial cell hypertrophy and fibronectin expression. J Biol Chem. 2008;283:24061–24076. doi: 10.1074/jbc.M803964200. [DOI] [PMC free article] [PubMed] [Google Scholar]
- Bourcier T, Sukhova G, Libby P. The nuclear factor kappa-B signaling pathway participates in dysregulation of vascular smooth muscle cells in vitro and in human atherosclerosis. J Biol Chem. 1997;272:15817–15824. doi: 10.1074/jbc.272.25.15817. [DOI] [PubMed] [Google Scholar]
- Brasier AR, Jamaluddin M, Han Y, Patterson C, Runge MS. Angiotensin II induces gene transcription through cell-type-dependent effects on the nuclear factor-kappaB (NF-kappaB) transcription factor. Mol Cell Biochem. 2000;212:155–169. [PubMed] [Google Scholar]
- Bruggeman LA, Adler SH, Klotman PE. Nuclear factor-kappa B binding to the HIV-1 LTR in kidney: implications for HIV-associated nephropathy. Kidney Int. 2001;59:2174–2181. doi: 10.1046/j.1523-1755.2001.00732.x. [DOI] [PubMed] [Google Scholar]
- Chen YF, Cowley AW, Jr, Zou AP. Increased H(2)O(2) counteracts the vasodilator and natriuretic effects of superoxide dismutation by tempol in renal medulla. Am J Physiol Regul Integr Comp Physiol. 2003;285:R827–R833. doi: 10.1152/ajpregu.00636.2002. [DOI] [PubMed] [Google Scholar]
- Chobanian AV, Bakris GL, Black HR, Cushman WC, Green LA, Izzo JL, et al. Seventh report of the Joint National Committee on Prevention, Detection, Evaluation, and Treatment of High Blood Pressure. Hypertension. 2003;42:1206–1252. doi: 10.1161/01.HYP.0000107251.49515.c2. [DOI] [PubMed] [Google Scholar]
- Cholewa BC, Mattson DL. Influence of elevated renin substrate on angiotensin II and arterial blood pressure in conscious mice. Exp Physiol. 2005;90:607–612. doi: 10.1113/expphysiol.2005.030015. [DOI] [PubMed] [Google Scholar]
- Colston JT, de la Rosa SD, Strader JR, Anderson MA, Freeman GL. H2O2 activates Nox4 through PLA2-dependent arachidonic acid production in adult cardiac fibroblasts. FEBS Lett. 2005;579:2533–2540. doi: 10.1016/j.febslet.2005.03.057. [DOI] [PubMed] [Google Scholar]
- Cowley AW., Jr Renal medullary oxidative stress, pressure-natriuresis, and hypertension. Hypertension. 2008;52:777–786. doi: 10.1161/HYPERTENSIONAHA.107.092858. [DOI] [PMC free article] [PubMed] [Google Scholar]
- Cowley AW, Jr, Mattson DL, Lu S, Roman RJ. The renal medulla and hypertension. Hypertension. 1995;25:663–673. doi: 10.1161/01.hyp.25.4.663. [DOI] [PubMed] [Google Scholar]
- Crowley SD, Gurley SB, Herrera MJ, Ruiz P, Griffiths R, Kumar AP, et al. Angiotensin II causes hypertension and cardiac hypertrophy through its receptors in the kidney. Proc Natl Acad Sci U S A. 2006;103:17985–17990. doi: 10.1073/pnas.0605545103. [DOI] [PMC free article] [PubMed] [Google Scholar]
- Dikalov SI, Dikalova AE, Bikineyeva AT, Schmidt HH, Harrison DG, Griendling KK. Distinct roles of Nox1 and Nox4 in basal and angiotensin II-stimulated superoxide and hydrogen peroxide production. Free Radic Biol Med. 2008;45:1340–1351. doi: 10.1016/j.freeradbiomed.2008.08.013. [DOI] [PMC free article] [PubMed] [Google Scholar]
- Dinis-Oliveira RJ, Sousa C, Remiao F, Duarte JA, Navarro AS, Bastos ML, et al. Full survival of paraquat-exposed rats after treatment with sodium salicylate. Free Radic Biol Med. 2007;42:1017–1028. doi: 10.1016/j.freeradbiomed.2006.12.031. [DOI] [PubMed] [Google Scholar]
- Droge W. Free radicals in the physiological control of cell function. Physiol Rev. 2002;82:47–95. doi: 10.1152/physrev.00018.2001. [DOI] [PubMed] [Google Scholar]
- El Jamali A, Valente AJ, Lechleiter JD, Gamez MJ, Pearson DW, Nauseef WM, et al. Novel redox-dependent regulation of NOX5 by the tyrosine kinase c-Abl. Free Radic Biol Med. 2008;44:868–881. doi: 10.1016/j.freeradbiomed.2007.11.020. [DOI] [PMC free article] [PubMed] [Google Scholar]
- El Jamali A, Valente AJ, Clark RA. Regulation of phagocyte NADPH oxidase by hydrogen peroxide through a Ca(2+)/c-Abl signaling pathway. Free Radic Biol Med. 2010;48:798–810. doi: 10.1016/j.freeradbiomed.2009.12.018. [DOI] [PMC free article] [PubMed] [Google Scholar]
- Fardoun RZ, Asghar M, Lokhandwala M. Role of nuclear factor kappa B (NF-kappaB) in oxidative stress-induced defective dopamine D1 receptor signaling in the renal proximal tubules of Sprague-Dawley rats. Free Radic Biol Med. 2007;42:756–764. doi: 10.1016/j.freeradbiomed.2006.11.033. [DOI] [PMC free article] [PubMed] [Google Scholar]
- Ferrario CM. Addressing the theoretical and clinical advantages of combination therapy with inhibitors of the renin-angiotensin-aldosterone system: antihypertensive effects and benefits beyond BP control. Life Sci. 2010;86:289–299. doi: 10.1016/j.lfs.2009.11.020. [DOI] [PMC free article] [PubMed] [Google Scholar]
- Gao YJ, Lee RM. Hydrogen peroxide induces a greater contraction in mesenteric arteries of spontaneously hypertensive rats through thromboxane A(2) production. Br J Pharmacol. 2001;134:1639–1646. doi: 10.1038/sj.bjp.0704420. [DOI] [PMC free article] [PubMed] [Google Scholar]
- Gao YJ, Hirota S, Zhang DW, Janssen LJ, Lee RM. Mechanisms of hydrogen-peroxide-induced biphasic response in rat mesenteric artery. Br J Pharmacol. 2003;138:1085–1092. doi: 10.1038/sj.bjp.0705147. [DOI] [PMC free article] [PubMed] [Google Scholar]
- Gao YJ, Zhang Y, Hirota S, Janssen LJ, Lee RM. Vascular relaxation response to hydrogen peroxide is impaired in hypertension. Br J Pharmacol. 2004;142:143–149. doi: 10.1038/sj.bjp.0705727. [DOI] [PMC free article] [PubMed] [Google Scholar]
- Garrido AM, Griendling KK. NADPH oxidases and angiotensin II receptor signaling. Mol Cell Endocrinol. 2009;302:148–158. doi: 10.1016/j.mce.2008.11.003. [DOI] [PMC free article] [PubMed] [Google Scholar]
- Geiszt M, Kopp JB, Varnai P, Leto TL. Identification of renox, an NAD(P)H oxidase in kidney. Proc Natl Acad Sci U S A. 2000;97:8010–8014. doi: 10.1073/pnas.130135897. [DOI] [PMC free article] [PubMed] [Google Scholar]
- Giles TD. Assessment of global risk: a foundation for a new, better definition of hypertension. J Clin Hypertens (Greenwich) 2006;8:5–14. doi: 10.1111/j.1524-6175.2006.05835.x. [DOI] [PubMed] [Google Scholar]
- Gongora MC, Qin Z, Laude K, Kim HW, McCann L, Folz JR, et al. Role of extracellular superoxide dismutase in hypertension. Hypertension. 2006;48:473–481. doi: 10.1161/01.HYP.0000235682.47673.ab. [DOI] [PubMed] [Google Scholar]
- Guan H, Hou S, Ricciardi RP. DNA binding of repressor nuclear factor-kappaB p50/p50 depends on phosphorylation of Ser337 by the protein kinase A catalytic subunit. J Biol Chem. 2005;280:9957–9962. doi: 10.1074/jbc.M412180200. [DOI] [PubMed] [Google Scholar]
- Heumuller S, Wind S, Barbosa-Sicard E, Schmidt HH, Busse R, Schroder K, et al. Apocynin is not an inhibitor of vascular NADPH oxidases but an antioxidant. Hypertension. 2008;51:211–217. doi: 10.1161/HYPERTENSIONAHA.107.100214. [DOI] [PubMed] [Google Scholar]
- Jamaluddin M, Meng T, Sun J, Boldogh I, Han Y, Brasier AR. Angiotensin II induces nuclear factor (NF)-kappaB1 isoforms to bind the angiotensinogen gene acute-phase response element: a stimulus-specific pathway for NF-kappaB activation. Mol Endocrinol. 2000;14:99–113. doi: 10.1210/mend.14.1.0400. [DOI] [PubMed] [Google Scholar]
- Jones DP. Radical-free biology of oxidative stress. Am J Physiol Cell Physiol. 2008;295:C849–C868. doi: 10.1152/ajpcell.00283.2008. [DOI] [PMC free article] [PubMed] [Google Scholar]
- Kobori H, Harrison-Bernard LM, Navar LG. Urinary excretion of angiotensinogen reflects intrarenal angiotensinogen production. Kidney Int. 2002;61:579–585. doi: 10.1046/j.1523-1755.2002.00155.x. [DOI] [PMC free article] [PubMed] [Google Scholar]
- Kobori H, Nishiyama A, Harrison-Bernard LM, Navar LG. Urinary angiotensinogen as an indicator of intrarenal Angiotensin status in hypertension. Hypertension. 2003;41:42–49. doi: 10.1161/01.hyp.0000050102.90932.cf. [DOI] [PMC free article] [PubMed] [Google Scholar]
- Kobori H, Prieto-Carrasquero MC, Ozawa Y, Navar LG. AT1 receptor mediated augmentation of intrarenal angiotensinogen in angiotensin II-dependent hypertension. Hypertension. 2004;43:1126–1132. doi: 10.1161/01.HYP.0000122875.91100.28. [DOI] [PMC free article] [PubMed] [Google Scholar]
- Kobori H, Nangaku M, Navar LG, Nishiyama A. The intrarenal renin-angiotensin system: from physiology to the pathobiology of hypertension and kidney disease. Pharmacol Rev. 2007;59:251–287. doi: 10.1124/pr.59.3.3. [DOI] [PubMed] [Google Scholar]
- Kobori H, Katsurada A, Miyata K, Ohashi N, Satou R, Saito T, et al. Determination of plasma and urinary angiotensinogen levels in rodents by newly developed ELISA. Am J Physiol Renal Physiol. 2008;294:F1257–F1263. doi: 10.1152/ajprenal.00588.2007. [DOI] [PMC free article] [PubMed] [Google Scholar]
- Kobori H, Alper AB, Jr, Shenava R, Katsurada A, Saito T, Ohashi N, et al. Urinary angiotensinogen as a novel biomarker of the intrarenal renin-angiotensin system status in hypertensive patients. Hypertension. 2009;53:344–350. doi: 10.1161/HYPERTENSIONAHA.108.123802. [DOI] [PMC free article] [PubMed] [Google Scholar]
- Lacy F, O'Connor DT, Schmid-Schonbein GW. Plasma hydrogen peroxide production in hypertensives and normotensive subjects at genetic risk of hypertension. J Hypertens. 1998;16:291–303. doi: 10.1097/00004872-199816030-00006. [DOI] [PubMed] [Google Scholar]
- Lacy F, Kailasam MT, O'Connor DT, Schmid-Schonbein GW, Parmer RJ. Plasma hydrogen peroxide production in human essential hypertension: role of heredity, gender, and ethnicity. Hypertension. 2000;36:878–884. doi: 10.1161/01.hyp.36.5.878. [DOI] [PubMed] [Google Scholar]
- Lin HH, Chen CH, Hsieh WK, Chiu TH, Lai CC. Hydrogen peroxide increases the activity of rat sympathetic preganglionic neurons in vivo and in vitro. Neuroscience. 2003;121:641–647. doi: 10.1016/s0306-4522(03)00517-7. [DOI] [PubMed] [Google Scholar]
- McGrath J, Drummond G, McLachlan E, Kilkenny C, Wainwright C. Guidelines for reporting experiments involving animals: the ARRIVE guidelines. Br J Pharmacol. 2010;160:1573–1576. doi: 10.1111/j.1476-5381.2010.00873.x. [DOI] [PMC free article] [PubMed] [Google Scholar]
- Makino A, Skelton MM, Zou AP, Cowley AW., Jr Increased renal medullary H2O2 leads to hypertension. Hypertension. 2003;42:25–30. doi: 10.1161/01.HYP.0000074903.96928.91. [DOI] [PubMed] [Google Scholar]
- Malle E, Buch T, Grone HJ. Myeloperoxidase in kidney disease. Kidney Int. 2003;64:1956–1967. doi: 10.1046/j.1523-1755.2003.00336.x. [DOI] [PubMed] [Google Scholar]
- Milik E, Szczepanska-Sadowska E, Cudnoch-Jedrzejewska A, Dobruch J, Morton M, Koperski L. Upregulation of angiotensin AT1a receptors mRNA in the heart and renal medulla after myocardial infarction in rats. J Physiol Pharmacol. 2006;57:375–388. [PubMed] [Google Scholar]
- Morigi M, Macconi D, Zoja C, Donadelli R, Buelli S, Zanchi C, et al. Protein overload-induced NF-kappaB activation in proximal tubular cells requires H(2)O(2) through a PKC-dependent pathway. J Am Soc Nephrol. 2002;13:1179–1189. [PubMed] [Google Scholar]
- Nagata S, Kato J, Sasaki K, Minamino N, Eto T, Kitamura K. Isolation and identification of proangiotensin-12, a possible component of the renin-angiotensin system. Biochem Biophys Res Commun. 2006;350:1026–1031. doi: 10.1016/j.bbrc.2006.09.146. [DOI] [PubMed] [Google Scholar]
- Nistala R, Whaley-Connell A, Sowers JR. Redox control of renal function and hypertension. Antioxid Redox Signal. 2008;10:2047–2089. doi: 10.1089/ars.2008.2034. [DOI] [PMC free article] [PubMed] [Google Scholar]
- Okada S, Kozuka C, Masuzaki H, Yasue S, Ishii-Yonemoto T, Tanaka T, et al. Adipose tissue-specific dysregulation of angiotensinogen by oxidative stress in obesity. Metabolism. 2010;59:1241–1251. doi: 10.1016/j.metabol.2009.11.016. [DOI] [PMC free article] [PubMed] [Google Scholar]
- Orient A, Donko A, Szabo A, Leto TL, Geiszt M. Novel sources of reactive oxygen species in the human body. Nephrol Dial Transplant. 2007;22:1281–1288. doi: 10.1093/ndt/gfm077. [DOI] [PubMed] [Google Scholar]
- Paravicini TM, Touyz RM. Redox signaling in hypertension. Cardiovasc Res. 2006;71:247–258. doi: 10.1016/j.cardiores.2006.05.001. [DOI] [PubMed] [Google Scholar]
- Pereira SG, Oakley F. Nuclear factor-kappaB1: regulation and function. Int J Biochem Cell Biol. 2008;40:1425–1430. doi: 10.1016/j.biocel.2007.05.004. [DOI] [PubMed] [Google Scholar]
- Rodriguez-Martinez MA, Garcia-Cohen EC, Baena AB, Gonzalez R, Salaices M, Marin J. Contractile responses elicited by hydrogen peroxide in aorta from normotensive and hypertensive rats. Endothelial modulation and mechanism involved. Br J Pharmacol. 1998;125:1329–1335. doi: 10.1038/sj.bjp.0702200. [DOI] [PMC free article] [PubMed] [Google Scholar]
- Schluter T, Grimm R, Steinbach A, Lorenz G, Rettig R, Grisk O. Neonatal sympathectomy reduces NADPH oxidase activity and vascular resistance in spontaneously hypertensive rat kidneys. Am J Physiol Regul Integr Comp Physiol. 2006;291:R391–R399. doi: 10.1152/ajpregu.00029.2006. [DOI] [PubMed] [Google Scholar]
- Sedeek M, Callera G, Montezano A, Gutsol A, Heitz F, Szyndralewiez C, et al. Critical role of Nox4-based NADPH oxidase in glucose-induced oxidative stress in the kidney: implications in type 2 diabetic nephropathy. Am J Physiol Renal Physiol. 2010;299:F1348–F1358. doi: 10.1152/ajprenal.00028.2010. [DOI] [PubMed] [Google Scholar]
- Sousa T, Pinho D, Morato M, Marques-Lopes J, Fernandes E, Afonso J, et al. Role of superoxide and hydrogen peroxide in hypertension induced by an antagonist of adenosine receptors. Eur J Pharmacol. 2008;588:267–276. doi: 10.1016/j.ejphar.2008.04.044. [DOI] [PubMed] [Google Scholar]
- Thakali K, Davenport L, Fink GD, Watts SW. Pleiotropic effects of hydrogen peroxide in arteries and veins from normotensive and hypertensive rats. Hypertension. 2006;47:482–487. doi: 10.1161/01.HYP.0000201540.91234.8f. [DOI] [PubMed] [Google Scholar]
- Ungvari Z, Orosz Z, Labinskyy N, Rivera A, Xiangmin Z, Smith K, et al. Increased mitochondrial H2O2 production promotes endothelial NF-kappaB activation in aged rat arteries. Am J Physiol Heart Circ Physiol. 2007;293:H37–H47. doi: 10.1152/ajpheart.01346.2006. [DOI] [PubMed] [Google Scholar]
- Valko M, Leibfritz D, Moncol J, Cronin MT, Mazur M, Telser J. Free radicals and antioxidants in normal physiological functions and human disease. Int J Biochem Cell Biol. 2007;39:44–84. doi: 10.1016/j.biocel.2006.07.001. [DOI] [PubMed] [Google Scholar]
- Vejrazka M, Micek R, Stipek S. Apocynin inhibits NADPH oxidase in phagocytes but stimulates ROS production in non-phagocytic cells. Biochim Biophys Acta. 2005;1722:143–147. doi: 10.1016/j.bbagen.2004.12.008. [DOI] [PubMed] [Google Scholar]
- Wesseling S, Ishola DA, Jr, Joles JA, Bluyssen HA, Koomans HA, Braam B. Resistance to oxidative stress by chronic infusion of angiotensin II in mouse kidney is not mediated by the AT2 receptor. Am J Physiol Renal Physiol. 2005;288:F1191–F1200. doi: 10.1152/ajprenal.00322.2004. [DOI] [PubMed] [Google Scholar]
- Yang H, Shi M, VanRemmen H, Chen X, Vijg J, Richardson A, et al. Reduction of pressor response to vasoconstrictor agents by overexpression of catalase in mice. Am J Hypertens. 2003;16:1–5. doi: 10.1016/s0895-7061(02)03086-8. [DOI] [PubMed] [Google Scholar]
- Yuan B, Liang M, Yang Z, Rute E, Taylor N, Olivier M, et al. Gene expression reveals vulnerability to oxidative stress and interstitial fibrosis of renal outer medulla to nonhypertensive elevations of ANG II. Am J Physiol Regul Integr Comp Physiol. 2003;284:R1219–R1230. doi: 10.1152/ajpregu.00257.2002. [DOI] [PubMed] [Google Scholar]