

Abstract
The single methionine (Met/M) residue of amyloid-beta (Aβ) peptide, at position 35 of the 42-mer, has important relevance for Aβ-induced oxidative stress and neurotoxicity. Recent in vivo brain studies in a transgenic (Tg) Alzheimer disease (AD) mouse model with Swedish and Indiana familial AD mutations in human amyloid precursor protein (APP) (referred to as the J20 Tg mouse) demonstrated increased levels of oxidative stress. However, the substitution of the Met631 residue of APP to leucine (Leu/L) (M631L in human APP numbering, referred to as M631L Tg and corresponding to residue 35 of Aβ1–42) resulted in no significant in vivo oxidative stress levels, thereby supporting the hypothesis that Met-35 of Aβ contributes to oxidative insult in the AD brain. It is conceivable that oxidative stress mediated by Met-35 of Aβ is important in regulating numerous downstream effects, leading to differential levels of relevant biochemical pathways in AD. Therefore, in the current study using proteomics, we tested the hypothesis that several brain proteins involved in pathways such as energy and metabolism, antioxidant activity, proteasome degradation, and pH regulation are altered in J20Tg versus M631L Tg AD mice. Antioxid. Redox Signal. 17, 1507–1514.
Introduction
Mutations in genes such as the amyloid precursor protein [APP], presenilin-1, and presenilin-2 (3) lead to familial Alzheimer disease (AD), which is clinically diagnosed by an age-related decline in cognition and memory that are not due to other causes. Major histopathological hallmarks in the AD brain include the presence of senile plaques (SP), neurofibrillary tangles, synapse loss, and oxidative stress. The major constituents of SP are amyloid-beta (Aβ) peptides, in which Aβ(1–40) and Aβ(1–42) (8) are known to be toxic in AD, with soluble Aβ(1–42) oligomers being more toxic in the AD brain. That Aβ(1–42) induces oxidative stress in AD has been extensively supported through various studies of AD model systems and in post-mortem subjects with AD (4). A primary contributor to oxidative stress induced by Aβ(1–42) is believed to be the single methionine (Met/M) residue at position 35 (Met-35) of the Aβ peptide (Fig. 1a). Several reports support this notion: (a) In primary hippocampal cultures subjected to the addition of Aβ(1–42M35Norleucine) (a CH2 substitution for the S atom of Met), no protein oxidation, neurotoxicity, or free radical formation occurred (9); (b) in vivo studies of transgenic (Tg) Caenorhabditis elegans carrying a human Aβ(1–42M35Cysteine) substitution had lower levels of protein oxidation as assessed by protein carbonyls in comparison to Tg animals with Aβ(1–42) (9) and no phenotype, as evidenced by lack of paralysis; (c) recent in vivo studies of brain isolated from a 9 month-old platelet-derived growth factor (PDGF)-amyloid precursor protein transgene (PDAPP) Tg mouse model of AD carrying the Swedish (670/671KM→NL) and Indiana (717V→I) familial forms of AD (APPSw,In), hereafter referred to as J20 Tg, demonstrated significant in vivo oxidative damage (protein oxidation; lipid peroxidation) (1). However, PDAPP mice carrying a third Aβ(M35L) (Fig. 1b) substitution (corresponding to residue 631 of human APP), hereafter referred to as M631L Tg mice, abrogated this in vivo brain oxidative stress (1). In addition to the lack of oxidative stress in the brain, another pathological difference between M631L Tg mice and J20 Tg mice involved the form of deposition of human Aβ-peptide: Although the levels of Aβ(1–42) and Aβ(1–40) and their ratio did not vary between these two Tg mice, in contrast to J20 Tg mice, which had traditional plaque-like deposition of Aβ(1–42), M631L Tg mice that lacked Met in the 35th residue of Aβ peptides produced punctate deposits of Aβ. We concluded that, in addition to being critical for in vivo oxidative stress associated with Aβ(1–42), the single Met residue of this peptide influenced plaque formation as well (1). In the present study, we investigated brain proteome differences between M631L Tg and J20 Tg mice.
FIG. 1.

Met at residue 35 of AB (1–42) is key to oxidative stress associated with this peptide. Amino-acid sequence of amyloid (1–42) peptide (a) showing Met at position 35. Met is key to amyloid (1–42)-induced oxidative stress and neurotoxicity. In the current study, the Met of Aβ(1–42) in APP was replaced by Leu (b). Residue 35 in both peptides is underlined. Aβ, amyloid-beta; APP, amyloid precursor protein; Lec/L, leucine; Met/M, methionine.
Innovation.
Methionine (Met/M) at residue 35 of amyloid-beta peptide [Aβ(1–42)] has been shown to be critical in inducing oxidative stress, and, consequently, in Alzheimer disease (AD) pathogenesis. To test the importance of Met- 35 of Aβ(1–42) in vivo in AD, a third mutation in an ADrelevant animal model was generated in which the Met-35 of the Aβ(1–42) region of amyloid precursor protein (APP) was substituted by leucine (Leu/L) in a transgenic (Tg) mouse with Swedish and Indiana familial AD mutations in human APP. Proteomics analysis identified for the first time brain proteins whose levels reflected the lack of oxidative stress in the M631L mouse brain. Conversely, the proteomics studies identified proteins in the J20 mouse brain revealed pathways known to be altered in AD and/or mild cognitive impairment (MCI) brain and reflect the oxidative stress associated with the Met-35 of Aβ(1–42).
Results and Discussion
To evaluate the whether there are any proteomics differences among the brains from M631L Tg, M631 non-transgenic (NTg), and J20 Tg mice, we performed a proteomics study on the brains isolated from these mice. From these experiments, we present the results based on two comparisons: M631L Tg relative to M631 NTg and M631L Tg relative to J20 Tg mice. Effects that may be inherently present in the M631L Tg brain as a result of the M631L transgene can be realized through comparisons with their littermate controls (i.e., M631 NTg), while effects resulting from the presence of Met-35 in Aβ can be realized by a comparison of the M631L Tg mouse brain with that of J20 Tg mice.
Shown in Figure 2 are representative two-dimensional (2D)-gel images from comparisons of M631L Tg and M631 NTg mice. Two spots were observed as having significant differences in levels based on an image analysis of spot densities. Table 1 lists the number of peptide sequences, spectral counts (SC), molecular weight (MW), isoelectric point (pI), fold-change levels, and P-values associated with the identification and fold-change levels for each identified protein. In order to increase the confidence in proteins that are identified with only a single peptide sequence, we confirmed that multiple SC were detected and manually validated the mass spectrometry (MS)/MS spectra. In addition, low P-values are associated with SEQUEST identifications (i.e., p≤3.00e−04), and anticipated MW and pI values are similar to spot locations on the 2D-gels, both giving confidence in the identifications listed. We note that in some cases, there is a shift in observed MW and pI from the predicted locations presumably due to factors such as post-translational modifications which influence the net charges of proteins and degradation products. After MS/MS analysis of in-gel tryptic digests of the two spots, the proteins were identified as heat shock protein 90 B1 (Hsp90 B1) and proteasome subunit β, type 2. As listed in Table 1, Hsp90 B1 (↑2.28-fold, *p<0.035) is up-regulated in M631L Tg relative to M631 NTg mice, whereas the level of proteasome subunit β, type 2, is down-regulated (↓1.65-fold, *p<0.019). Altered proteins in these two groups are reflective of the M631L substitution relative to NTg mice. Up-regulation of the molecular chaperone, Hsp90 B1, indicates that M631L Tg mice have heightened cellular defense responses compared with M631 NTg mice. Proteasome subunit β, type 2, was identified as down-regulated in M631L Tg mice and may be indicative of alterations in proteasome machinery in pathways not directly related to Aβ(1–42)-induced oxidative stress. This onset of decreased proteasome subunit levels is potentially important for the removal of oxidized proteins that are no longer capable of performing their normal functions.
FIG. 2.
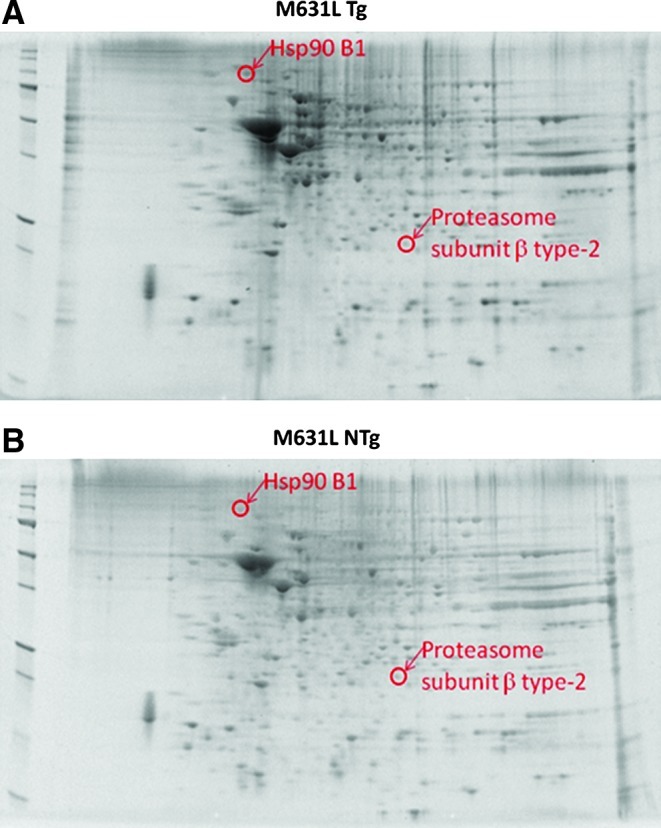
Proteomics was used to identify proteins of differential levels in brain from M631L Tg vs. M631L NTg mice. Representative 2D-gel images of the proteins isolated from the brain of (A) M631L Tg and (B) M631 NTg mice. Differentially expressed protein spots in M631L Tg mice are labeled with protein identifications obtained from nanospray ESI-MS/MS analyses. 2D, two-dimensional; ESI, electrospray ionization; MS, mass spectrometry; NTg, non-transgenic; Tg, transgenic. (To see this illustration in color the reader is referred to the web version of this article at www.liebertpub.com/ars).
Table 1.
List of Proteins with Differential Levels in M631L Transgenic Mice Relative to M631 Non-Transgenic controls
| Protein | Swiss Prot no. | MW (kDa) | pI | Peptides (SC)a | Pb | Fold changec | p-Valued |
|---|---|---|---|---|---|---|---|
| Hsp90 B1 | P08113 | 92.42 | 4.59 | 4 (8) | 5.00e−06 | 2.28↑ | 0.035 |
| Proteasome subunit β, type 2 | Q9R1P3 | 22.89 | 6.61 | 1 (2) | 3.00e−04 | 1.65↓ | 0.019 |
The number of peptide sequences identified by nanospray ESI-MS/MS of tryptic peptides. The total number of MS/MS spectral counts is indicated in parenthesis.
The probability of an incorrect identification associated with each protein identification using the SEQUEST search alogorithm.
The fold change in spot density from M631L Tg mice compared with M631 NTg controls. The arrow indicates the direction of change.
The P-value associated with fold changec calculated using a Student's t-test. n=10 for M631L Tg, n=5 for M631 NTg.
ESI, electrospray ionization; Leu/L, leucine; Met/M, methionine; MS, mass spectrometry; MW, molecular weight; NTg, non-transgenic; P, probability of type I error; pI, isoelectric point; SC, spectral counts; Tg, transgenic.
Figure 3 shows representative 2D-gel images of protein spots observed to statistically change in density between M631L Tg and J20 Tg mice. The J20 Tg data were recently published in our initial proteome investigations in this mouse model (6), and are used here to allow direct proteome comparisons based on the presence or absence of Met-35 in the Aβ(1–42) portion of APP. From these comparisons and MS/MS analyses of tryptic digest solutions of individual spots, 14 differentially expressed proteins were identified (Table 2). Interestingly, many of these proteins are down-regulated in the M631L Tg brain relative to that of J20 Tg mice. Previous studies showed that levels of these proteins are altered in AD and in animal models thereof (2). The identified proteins are involved in energy dysfunction and mitochondrial alterations, antioxidant and cellular defense, pH regulation, lipid abnormalities, cholinergic dysfunction, and proteasome function, alterations in structure and neuronal transmission, cell signaling, cell cycle, tau phosphorylation, and Aβ production.
FIG. 3.
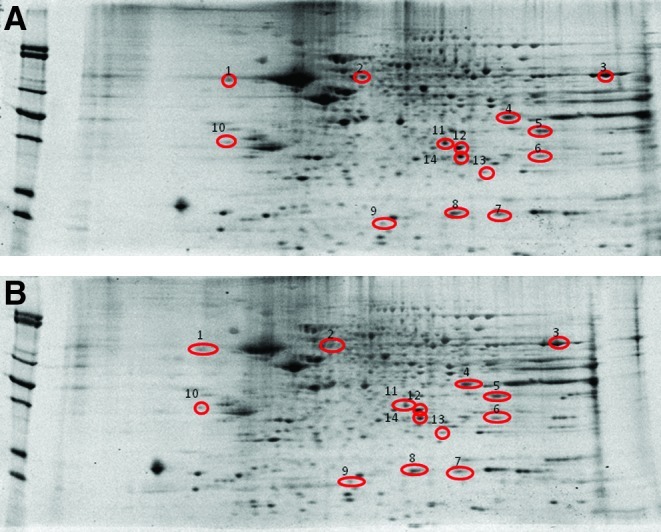
Proteomics was used to identify proteins from brains of J20 Tg and M631L Tg mice with differential levels. Representative 2D-gel images of the proteins isolated from the brain of (A) J20 Tg and (B) M631L Tg mice. Differentially expressed protein spots in M631L Tg mice are labeled with protein identifications obtained from proteomics using nanospray ESI-MS/MS analyses and database searching. 1, Brain acid soluble protein 1 (BASP1); 2, V-type proton ATPase subunit B (VATB2); 3, ATP synthase subunit α mitochondrial (ATPα); 4, ATP synthase subunit α, mitochondrial (ATPα); 5, Glyceraldehyde-3-phosphate dehydrogenase (GAPDH); 6, Voltage-dependent anion-selective channel protein 1 (VDAC-1); 7, Glutathione S-transferase Mu 1 (GSTM1); 8, Peptidyl-prolyl cis-trans isomerase 1 (Pin-1); 9, Peptidyl-prolyl cis-trans isomerase 1 (Pin-1); 10, Ubiquitin-conjugation enzyme E2 N (EBE2N); 11, Phosphaditylethanolamine binding-protein 1 (PEBP-1); 12, Carbonic anhydrase-2 (CA2); 13, Phosphoglucomutase 1 (PGM1); 14, Superoxide dismutase [Mn], mitochondrial (SOD2); 15, Triose phosphate isomerase (TPI). ATP, adenosine triphosphate. (To see this illustration in color the reader is referred to the web version of this article at www.liebertpub.com/ars.)
Table 2.
List of Brain Proteins with Differential Levels in M631L Transgenic Mice Relative to J20 Transgenic Mice
| Spot | Protein identified | Accession # | Coverage | Number of identified peptidesa | Score | MW (kDa) | pI | P valueb | Fold changec |
|---|---|---|---|---|---|---|---|---|---|
| 1 | Brain acid soluble protein 1 (BASP1) | Q91XV3 | 47.79 | 5 | 38.4 | 22.1 | 4.51 | 0.008 | 3.34↑ |
| 2 | V-type proton ATPase subunit B (VATB2) | P62814 | 20.74 | 8 | 77.9 | 56.5 | 5.81 | 0.007 | 9.19↑ |
| 3 | ATP synthase subunit α, mitochondrial (ATPα) | Q03265 | 43.40 | 19 | 410.2 | 59.7 | 9.19 | 0.003 | 1.17↑ |
| 4 | Glyceraldehyde-3-phosphate dehydrogenase (GAPDH) | P16858 | 12.31 | 4 | 38.8 | 35.8 | 8.25 | 0.01 | 0.70↓ |
| 5 | Voltage-dependent anion-selective channel protein 1 (VDAC-1) | Q60932 | 21.96 | 5 | 42.5 | 32.3 | 8.43 | 0.03 | 0.76↓ |
| 6 | Glutathione S-transferase Mu 1 (GSTM1) | P10649 | 20.64 | 4 | 27.1 | 26.0 | 7.94 | 0.039 | 0.57↓ |
| 7 | Peptidyl-prolyl cis-trans isomerase 1 (Pin-1) | P17742 | 10.98 | 2 | 19.4 | 18 | 7.90 | 0.018 | 0.608↓ |
| 8 | Peptidyl-prolyl cis-trans isomerase 1 (Pin-1) | P17742 | 17.68 | 3 | 10.2 | 18 | 7.90 | 0.018 | 0.608↓ |
| 9 | Ubiquitin-conjugation enzyme E2N (EBE2N) | P61089 | 17.11 | 2 | 16.1 | 17.1 | 6.57 | 0.034 | 9.17↑ |
| 10 | Phosphaditylethanolamine binding-protein 1 (PEBP-1) | P70296 | 28.34 | 3 | 30.2 | 20.82 | 5.07 | 0.0008 | 2.97↑ |
| 11 | Carbonic anhydrase-2 (CA-2) | P00920 | 16.15 | 2 | 20.2 | 59.7 | 6.54 | 0.002 | 0.60↓ |
| 12 | Phosphoglycerate mutase 1 (PGM1) | Q9DBJ1 | 25.98 | 3 | 30.2 | 28.81 | 6.79 | 0.004 | 0.72↓ |
| 13 | Superoxide dismutase (Mn), mitochondrial (SOD2) | P09671 | 6.31 | 1 | 10.1 | 24.0 | 8.8 | 0.037 | 0.76↓ |
| 14 | Triose phosphate isomerase (TPI) | P17751 | 41.37 | 6 | 60.1 | 26.7 | 7.07 | 0.009 | 0.69↓ |
The number of peptide sequences identified by nanospray ESI-MS/MS of tryptic peptides.
The fold change in spot density from M631L Tg mice compared with J20 Tg mice. The arrow indicates the direction of change.
The P-value associated with fold changeb calculated using a Student's t-test.
Energy dysfunction and mitochondrial alterations
The decreased levels of triose phosphate isomerase (TPI), glyceraldehyde-3-phosphate dehydrogenase (GAPDH), and phosphoglycerate mutase (PGM1) in M631L Tg mice suggest that the presence of Met-35 residue is central to the Aβ(1–42)-induced decrease in glucose metabolism. Further, other mitochondrial proteins adenosine triphosphate (ATP) synthase subunit α, V-type Proton ATPase subunit B (VATB2), and voltage-dependent anion-selective channel protein 1 (VDAC1) showed that an increase in proteins levels was also identified as proteins with an increase in expression. The increase in the levels of mitochondrial-related proteins such as ATP synthase subunit α, VATB2, and VDAC1 could indicate that their levels are decreased in J20 Tg mice due to the presence of Met in Aβ, while M631L Tg mice are unaffected. In our previous studies conducted on the proteome changes in J20 Tg mice, we observed increased expression levels of glycolytic and mitochondrial proteins (6). VATB2 also plays a role in autophagy, which is consistent with the suggestion that in the absence of oxidative stress due to the absence of Met-35 in Aβ(1–42) of APP, autophagic processes work well, but are compromised in J20 mice. Thus, in contrast to J20 Tg mice, the down-regulation of energy-, metabolic-, and mitochondrial-related proteins in M631L Tg mice suggests that their brains are not compromised in terms of cellular stress (such as that incurred in conditions of oxidative stress) to initiate the increased production of key energy proteins and enzymes.
Antioxidant and cellular defense
Glutathione S-transferase Mu 1 (GSTM1) and manganese superoxide dismutase (SOD2) levels were significantly decreased in M361L Tg mice compared with J20 Tg mice, which is again consistent with lower levels of oxidative/nitrosative stress in the brain of M631L Tg mice (1). The observed decrease in the glutathione S-transferase (GST), a phase II detoxification enzyme that helps in the detoxification of products of lipid peroxidation including 4-hydroxy-2-nonenal (HNE), is consistent with the decreased levels of oxidative stress reported in M631L Tg mice compared with J20 Tg. Further, lack of oxidative stress correlates well with the decreased levels of SOD2 in the M631L Tg mice compared with J20 Tg mice. We propose that since both GSTM1 and SOD2 are the enzymes involved in antioxidant defenses to combat oxidative insult, the levels of these enzymes are not elevated in M631L Tg mice, which do not have elevated oxidative stress in the brain.
pH regulation
Carbonic anhydrase 2 (CA-2) is involved in the maintenance of cellular pH levels through catalysis of the transformation of carbon dioxide into bicarbonate and protons. A decrease in CA-2 expression in the brain of M631L Tg mice relative to that of J20 Tg mice suggests that pH maintenance is properly regulated in the brains of M631L Tg mice, which is consistent with the level of oxidative stress previously measured (1).
Lipid abnormalities, cholinergic dysfunction, and proteasome function
Phosphaditylethanolamine binding protein 1 (PEBP-1) and ubiquitin-conjugation enzyme E2N (EBE2N) levels were significantly increased in M361L Tg mice compared with J20 Tg mice. The increased levels of PEBP-1 influence the levels of the neurotransmitter, acetylcholine, and also likely modulate the lipid asymmetry disruption in the AD previously reported. Further, EBE2N is not only important in the synthesis of polyubiquitin chains, deoxyribonucleic acid (DNA) repair, but is also important for the mediation of the transcriptional activation of target genes, which is important for the proper regulation of cell cycle and cell differentiation. Consequently, lower levels of EBE2N in the J20 mice brain are consistent with the notion that Met-35 of Aβ(1–42) and associated oxidative stress play a role in cell-cycle alterations in AD and MCI.
Alterations in structure and neuronal transmission
The levels of brain acid soluble protein 1 (BASP1, also known as CAP-23 or NAP-22) were found to be significantly increased in M631L Tg mice compared with J20 Tg mice. The BASP1 protein is implicated in neurite outgrowth and the navigation of axonal growth cones responding to a variety of guidance cues. Hence, BASP1 is important not only for the control of membrane dynamics, but also for the organization of the actin cytoskeleton. The observation of decreased levels of BASP1 in J20 Tg mice may suggest its role in alterations in neuronal communication and, consequently, in impaired learning and memory, as reported in AD.
Cell signaling, cell cycle, Tau phosphorylation, and Aβ production
Peptidyl-prolyl cis/trans isomerase 1 (Pin-1) is a regulatory protein that belongs to the family of peptidyl-prolyl isomerases (7). Pin-1 functions are associated with Aβ production, phosphorylation of tau, cell-cycle regulation, transcription regulation, cytokine regulation, apoptosis, and DNA damage response (2, 5). In the current study, we observed decreased levels of Pin-1 in M631L Tg mice relative to J20 Tg mice. In the comparison between J20 Tg mice relative to J20 NTg animals, we previously observed an increase in Pin-1 expression, which may indicate the brain's attempt to reduce elevated Aβ levels and prevent oligomeric Aβ formation (6).
To validate PDQuest data, we performed 2D-Western blots for ATP synthase-α. As observed in Figure 4 the protein levels of ATP synthase-α are significantly increased by 1.1-fold in M631L Tg compared with J20 Tg mice brains. The protein-fold change corresponding to ATP synthase-α between 2D-Western blots (1.1-fold) and PDQuest data (1.1-fold) are the same, thereby confirming the proteomics data. Further, the pI and MW of ATP synthase-α on 2D blot correspond to ATP synthase-α, thereby confirming the correct identification of this protein by MS analysis.
FIG. 4.

Validation studies were performed. ATP synthase α levels in the brain of J20 Tg and M631L Tg mice. (A) Representative 2D-Western blot images of ATP-ase levels in J20 Tg and M631L Tg mice. (B) Bar graph representation of data shown in (A). Values shown are mean±standard deviation; n=3 for J20 Tg, n=3 for M631L Tg; P<0.05. Fold change M631L/J20=1.06. (To see this illustration in color the reader is referred to the web version of this article at www.liebertpub.com/ars).
In conclusion, our proteomics study showed that in vivo Met35Leu substitution on Aβ(1–42) leads not only to decreased oxidative stress levels and decreased AD-like pathology (1), but also to lower levels of proteins in energy-, metabolic-, and mitochondrial-related protein pathways. Other identified pathways such as structural integrity, antioxidant defense, and cellular signaling may also play key roles in AD pathology as a result of the involvement of Met-35 in Aβ(1–42) in the overall levels of oxidative stress in the brain. The results of these proteomics studies have provided additional insights into the critical role of Met-35 in Aβ(1–42)-induced oxidative stress and suggest specific proteins whose alterations in the AD brain are consistent with the clinical presentation and pathology of this devastating dementing disorder.
Notes
All chemicals, proteases, and antibodies used in these studies were purchased from Sigma-Aldrich (St. Louis, MO) with exceptions noted. Criterion precast polyacrylamide gels, tris/glycine/sodium dodecyl sulfate (TGS) and 2-(N-morpholino) ethanesulfonic acid (XT MES) electrophoresis running buffers, ReadyStrip™ immobilized pH gradient (IPG) strips, mineral oil, Precision Plus Protein™ All Blue standards, SYPRO Ruby® Protein Stain, nitrocellulose membranes, dithiothreitol (DTT), iodoacetamide (IA), Biolytes, and urea were purchased from Bio-RAD (Hercules, CA). Rabbit polyclonal anti-ATP synthase alpha were purchased from Santa Cruz Biotecnology (Santa Cruz, CA) and MitoScience (Eugene, Oregon), respectively.
Animals
The Institutional Animal Care and Use Committee (IACUC) of the Buck Institute for Age Research approved all animal studies, which were carried out at the Buck Institute's Association for Assessment and Accreditation of Laboratory Animal Care (AAALAC)-accredited vivarium. The PDGF β-chain promoter-driven human amyloid precursor protein (hAPP) minigene carrying the Swedish (670/671KM→NL) and Indiana (717V→I) mutations (hAPPSw,In) was generated as described earlier and were of an identical expression level in all the mice used (1). All male PDAPP (J20 line) Tg mice were kept in their original C57BL/J6 background and were originally provided by Professor Lennart Mucke (Gladstone Institute and UC-San Francisco). J20 Tg expresser lines were maintained by heterozygous crosses with C57BL/J6 breeders (The Jackson Laboratory, Bar Harbor, ME), and all Tg animals were heterozygous with regard to the transgene. Male PDAPP(M631L) mice were derived in the same C57BL/J6 genetic background as PDAPP(J20) lines, using the same approach previously described (2). A mutation was introduced into the hAPPSw,In minigene that mutated Met-631 (human APP numbering) to leucin (Leu/L) in order to generate PDAPP(M631L) Tg mice by a direct injection into C57BL/J6 embryos. Tg PDAPP(M631L) mice express the PDAPP(Sw,In,M631L) transgene to levels 12.5% higher than those of the PDAPP(Sw,In) transgene in the PDAPP(J20) line. Male NTg littermates from each Tg line were used as controls in all studies. Experimental groups of animals were as follows: Tg PDAPP(J20), n=10; Tg PDAPP(M631L), n=10; and NTg PDAPP(M631), n=5. All mice were 9 months of age at sacrifice. We note that the J20 Tg mice and corresponding 2D-gels used in these studies were used in our recent report of proteome alterations in J20 Tg mice (6).
Sample preparation
A one-half portion of each mouse brain was homogenized using a Wheaton glass homogenizer (∼100 passes) in Media I buffer (0.32 M sucrose, 0.10 mM Tris HCl [pH 8.0], 0.10 mM MgCl2, 0.08 mM ethylenediamine tetraacetic acid [EDTA], 10 μg/ml leupeptin, 0.5 μg/ml pepstatin, and 11.5 μg/ml aprotinin; pH 8.0). The homogenates were vortexed and sonicated for 10 s at 20% power with a Fisher 550 Sonic Dismembrator (Pittsburgh, PA). Protein concentrations were determined according to the Pierce BCA method (Rockford, IL).
Isoelectric focusing
Brain proteins (200 μg) were precipitated by the addition of 15% ice-cold trichloroacetic acid (TCA) for 10 min. This was followed by centrifugation at 14,000 rpm (23,700 g) for 5 min at 4°C. Pellets were washed in Wash buffer [1:1 (v/v) ethanol:ethyl acetate] a total of four times to remove excess salts. After the final wash, 200 μl of rehydration buffer (8 M urea, 2 M thiourea, 50 mM DTT, 2.0% [w/v] 3-[3-(cholamidopropyl) dimethylammonio]-1-propanesulfonate (CHAPS), 0.2% Biolytes, bromophenol blue), was added to the samples, incubated for 2 h at room temperature (RT), and then sonicated for 10 s at 20% power. The samples (200 μl) were applied to 11 cm pH 3–10 ReadyStrip™ IPG strips and actively rehydrated at 20°C for 18 h at 50 V, followed by isoelectrofocusing at a constant temperature of 20°C beginning at 300 V for 2 h, 500 V for 2 h, 1000 V for 2 h, 8000 V for 8 h, and rapidly finishing at 8000 V for 10 h. Isoelectric focusing (IEF) strips were stored at −80°C until the second dimension of analysis was performed.
Two-dimensional-polyacrylamide gel electrophoresis
Individual two-dimensional-polyacrylamide gel electrophoresis (2D-PAGE) was performed on the brain from each mouse studied to separate the proteins on IEF strips based on molecular migration rate. The IEF strips were thawed and equilibrated for 10 min in equilibration buffer A (50 mM Tris-HCl pH 6.8, 6 M urea, 1% [w/v] sodium dodecyl sulfate [SDS], 30% [v/v] glycerol, and 0.5% DTT) and then re-equilibrated for 10 min in equilibration buffer B (50 mM Tris-HCl pH 6.8, 6 M urea, 1% [w/v] SDS, 30% [v/v] glycerol, and 4.5% IA). All the strips were rinsed in a 1× dilution of TGS running buffer before being placed into Criterion precast linear gradient (8–16%) Tris-HCl polyacrylamide gels. Precision Plus Protein™ Standards and samples were run at a constant voltage of 200 V for 65 min in a 1× dilution of TGS running buffer.
SYPRO Ruby® staining
After 2D-PAGE, the gels were incubated in a fixing solution (7% [v/v] acetic acid, 10% [v/v] methanol) for 20 min at RT. SYPRO Ruby® protein gel stain (∼50 ml) was added to the gels and allowed to stain overnight at RT on a gently rocking platform, followed by scanning of the gels with a Molecular Dynamics STORM Phosphoimager (λex/λem: 470/618 nm).
Image analysis
Spot intensities from SYPRO Ruby®-stained 2D-gel images of M631L Tg, J20 Tg, and M631 NTg samples were densitometrically quantified according to the total spot density using PDQuest analysis software from Bio-Rad (Hercules, CA). Intensities were normalized to total gel densities and/or densities of all valid spots on the gels. For the determination of spots with increased or decreased levels, we normalized spot density in M631L Tg samples compared with J20 Tg or M631 NTg samples. Only protein spots with a statistically significant difference based on a Student's t-test and a Mann–Whitney U test at 95% confidence (i.e., p<0.05) were considered for MS analysis.
In-gel trypsin digestion
Protein spots identified as being significantly altered were excised from 2D-gels with a clean, sterilized blade and transferred to Eppendorf microcentrifuge tubes. Gel plugs were then washed with 0.1 M ammonium bicarbonate (NH4HCO3) at RT for 15 min, followed by incubation with 100% acetonitrile at RT for 15 min. After solvent removal, gel plugs were dried in their respective tubes under a flow hood at RT. The plugs were incubated for 45 min in 20 μl of 20 mM DTT in 0.1 M NH4HCO3 at 56°C. The DTT/NH4HCO3 solution was then removed and replaced with 20 μl of 55 mM IA in 0.1 M NH4HCO3 and incubated with gentle agitation at RT in the dark for 30 min. Excess IA solution was removed, and the plugs were incubated for 15 min with 200 μl of 50 mM NH4HCO3 at RT. A volume of 200 μl of 100% acetonitrile was added to this solution and incubated for 15 min at RT. The solvent was removed, and the gel plugs were allowed to dry for 30 min at RT under a flow hood. The plugs were rehydrated with 20 ng/μl of modified trypsin (Promega, Madison, WI) in 50 mM NH4HCO3 in a shaking incubator overnight at 37°C. Enough trypsin solution was added to completely submerge the gel plugs.
Mass spectrometry
Salts and contaminants were removed from tryptic peptide solutions using C18 ZipTips (Sigma-Aldrich, St. Louis, MO), reconstituted to a volume of ∼15 μl in a 50:50 (water:acetonitrile) solution containing 0.1% formic acid. Tryptic peptides were analyzed with an automated Nanomate electrospray ([ESI], Advion Biosciences, Ithaca, NY) Orbitrap XL MS (ThermoScientific, Waltham, MA) platform. The Orbitrap MS was operated in a data-dependent mode whereby the eight most intense parent ions measured in the Fourier transform (FT) at 60,000 resolution were selected for ion trap fragmentation with the following conditions: injection time of 50 ms, 35% collision energy, MS/MS spectra were measured in the FT at 7500 resolution, and dynamic exclusion was set for 120 s. Each sample was acquired for a total of ∼2.5 min. MS/MS spectra were searched against the International Protein Index (IPI) Database (downloaded 03/05/09) using SEQUEST with the following specifications: two trypsin miscleavages, fixed carbamidomethyl modification, variable Met oxidation, parent tolerance 10 ppm, and fragment tolerance of 25 mmu or 0.01 Da. Results were filtered with the following criteria: Xcorr>1.5, 2.0, 2.5, 3.0 for +1, +2, +3, and +4 charge states, respectively, Delta CN >0.1, and p-value (protein and peptide) <0.01. Accession numbers from IPI were cross-correlated with SwissProt accession numbers for final protein identification. It should be noted that the proteins identified with a single peptide were kept for further analyses if multiple SC (number of observed MS/MS spectra) were observed in a single analysis or if the peptide was identified in a separate analysis and workup of the same protein spot.
2D-Western blotting
After 2D-PAGE, in-gel proteins were transferred onto a nitrocellulose membrane using a Trans-Blot Semi-Dry Transfer Cell system at 20 V for 2 h (Bio-RAD, Hercules, CA) for the immunochemical detection of ATP synthase-α. Post-transfer, membranes were incubated in a blocking solution of 3% bovine serum albumin in Wash Blot (a phosphate-buffered saline solution containing 0.04% [v/v] Tween 20 and 0.10 M NaCl) at RT for 2 h. After blocking, the membranes were incubated with rabbit polyclonal anti-ATP synthase-α (1:2000) (MitoScience, Eugene, OR) as primary antibody, for 2–3 h. Blots were rinsed thrice for 5 min each in Wash Blot, followed by 1 h incubation with rabbit immunoglobulin G alkaline phosphatase (1:3000) secondary antibody at RT. Blots were rinsed thrice for 5 min each in Wash Blot and colorimetrically developed using 5-bromo-4-chloro-3-indolyl phosphate dipotassium combined with nitrotetrazolium blue chloride (BCIP/NBT) in alkaline phosphate (ALP) buffer (0.1 M Tris, 0.1 M NaCl, 5 mM MgCl2·6H2O [pH 9.5]). After developing, the blots were allowed to dry overnight, scanned by using Adobe Photoshop 6.0 with a Canon CanoScan 8800F scanner, and quantified using ImageQuant TL software (GE Healthcare, Pittsburgh, PA).
Statistical analysis
All data are presented as mean±standard deviation (S.D.) or mean±standard error of the means, as noted, and statistical analyses were performed using a Mann–Whitney U statistical test and a two-tailed Student's t-test, wherein p<0.05 was considered significant for differential fold-change values. Only proteins with significant p-values from both tests were considered further for MS identification. Protein and peptide identifications obtained with the SEQUEST search algorithm with p<0.01 were considered statistically significant. To further validate SEQUEST identification, the location of protein spots (i.e., MW and pI) on 2D-gels was manually checked based on the expected MW and pI values from SwissProt database information.
Abbreviations Used
- 2D
two-dimensional
- Aβ
amyloid-beta
- AAALAC
Association for Assessment and Accreditation of Laboratory Animal Care
- AD
Alzheimer disease
- ALP
alkaline phosphate buffer
- APP
amyloid precursor protein
- ATP
adenosine triphosphate
- BASP1
brain acid soluble protein 1
- BCIP
5-bromo-4-chloro-3-indolyl phosphate dipotassium
- CA-2
carbonic anhydrase 2
- CHAPS
3-[3-(cholamidopropyl) dimethylammonio]-1-propanesulfonate
- DNA
deoxyribonucleic acid
- DTT
dithiothreitol
- EBE2N
ubiquitin-conjugation enzyme E2N
- EDTA
ethylenediamine tetraacetic acid
- ESI
electrospray ionization
- FT
Fourier transform
- GAPDH
glyceraldehyde-3-phosphate dehydrogenase
- GST
glutathione S-transferase
- GSTM1
glutathione S-transferase Mu 1
- hAPPSw,In
human amyloid precursor protein with Swedish and Indiana mutations
- Hsp90 B1
heat shock protein 90 B1
- IA
iodoacetamide
- IACUC
Institutional Animal Care and Use Committee
- IEF
isoelectric focusing
- IPG
immobilized pH gradient
- IPI
International Protein Index
- Leu/L
leucine
- Met/M
methionine
- MS
mass spectrometry
- MW
molecular weight
- NBT
nitrotetrazolium blue chloride
- NTg
non-transgenic
- P
probability of type I error
- PAGE
polyacrylamide gel electrophoresis
- PDAPP
platelet-derived growth factor-amyloid precursor protein transgene
- PDGF
platelet-derived growth factor
- PEBP-1
phosphaditylethanolamine binding-protein 1
- pI
isoelectric point
- Pin-1
peptidyl-prolyl cis/trans isomerase 1
- PGM1
phosphoglycerate mutase
- RT
room temperature
- SC
spectral counts
- SDS
sodium dodecyl sulfate
- SOD2
manganese superoxide dismutase
- SP
senile plaque
- TCA
trichloroacetic acid
- Tg
transgenic
- TGS
tris/glycine/sodium dodecyl sulfate
- TPI
triose phosphate isomerase
- VATB2
V-type proton ATPase subunit B
- VDAC1
voltage-dependent anion-selective channel protein 1
- XT-MES
2-(N-morpholino) ethanesulfonic acid
Acknowledgments
This research was supported in part by NIH grants to D.A.B. (AG-05119) and to D.E.B. (NS-45093, NS-33376, and AG-12282), as well as support from the Keck Foundation (to D.E.B.), the Joseph Drown Foundation (to D.E.B.), the Stephen D. Bechtel Foundation (to V.G.), the Alzheimer's Association (to D.E.B. and V.G.), and the UNCF/Merck Science Initiative Postdoctoral Fellowship (to R.A.S.R.). The authors thank Prof. Lennart Mucke for the J20 line of PDAPP mice and for the PDGF β-chain promoter-driven APPSw,In minigene.
References
- 1.Butterfield DA. Galvan V. Lange MB. Tang H. Sowell RA. Spilman P. Fombonne J. Gorostiza O. Zhang J. Sultana R. Bredesen DE. In vivo oxidative stress in brain of Alzheimer disease transgenic mice: requirement for methionine 35 in amyloid beta-peptide of APP. Free Radic Biol Med. 2010;48:136–144. doi: 10.1016/j.freeradbiomed.2009.10.035. [DOI] [PMC free article] [PubMed] [Google Scholar]
- 2.Butterfield DA. Reed T. Newman SF. Sultana R. Roles of amyloid β-peptide-associated oxidative stress and protein modifications in the pathogenesis of Alzheimer's disease and mild cognitive impairment. Free Radic Biol Med. 2007;43:658–677. doi: 10.1016/j.freeradbiomed.2007.05.037. [DOI] [PMC free article] [PubMed] [Google Scholar]
- 3.Cruts M. van Duijn CM. Backhovens H. Van den Broeck M. Wehnert A. Serneels S. Sherrington R. Hutton M. Hardy J. St. George-Hyslop PH. Hofman A. Van Broeckhoven C. Estimation of the genetic contribution of presenilin-1 and -2 mutations in a population-based study of presenile Alzheimer disease. Hum Mol Genet. 1998;7:43–51. doi: 10.1093/hmg/7.1.43. [DOI] [PubMed] [Google Scholar]
- 4.Drake J. Link CD. Butterfield DA. Oxidative stress precedes fibrillar deposition of Alzheimer's disease amyloid beta-peptide (1–42) in a transgenic Caenorhabditis elegans model. Neurobiol Aging. 2003;24:415–420. doi: 10.1016/s0197-4580(02)00225-7. [DOI] [PubMed] [Google Scholar]
- 5.Lu PJ. Wulf G. Zhou XZ. Davies P. Lu KP. The prolyl isomerase Pin1 restores the function of Alzheimer-associated phosphorylated tau protein. Nature. 1999;399:784–788. doi: 10.1038/21650. [DOI] [PubMed] [Google Scholar]
- 6.Robinson RAS. Lange MB. Sultana R. Galvan V. Fombonne J. Gorostiza O. Zhang J. Cai J. Pierce WM. Bredesen DE. Butterfield DA. Differential expression and redox proteomics analyses of an alzheimer disease transgenic mouse model: effects of the amyloid-β peptide of APP. Neuroscience. 2011;177:207–222. doi: 10.1016/j.neuroscience.2011.01.005. [DOI] [PMC free article] [PubMed] [Google Scholar]
- 7.Rulten S. Thorpe J. Kay J. Identification of eukaryotic parvulin homologues: a new subfamily of peptidylprolyl cis-trans isomerases. Biochem Biophys Res Commun. 1999;259:557–562. doi: 10.1006/bbrc.1999.0828. [DOI] [PubMed] [Google Scholar]
- 8.Selkoe DJ. Amyloid β-protein and the genetics of Alzheimer's disease. J Biol Chem. 1996;271:18295–18298. doi: 10.1074/jbc.271.31.18295. [DOI] [PubMed] [Google Scholar]
- 9.Yatin SM. Varadarajan S. Link CD. Butterfield DA. In vitro and in vivo oxidative stress associated with Alzheimer's amyloid beta-peptide (1–42) Neurobiol Aging. 1999;20:325–330. doi: 10.1016/s0197-4580(99)00056-1. discussion 339–342. [DOI] [PubMed] [Google Scholar]